ยินดีด้วย

การวิเคราะห์ข้อมูลเชิงสำรวจด้วย Python

George Boorman

Curriculum Manager, DataCamp

การตรวจสอบและการยืนยันข้อมูล
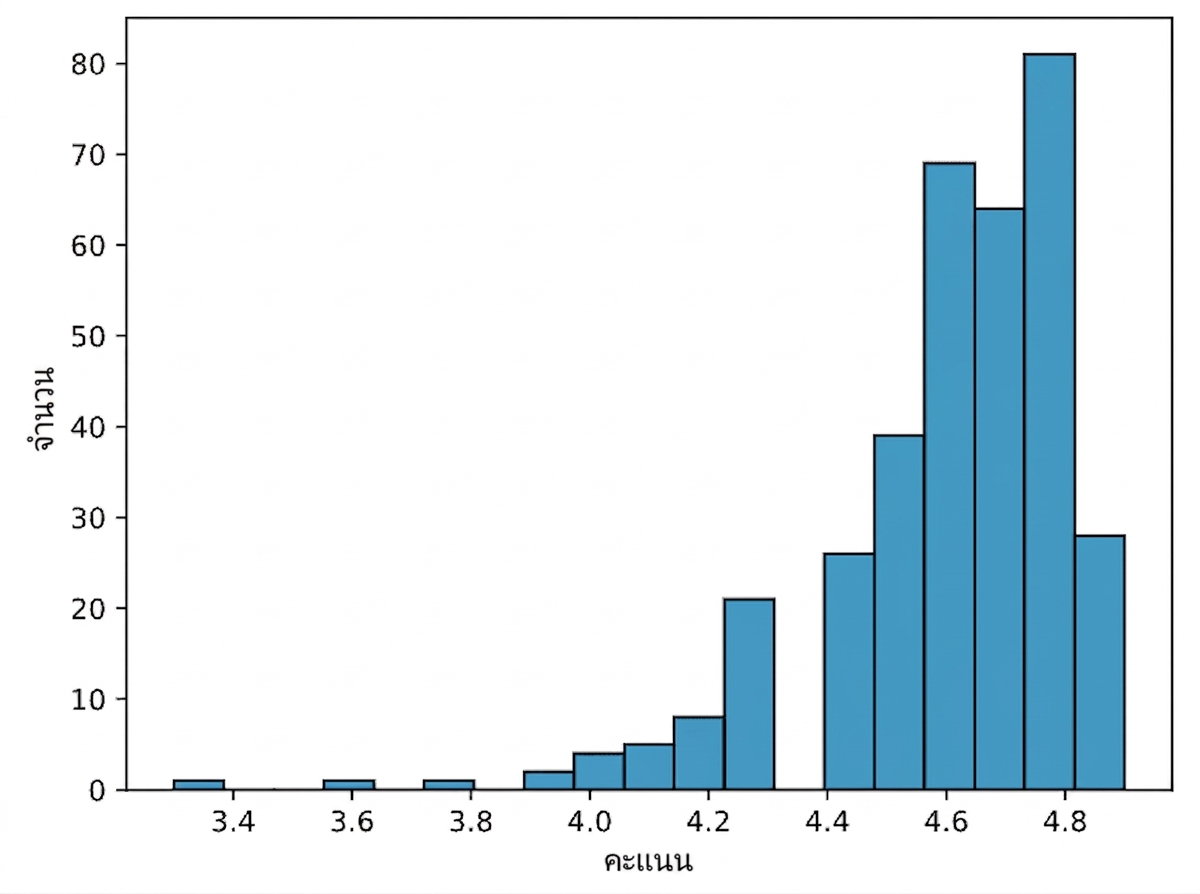
ฮิสโตแกรมของคะแนนหนังสือ

books["year"] = books["year"].astype(int)
books.dtypes
name       object
author     object
rating    float64
year        int64
genre      object
dtype: object
การวิเคราะห์ข้อมูลเชิงสำรวจด้วย Python

การรวมกลุ่มข้อมูล

books.groupby("genre").agg(
    mean_rating=("rating", "mean"),
    std_rating=("rating", "std"),
    median_year=("year", "median")
)
|  genre      | mean_rating | std_rating | median_year |
|-------------|-------------|------------|-------------|
|   Childrens |    4.780000 |   0.122370 |      2015.0 |
|     Fiction |    4.570229 |   0.281123 |      2013.0 |
| Non Fiction |    4.598324 |   0.179411 |      2013.0 |
การวิเคราะห์ข้อมูลเชิงสำรวจด้วย Python

การจัดการข้อมูลที่หายไป

print(salaries.isna().sum())
Working_Year            12
Designation             27
Experience              33
Employment_Status       31
Employee_Location       28
Company_Size            40
Remote_Working_Ratio    24
Salary_USD              60
dtype: int64
การวิเคราะห์ข้อมูลเชิงสำรวจด้วย Python

การจัดการข้อมูลที่หายไป

  • ลบค่าที่หายไป


  • แทนค่าด้วยค่าเฉลี่ย มัธยฐาน หรือฐานนิยม


  • แทนค่าตามกลุ่มย่อย


salaries_dict = salaries.groupby("Experience")["Salary_USD"].median().to_dict()
salaries["Salary_USD"] = salaries["Salary_USD"].fillna(salaries["Experience"].map(salaries_dict))
การวิเคราะห์ข้อมูลเชิงสำรวจด้วย Python

การวิเคราะห์ข้อมูลเชิงหมวดหมู่

salaries["Job_Category"] = np.select(conditions, 
                                     job_categories, 
                                     default="Other")
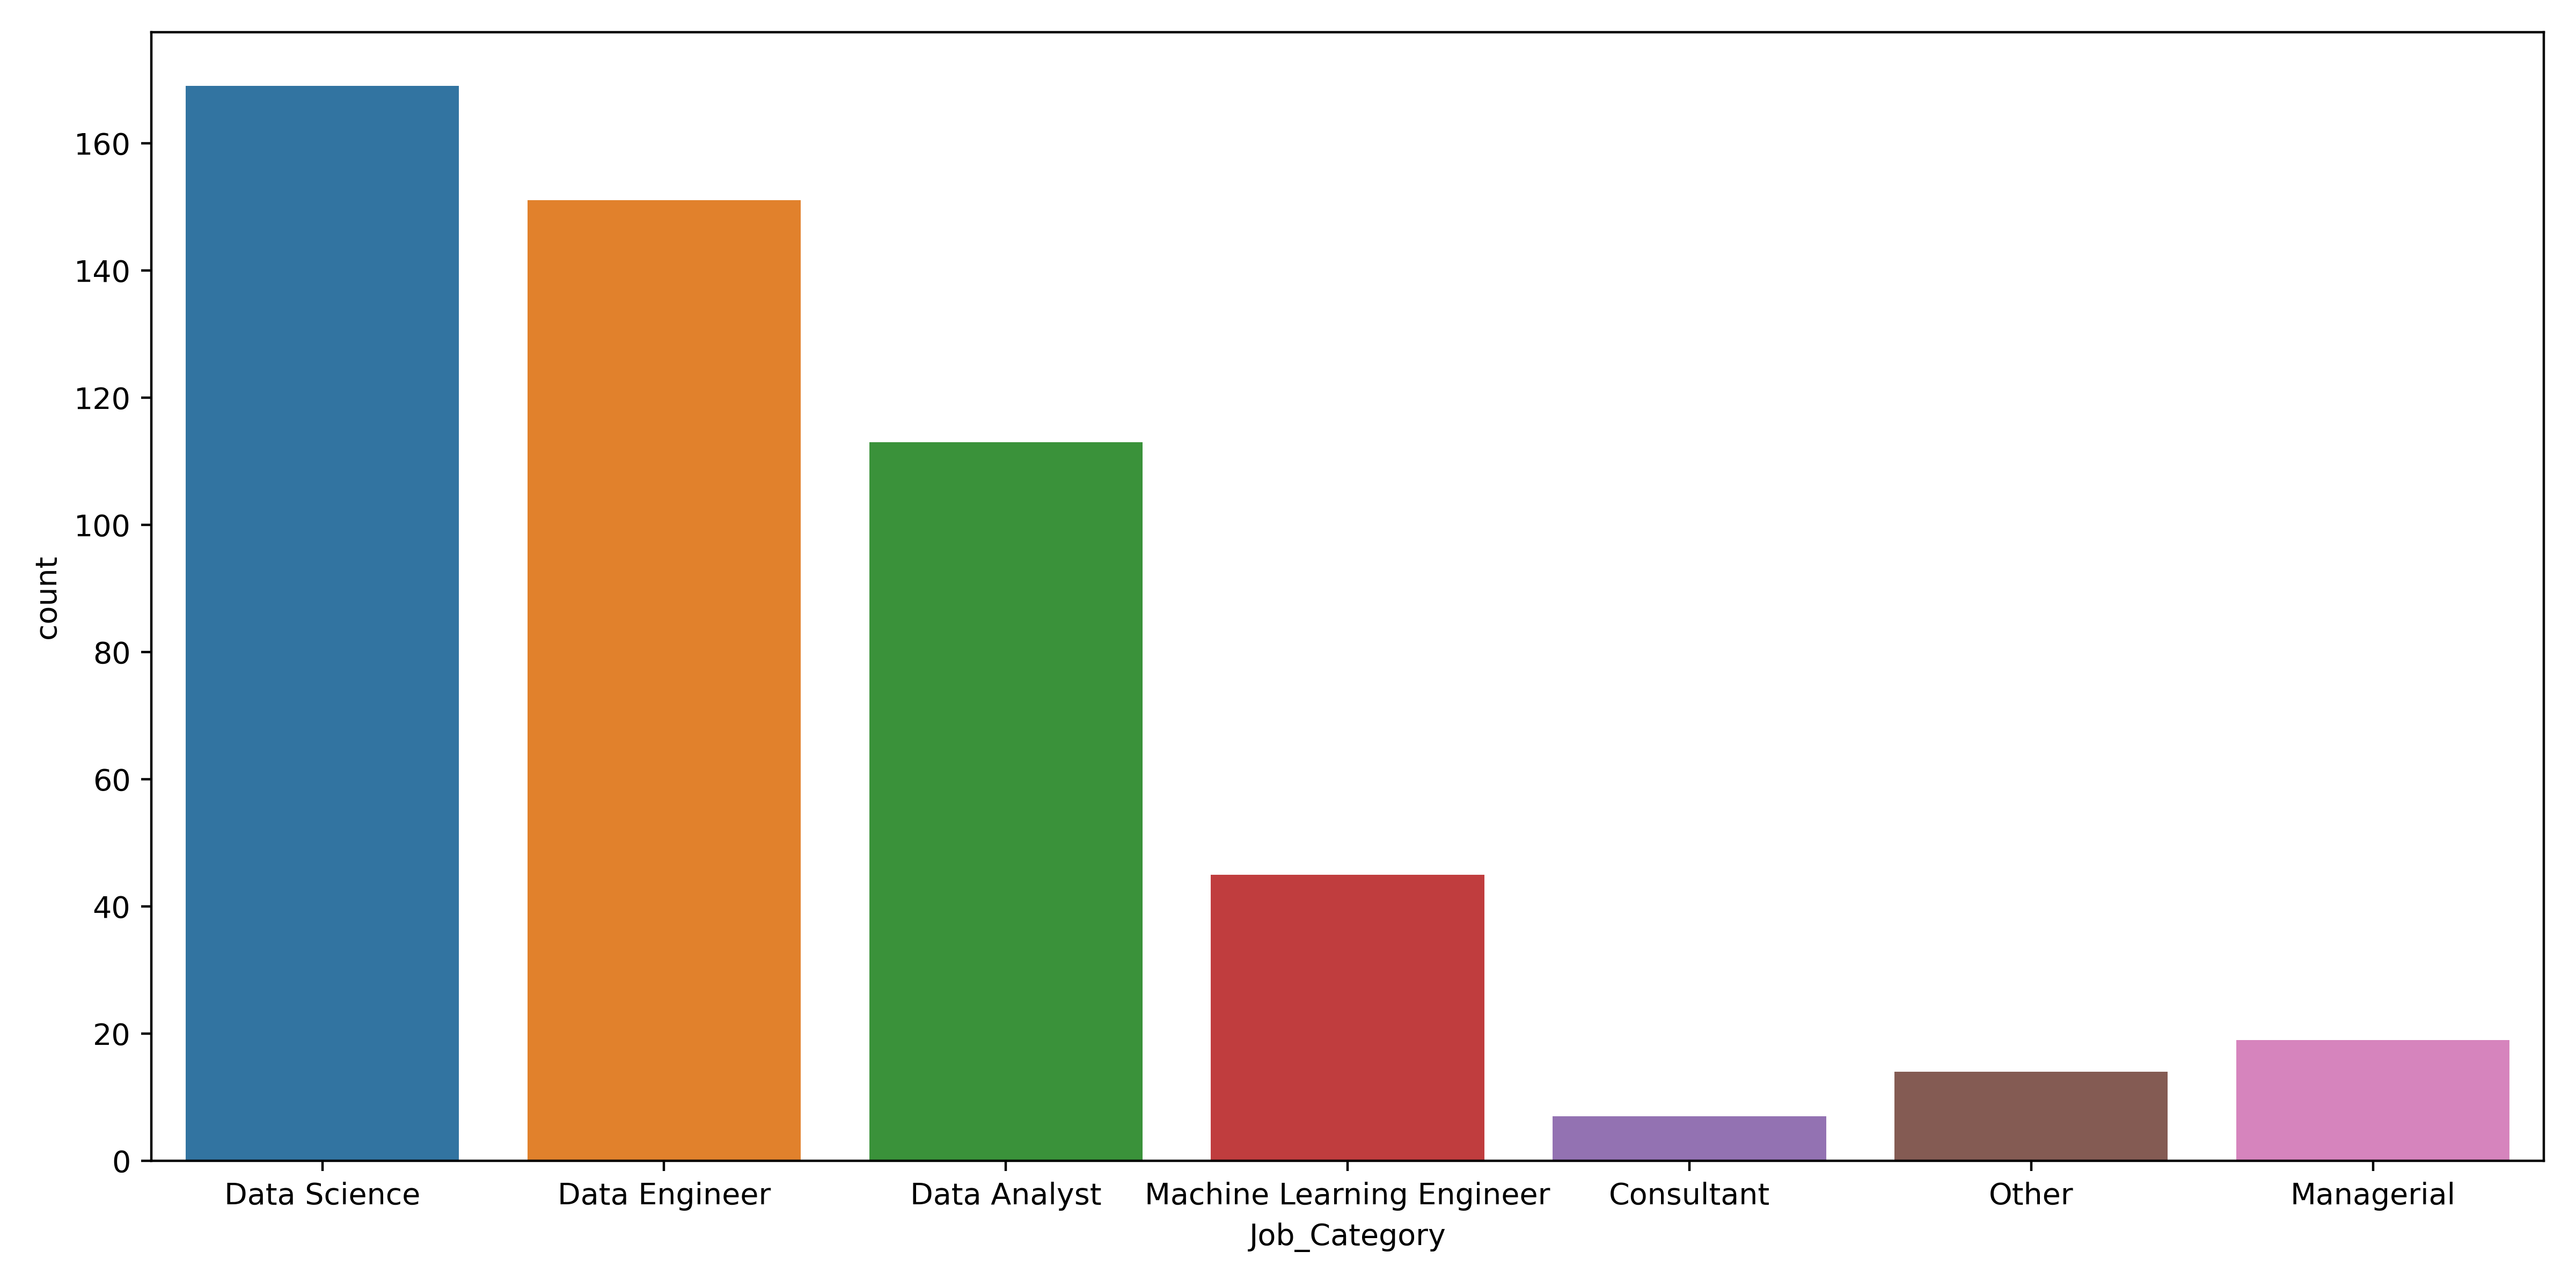
กราฟแท่งแสดงจำนวนงานแยกตามหมวดหมู่

การวิเคราะห์ข้อมูลเชิงสำรวจด้วย Python

การใช้ lambda functions

การใช้งาน lambda function

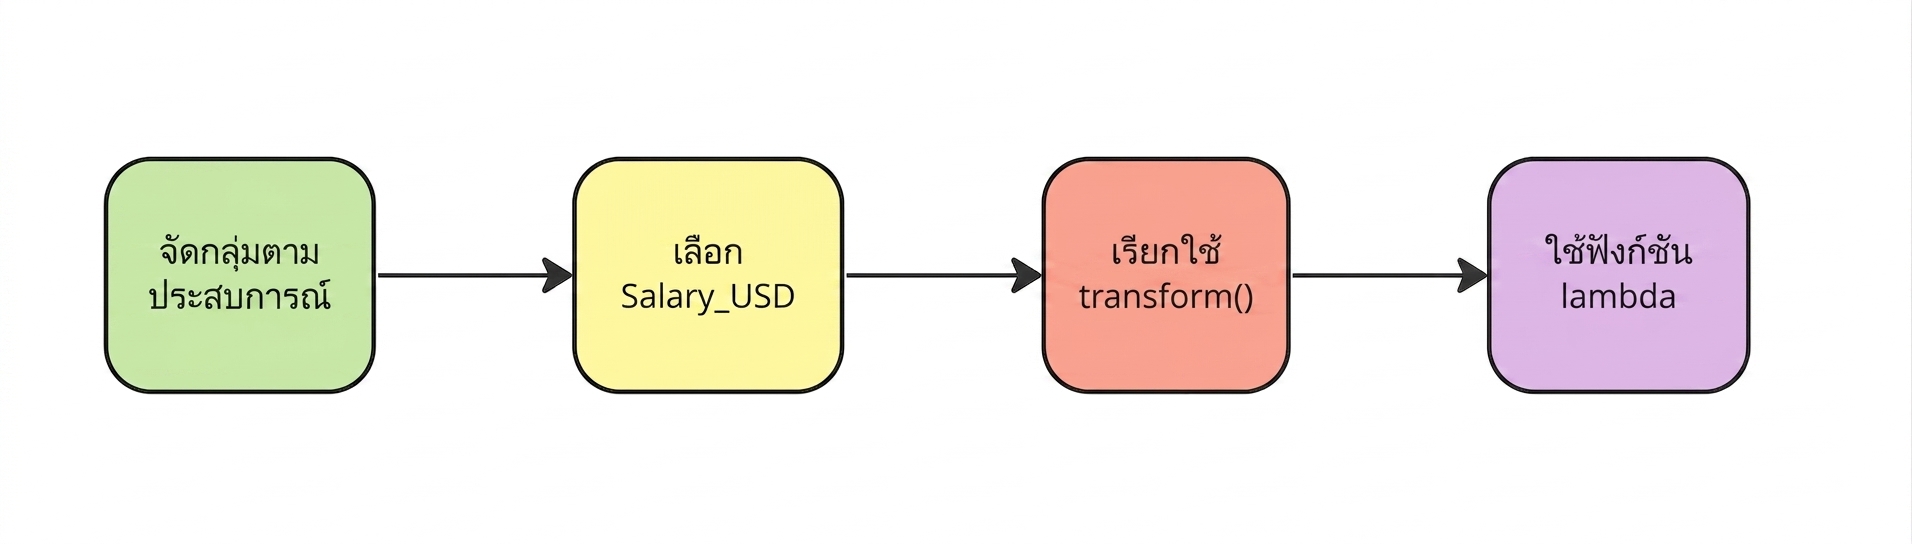
salaries["std_dev"] = salaries.groupby("Experience")["Salary_USD"].transform(lambda x: x.std())
การวิเคราะห์ข้อมูลเชิงสำรวจด้วย Python

การจัดการค่าผิดปกติ

sns.boxplot(data=salaries,
            y="Salary_USD")
plt.show()
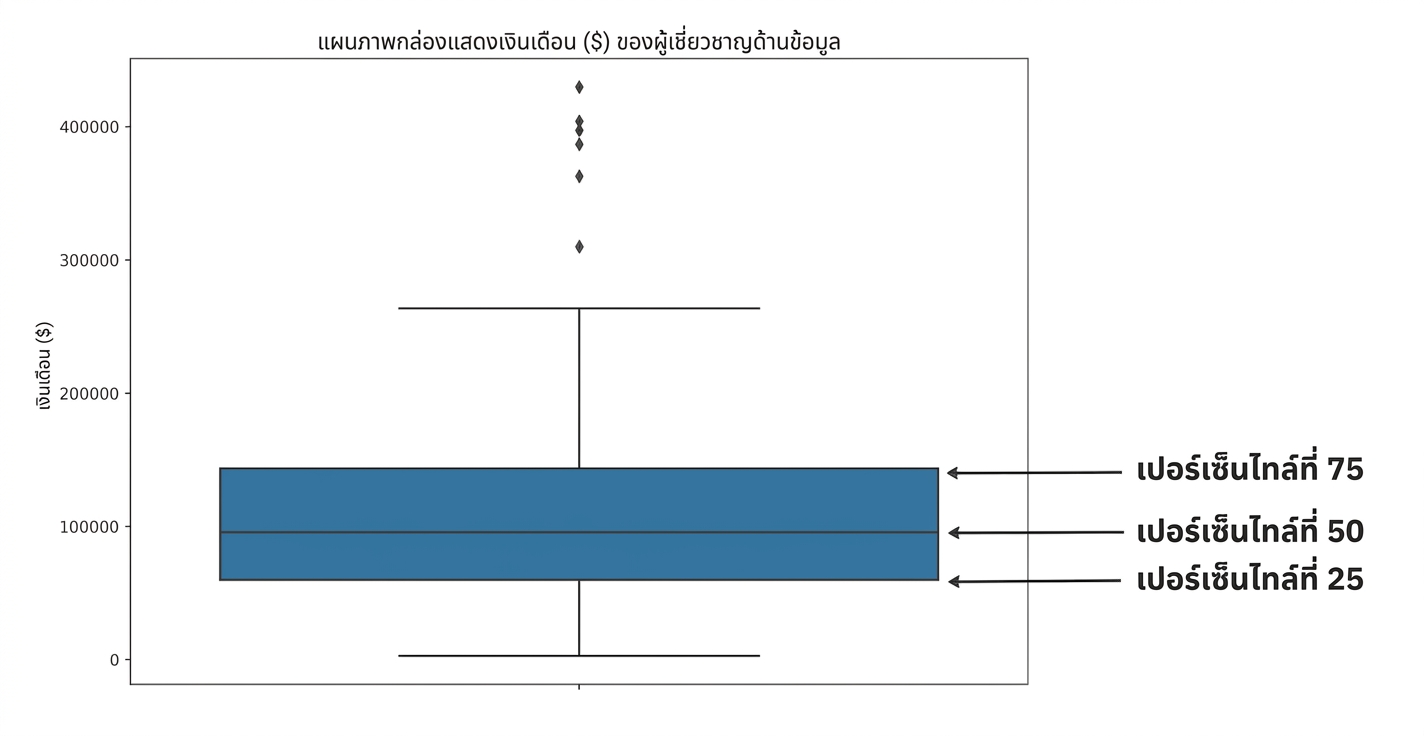
Box plot ของเงินเดือนผู้เชี่ยวชาญด้านข้อมูล แสดงเปอร์เซ็นไทล์ที่ 25 ที่ขอบล่างของกล่อง เปอร์เซ็นไทล์ที่ 50 เป็นเส้นกลาง และเปอร์เซ็นไทล์ที่ 75 ที่ขอบบนของกล่อง

การวิเคราะห์ข้อมูลเชิงสำรวจด้วย Python

รูปแบบตามช่วงเวลา

sns.lineplot(data=divorce, x="marriage_month", y="marriage_duration")
plt.show()
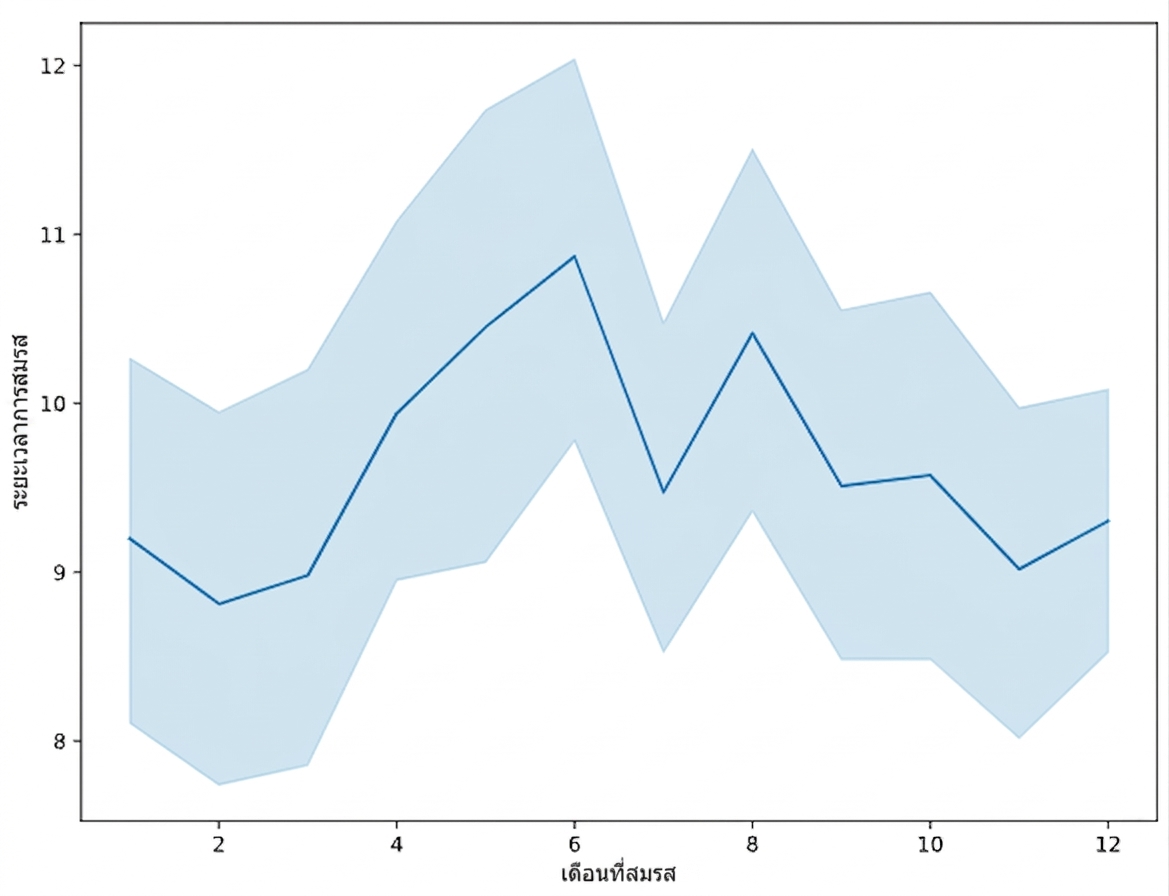
กราฟเส้นแสดงความสัมพันธ์ระหว่างเดือนที่แต่งงานกับระยะเวลาการสมรส

การวิเคราะห์ข้อมูลเชิงสำรวจด้วย Python

ค่าสหสัมพันธ์

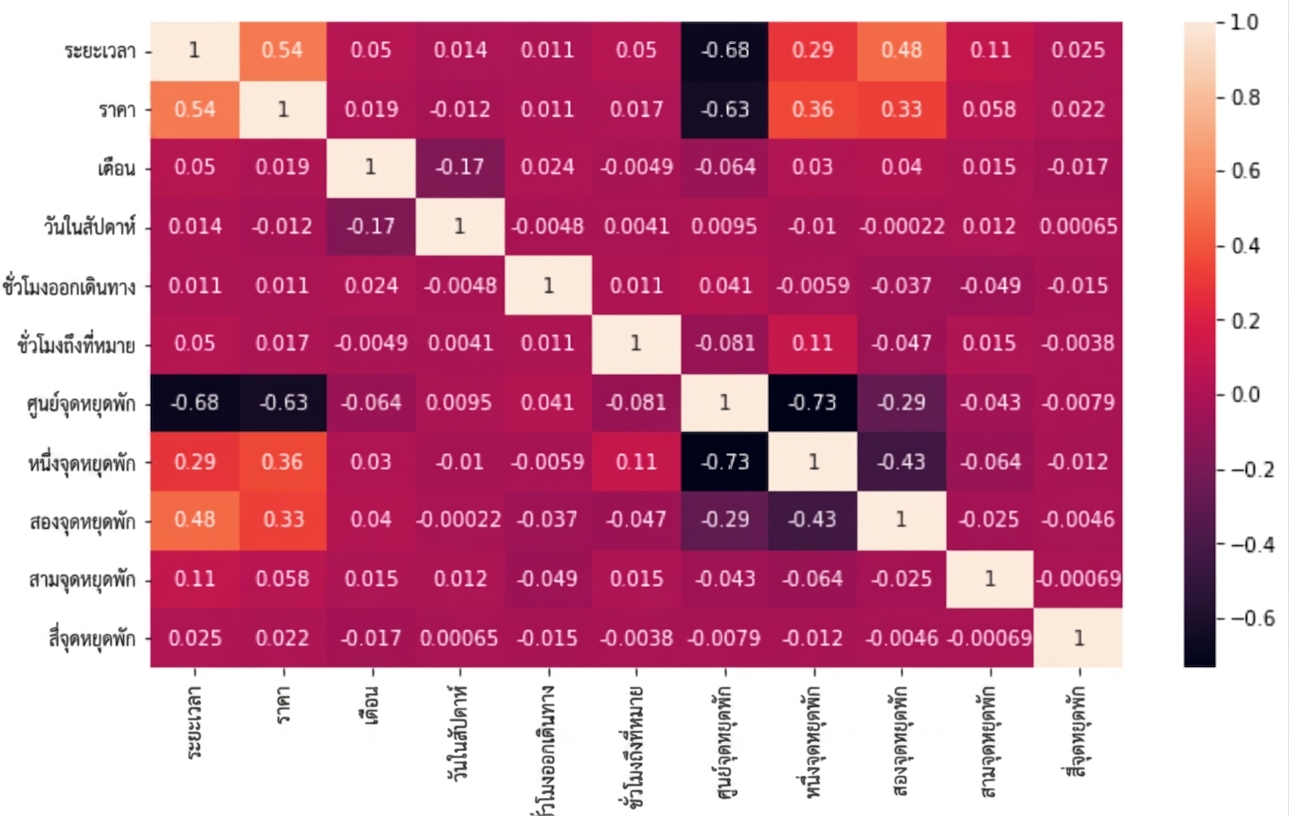
sns.heatmap(divorce.corr(numeric_only=True), annot=True)
plt.show()
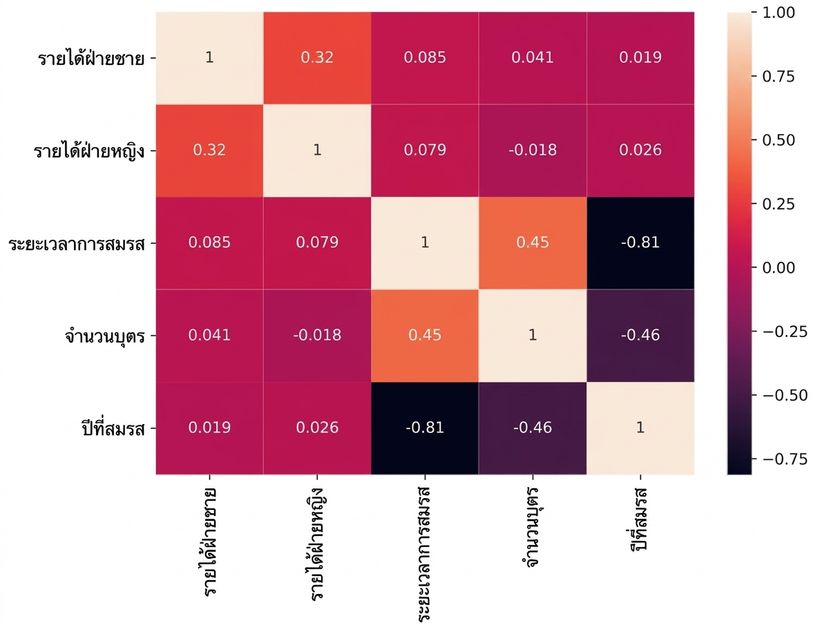
แผนที่ความร้อนแสดงค่าสหสัมพันธ์ของข้อมูลการหย่าร้าง

การวิเคราะห์ข้อมูลเชิงสำรวจด้วย Python

การกระจายของข้อมูล

sns.kdeplot(data=divorce, x="marriage_duration", hue="education_man", cut=0)
plt.show()
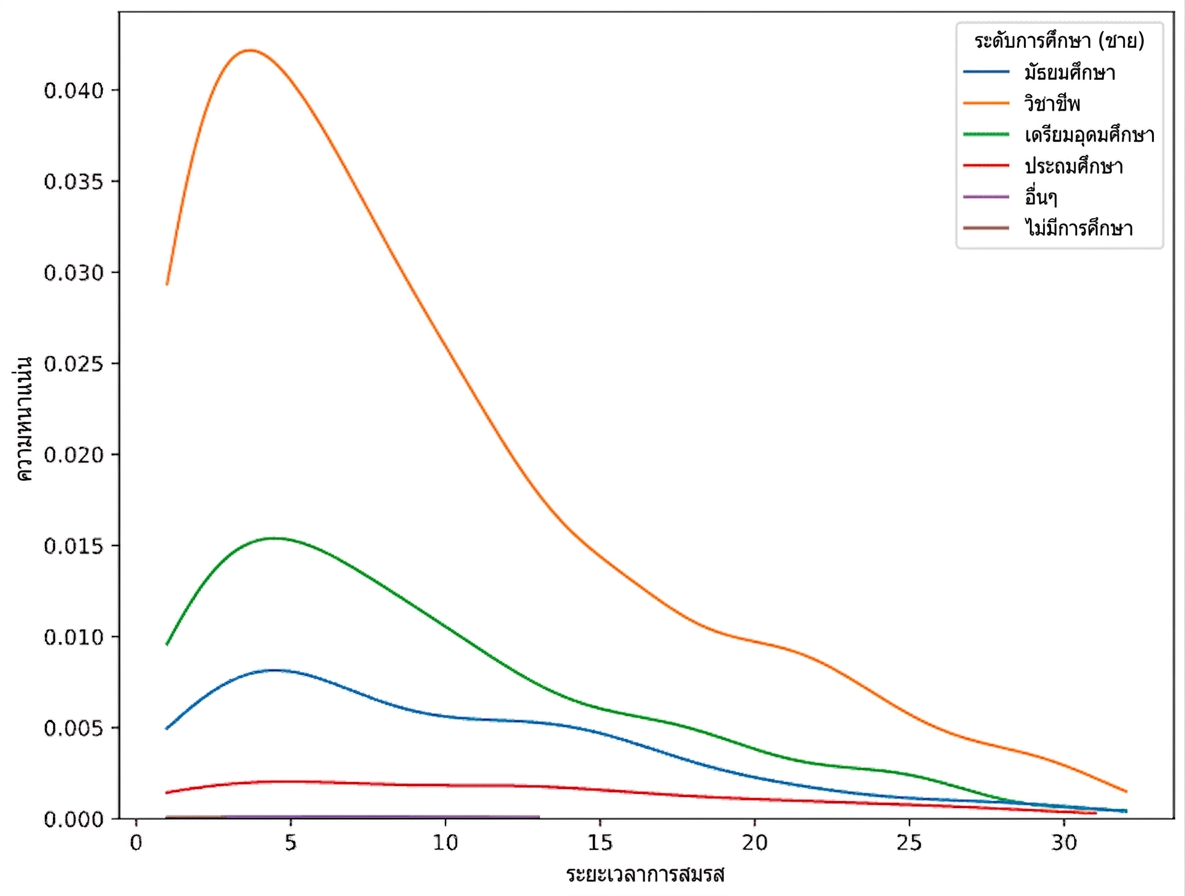
KDE plot ของระยะเวลาการสมรส โดยใช้ hue ตาม education_man และ cut เท่ากับศูนย์

การวิเคราะห์ข้อมูลเชิงสำรวจด้วย Python

การทำ Cross-tabulation

pd.crosstab(planes["Source"], planes["Destination"],
            values=planes["Price"], aggfunc="median")
Destination  Banglore   Cochin   Delhi  Hyderabad  Kolkata  New Delhi
Source                                                               
Banglore          NaN      NaN  4823.0        NaN      NaN    10976.5
Chennai           NaN      NaN     NaN        NaN   3850.0        NaN
Delhi             NaN  10262.0     NaN        NaN      NaN        NaN
Kolkata        9345.0      NaN     NaN        NaN      NaN        NaN
Mumbai            NaN      NaN     NaN     3342.0      NaN        NaN
การวิเคราะห์ข้อมูลเชิงสำรวจด้วย Python

pd.cut()

กำหนด bins

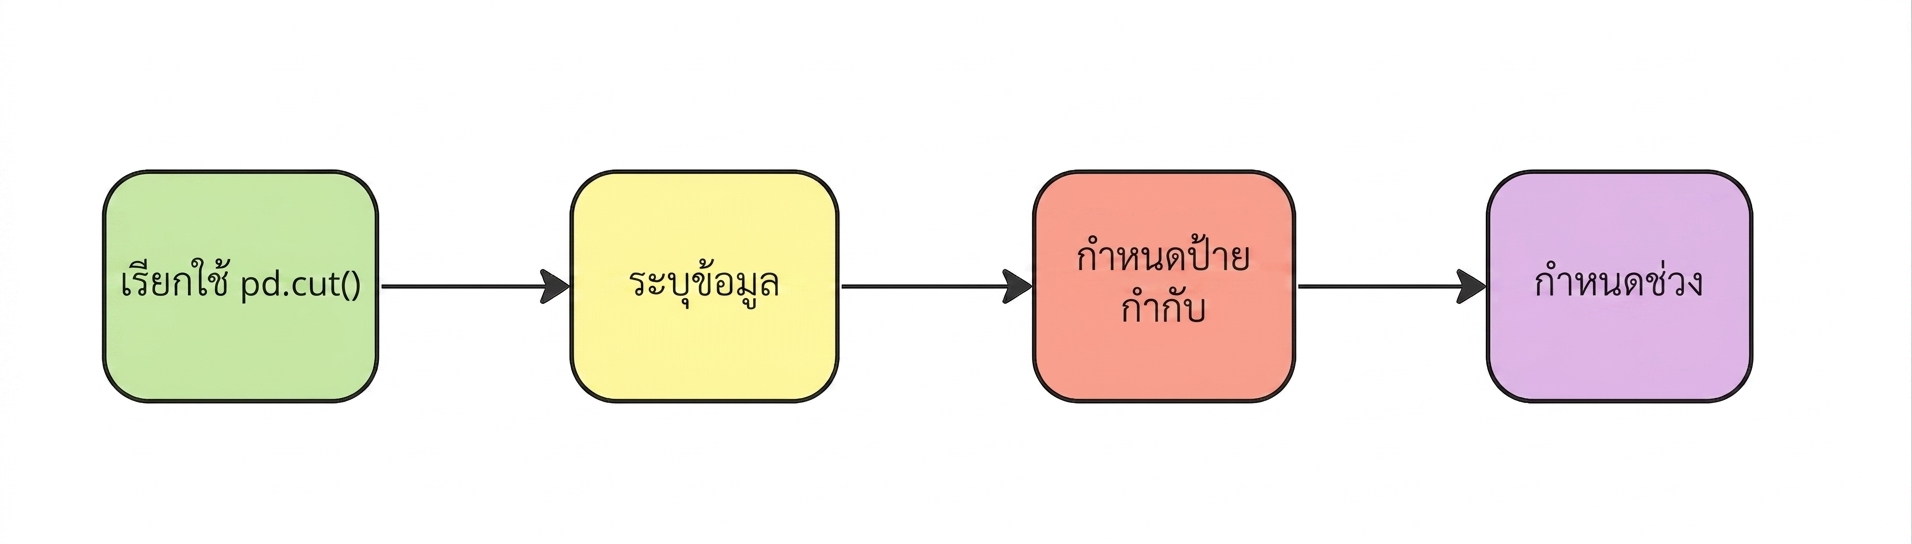
planes["Price_Category"] = pd.cut(planes["Price"],
                                  labels=labels,
                                  bins=bins)
การวิเคราะห์ข้อมูลเชิงสำรวจด้วย Python

การมองข้อมูลแบบลำเอียง

แผนที่ความร้อนแสดงค่าสหสัมพันธ์ตามจำนวนจุดแวะพัก

การวิเคราะห์ข้อมูลเชิงสำรวจด้วย Python

การตั้งสมมติฐาน

sns.barplot(data=planes, x="Airline", y="Duration")
plt.show()
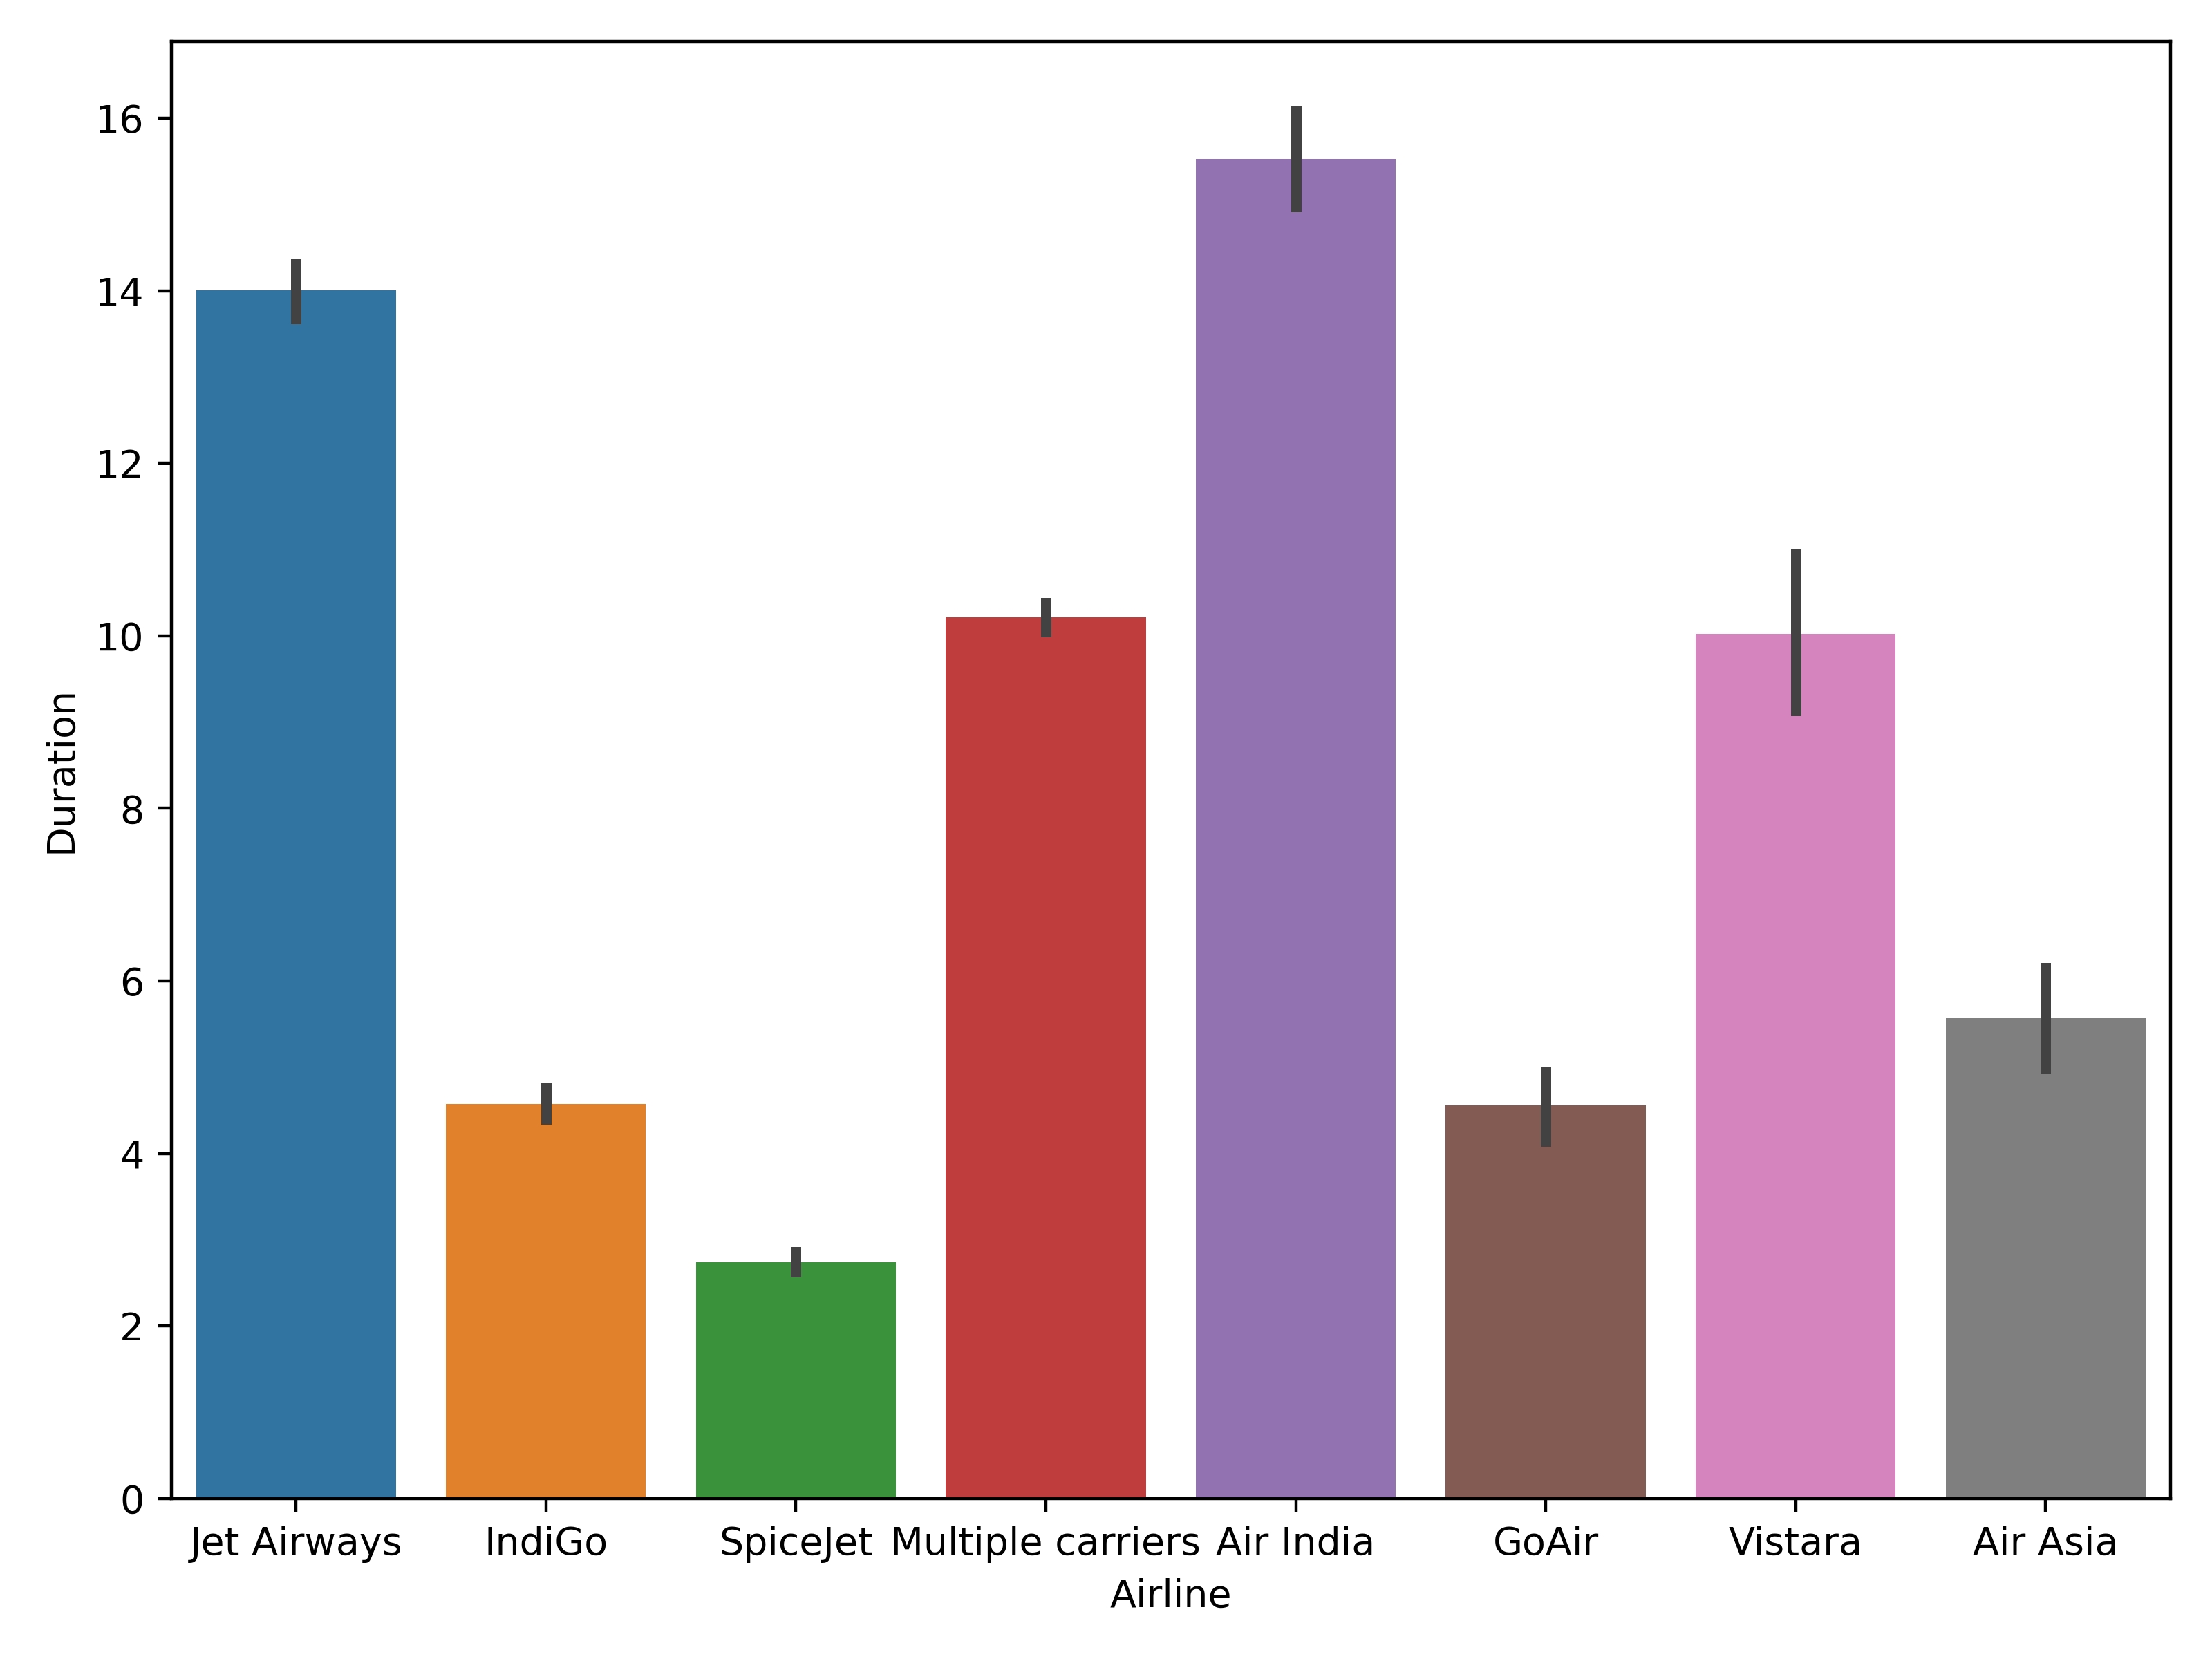
กราฟแท่งแสดงระยะเวลาการบินเทียบกับสายการบิน

การวิเคราะห์ข้อมูลเชิงสำรวจด้วย Python

ขั้นตอนถัดไป

การวิเคราะห์ข้อมูลเชิงสำรวจด้วย Python

ยินดีด้วย!

การวิเคราะห์ข้อมูลเชิงสำรวจด้วย Python

Preparing Video For Download...