การสร้างฟีเจอร์ใหม่

การวิเคราะห์ข้อมูลเชิงสำรวจด้วย Python

George Boorman

Curriculum Manager, DataCamp

สหสัมพันธ์

sns.heatmap(planes.corr(numeric_only=True), annot=True)
plt.show()

Heatmap แสดงค่าสัมประสิทธิ์สหสัมพันธ์เพียร์สัน 0.54 ระหว่าง Price และ Duration

การวิเคราะห์ข้อมูลเชิงสำรวจด้วย Python

ดูประเภทข้อมูล

print(planes.dtypes)
Airline                    object
Date_of_Journey    datetime64[ns]
Source                     object
Destination                object
Route                      object
Dep_Time           datetime64[ns]
Arrival_Time       datetime64[ns]
Duration                  float64
Total_Stops                object
Additional_Info            object
Price                     float64
dtype: object
การวิเคราะห์ข้อมูลเชิงสำรวจด้วย Python

จำนวนจุดแวะพัก

print(planes["Total_Stops"].value_counts())
1 stop      4107
non-stop    2584
2 stops     1127
3 stops       29
4 stops        1
Name: Total_Stops, dtype: int64
การวิเคราะห์ข้อมูลเชิงสำรวจด้วย Python

ทำความสะอาดข้อมูลจำนวนจุดแวะพัก

planes["Total_Stops"] = planes["Total_Stops"].str.replace(" stops", "")

planes["Total_Stops"] = planes["Total_Stops"].str.replace(" stop", "")
planes["Total_Stops"] = planes["Total_Stops"].str.replace("non-stop", "0")
planes["Total_Stops"] = planes["Total_Stops"].astype(int)
การวิเคราะห์ข้อมูลเชิงสำรวจด้วย Python

สหสัมพันธ์

sns.heatmap(planes.corr(numeric_only=True), annot=True)
plt.show()

Heatmap แสดงค่าสัมประสิทธิ์สหสัมพันธ์เพียร์สัน 0.62 ระหว่าง Price กับ Total Stops และ 0.74 ระหว่าง Duration กับ Total Stops

การวิเคราะห์ข้อมูลเชิงสำรวจด้วย Python

วันที่

print(planes.dtypes)
Airline                    object
Date_of_Journey    datetime64[ns]
Source                     object
Destination                object
Route                      object
Dep_Time           datetime64[ns]
Arrival_Time       datetime64[ns]
Duration                  float64
Total_Stops                 int64
Additional_Info            object
Price                     float64
dtype: object
การวิเคราะห์ข้อมูลเชิงสำรวจด้วย Python

ดึงข้อมูลเดือนและวันในสัปดาห์

planes["month"] = planes["Date_of_Journey"].dt.month

planes["weekday"] = planes["Date_of_Journey"].dt.weekday
print(planes[["month", "weekday", "Date_of_Journey"]].head())
   month  weekday   Date_of_Journey
0      9        4        2019-09-06
1     12        3        2019-12-05
2      1        3        2019-01-03
3      6        0        2019-06-24
4     12        1        2019-12-03
การวิเคราะห์ข้อมูลเชิงสำรวจด้วย Python

เวลาออกเดินทางและเวลาถึง

planes["Dep_Hour"] = planes["Dep_Time"].dt.hour
planes["Arrival_Hour"] = planes["Arrival_Time"].dt.hour
การวิเคราะห์ข้อมูลเชิงสำรวจด้วย Python

สหสัมพันธ์

Heatmap แสดงว่าแอตทริบิวต์วันที่/เวลาไม่มีความสัมพันธ์กับราคา

การวิเคราะห์ข้อมูลเชิงสำรวจด้วย Python

การสร้างหมวดหมู่

print(planes["Price"].describe())
count     7848.000000
mean      9035.413609
std       4429.822081
min       1759.000000
25%       5228.000000
50%       8355.000000
75%      12373.000000
max      54826.000000
Name: Price, dtype: float64
ช่วงราคา ประเภทตั๋ว
<= 5228 Economy
> 5228 <= 8355 Premium Economy
> 8335 <= 12373 Business Class
> 12373 First Class
การวิเคราะห์ข้อมูลเชิงสำรวจด้วย Python

สถิติเชิงพรรณนา

twenty_fifth = planes["Price"].quantile(0.25)

median = planes["Price"].median()
seventy_fifth = planes["Price"].quantile(0.75)
maximum = planes["Price"].max()
การวิเคราะห์ข้อมูลเชิงสำรวจด้วย Python

labels และ bins

labels = ["Economy", "Premium Economy", "Business Class", "First Class"]

bins = [0, twenty_fifth, median, seventy_fifth, maximum]
การวิเคราะห์ข้อมูลเชิงสำรวจด้วย Python

pd.cut()

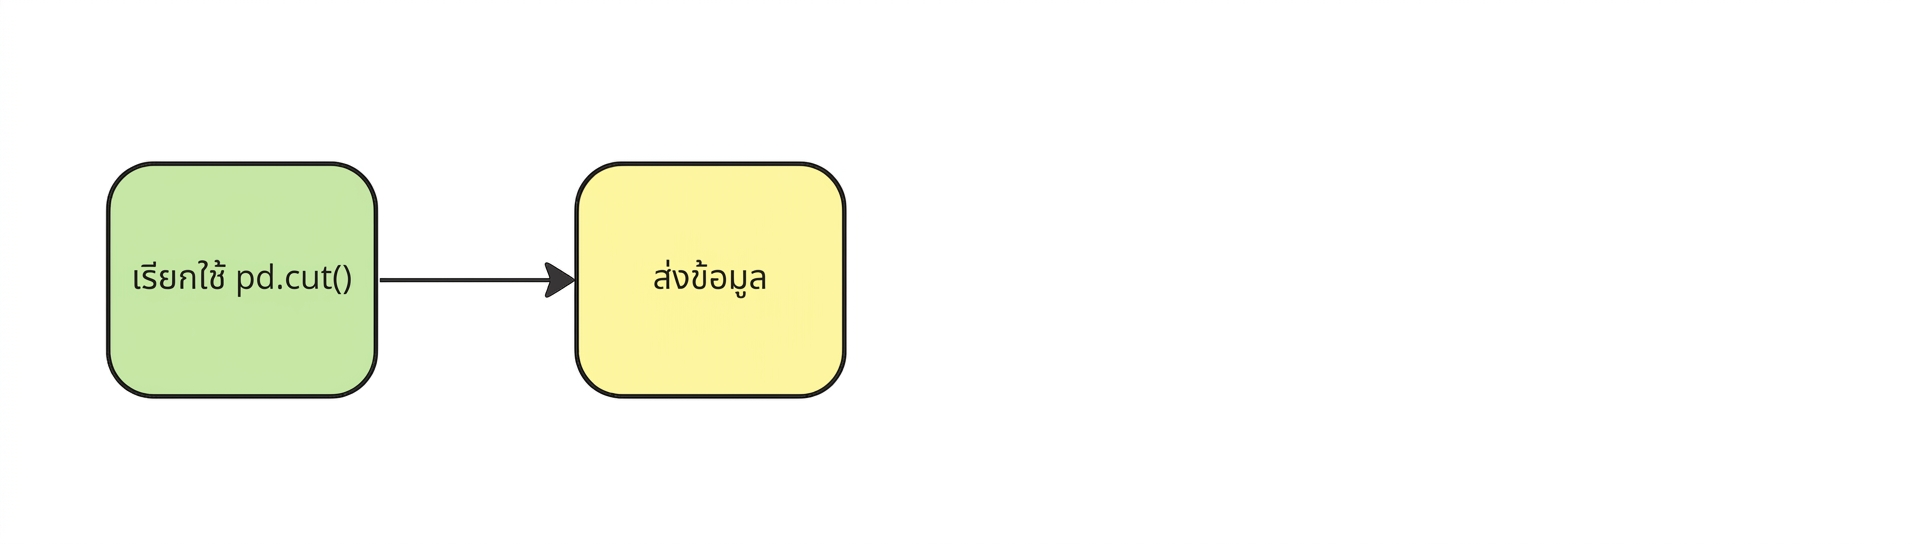
เรียกใช้ pd.cut

planes["Price_Category"] = pd.cut(


การวิเคราะห์ข้อมูลเชิงสำรวจด้วย Python

pd.cut()

ส่งข้อมูลเข้าไป

planes["Price_Category"] = pd.cut(planes["Price"],


การวิเคราะห์ข้อมูลเชิงสำรวจด้วย Python

pd.cut()

กำหนด labels

planes["Price_Category"] = pd.cut(planes["Price"],
                                  labels=labels,

การวิเคราะห์ข้อมูลเชิงสำรวจด้วย Python

pd.cut()

กำหนด bins

planes["Price_Category"] = pd.cut(planes["Price"],
                                  labels=labels,
                                  bins=bins)
การวิเคราะห์ข้อมูลเชิงสำรวจด้วย Python

หมวดหมู่ราคา

print(planes[["Price","Price_Category"]].head())
     Price   Price_Category
0  13882.0      First Class
1   6218.0  Premium Economy
2  13302.0      First Class
3   3873.0          Economy
4  11087.0   Business Class
การวิเคราะห์ข้อมูลเชิงสำรวจด้วย Python

หมวดหมู่ราคาตามสายการบิน

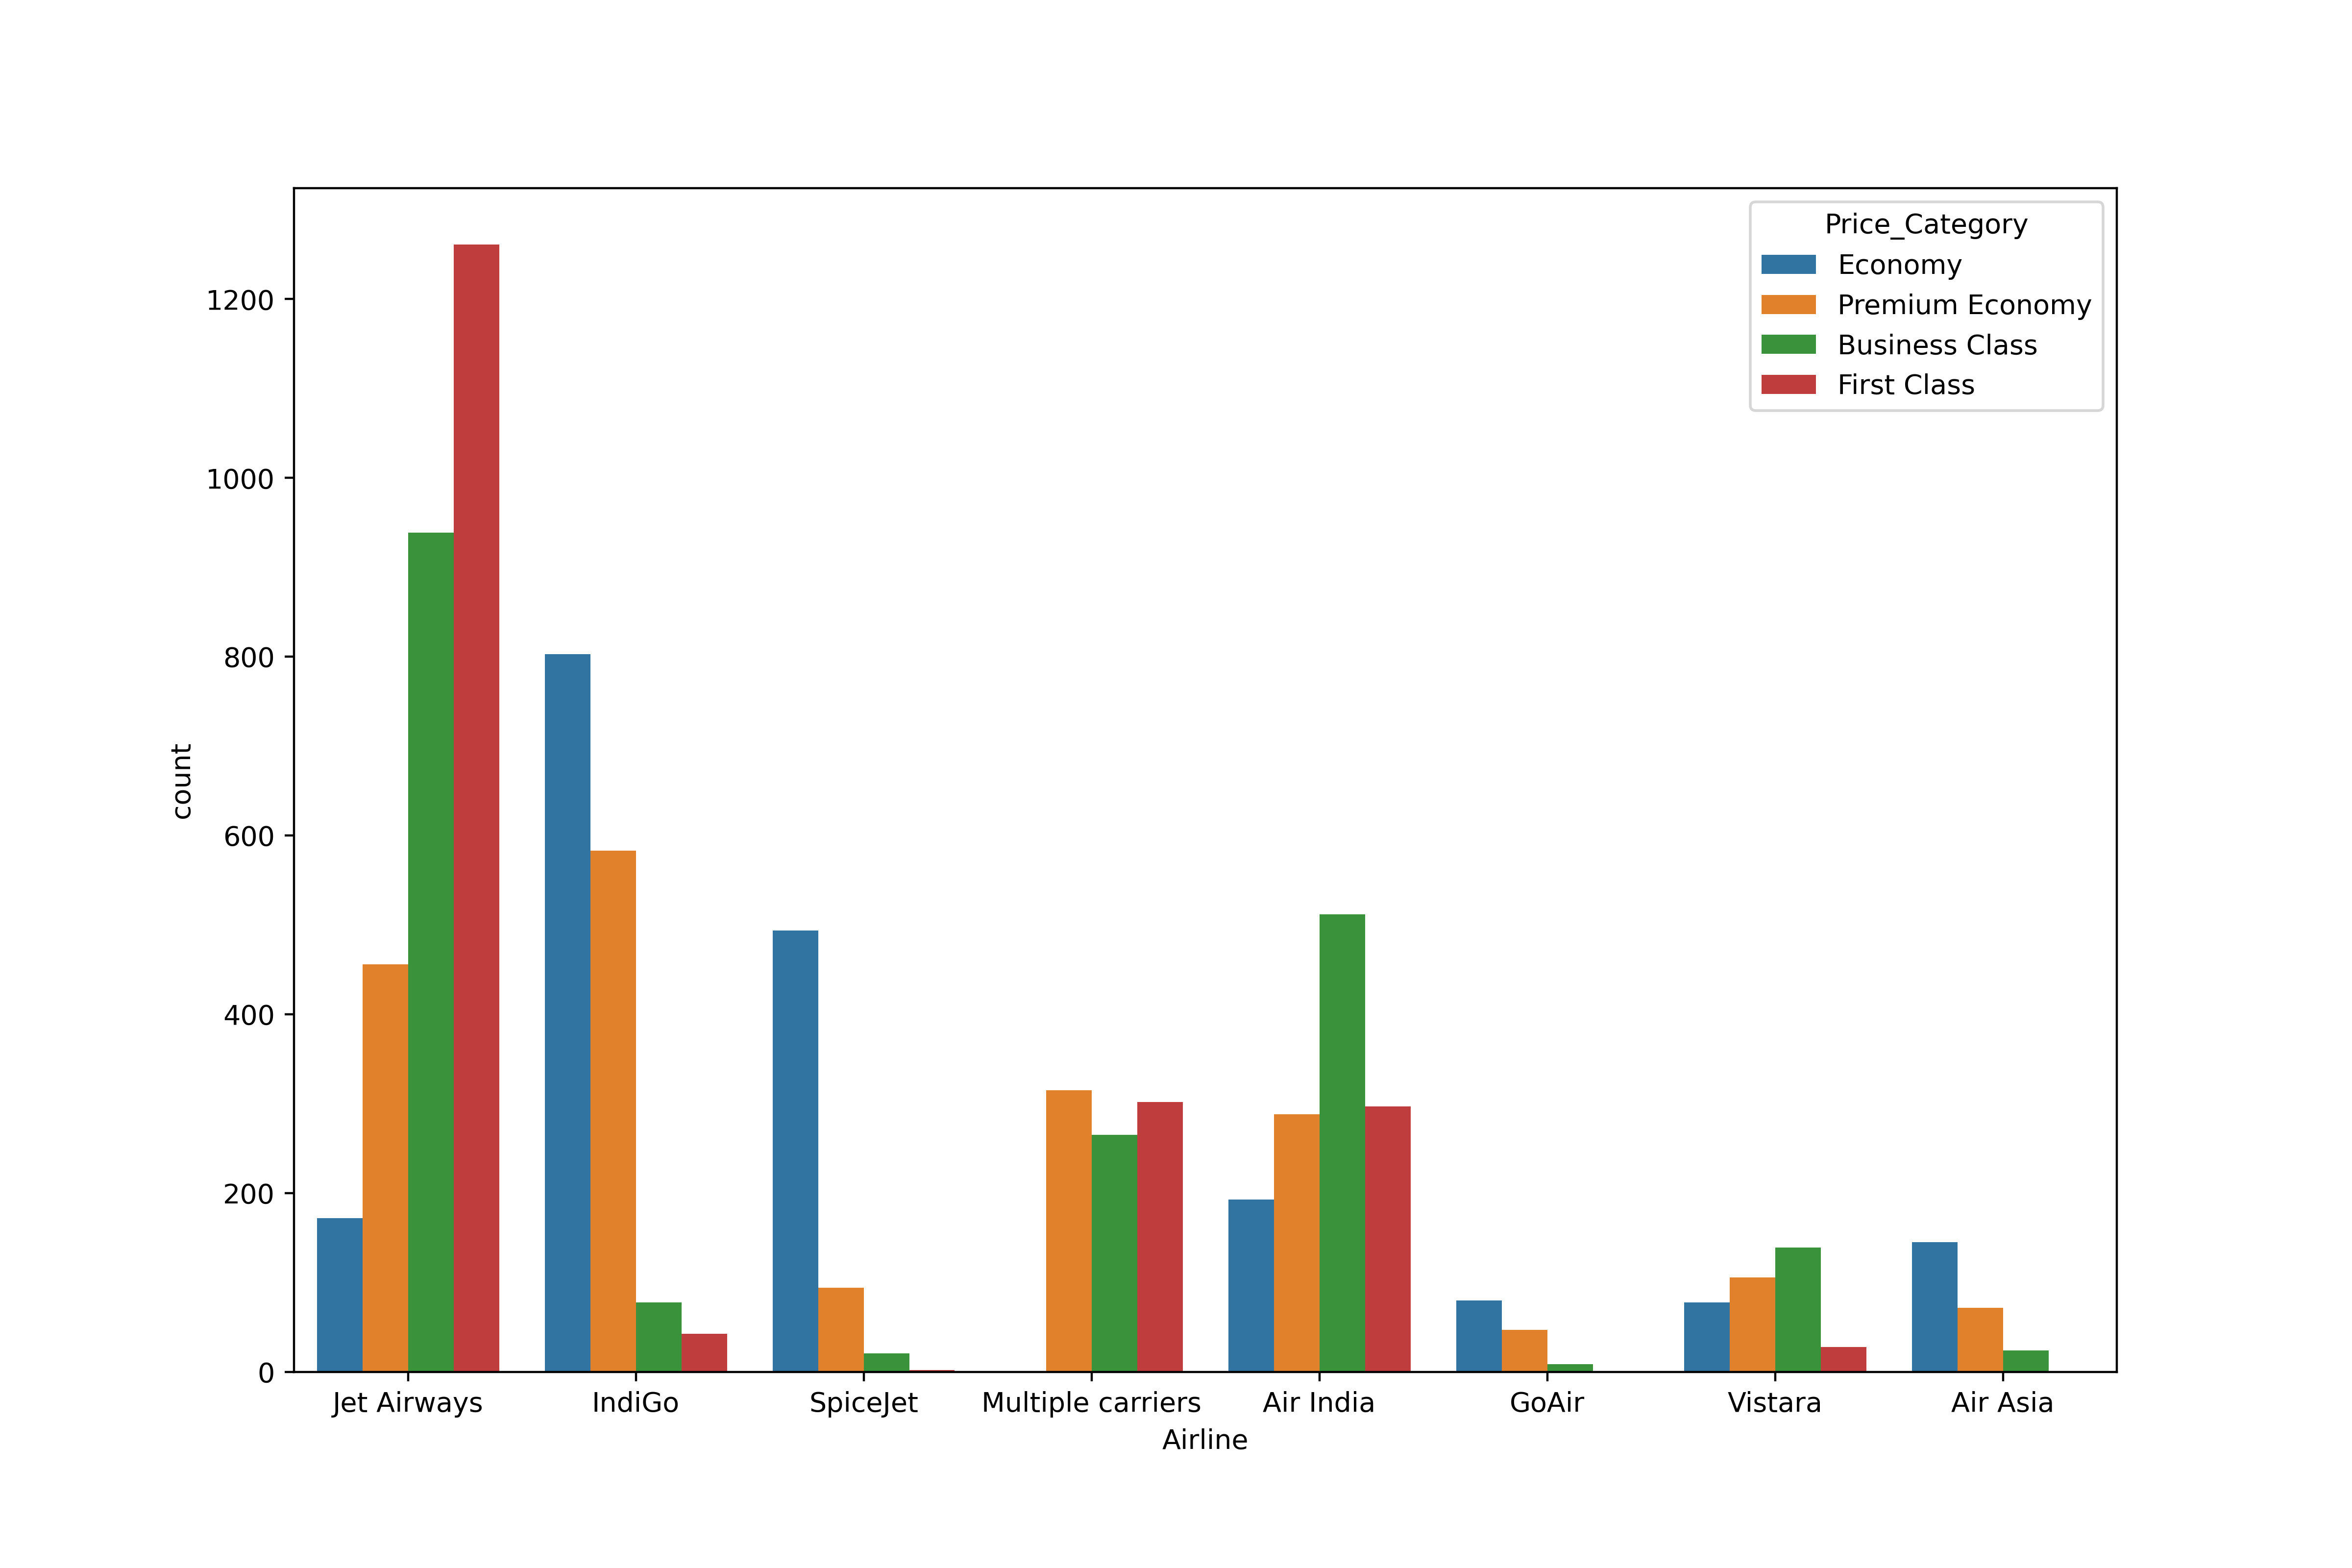
sns.countplot(data=planes, x="Airline", hue="Price_Category")
plt.show()
การวิเคราะห์ข้อมูลเชิงสำรวจด้วย Python

หมวดหมู่ราคาตามสายการบิน

Countplot แสดงจำนวนเที่ยวบินของแต่ละสายการบินในแต่ละหมวดหมู่ราคา โดย Jet Airways มีตั๋ว First Class มากที่สุด

การวิเคราะห์ข้อมูลเชิงสำรวจด้วย Python

มาฝึกกันเถอะ!

การวิเคราะห์ข้อมูลเชิงสำรวจด้วย Python

Preparing Video For Download...