การสร้างสมมติฐาน
การวิเคราะห์ข้อมูลเชิงสำรวจด้วย Python

George Boorman
Curriculum Manager, DataCamp
เรารู้อะไรบ้าง?
เรารู้อะไรบ้าง?
sns.heatmap(planes.corr(numeric_only=True), annot=True)
plt.show()

สหสัมพันธ์ลวง
sns.scatterplot(data=planes, x="Duration", y="Price", hue="Total_Stops")
plt.show()

เราจะรู้ได้อย่างไร?

อะไรคือความจริง?

1 Image credit: https://unsplash.com/@markuswinkler
Data snooping


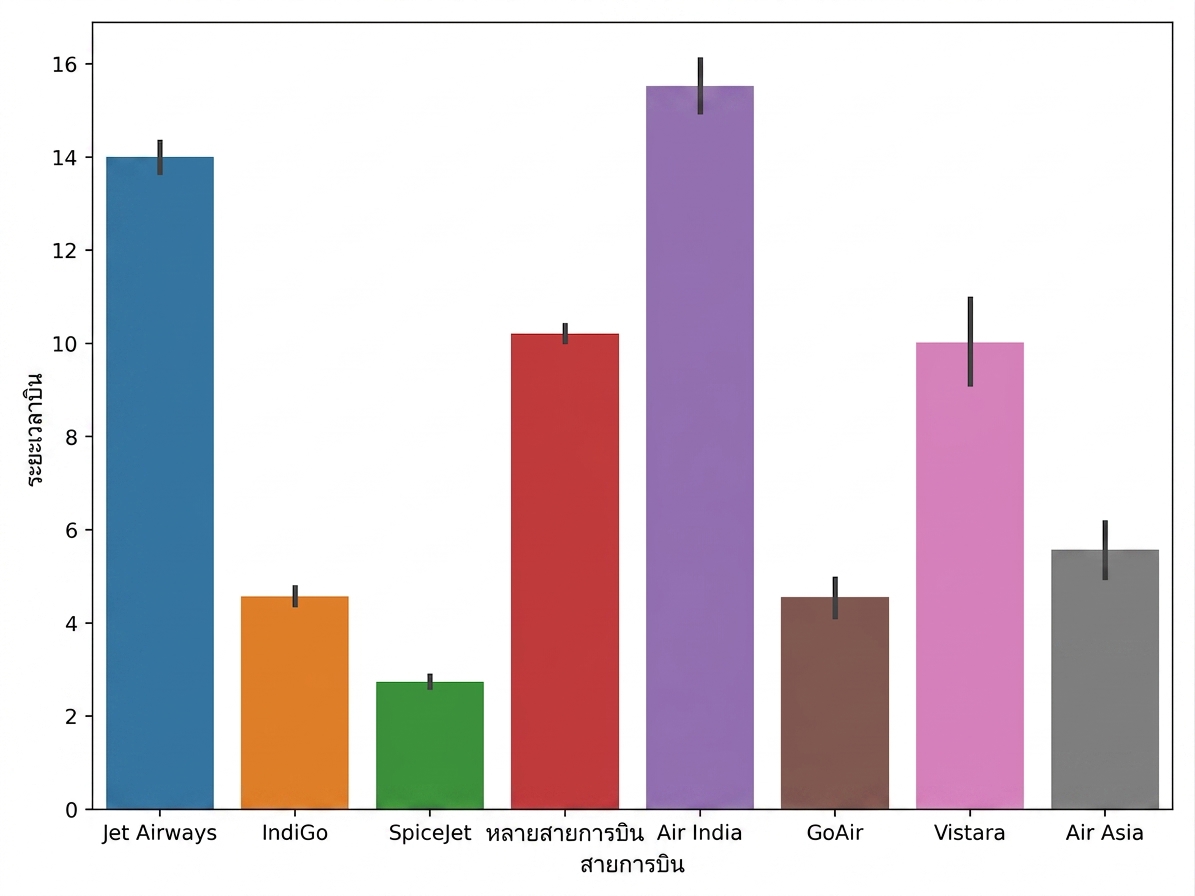
การสร้างสมมติฐาน
การสร้างสมมติฐาน