ข้อควรพิจารณาสำหรับข้อมูลเชิงหมวดหมู่

การวิเคราะห์ข้อมูลเชิงสำรวจด้วย Python

George Boorman

Curriculum Manager, DataCamp

ทำไมต้องทำ EDA?

  • ตรวจจับรูปแบบและความสัมพันธ์


  • ตั้งคำถามหรือสมมติฐาน


  • เตรียมข้อมูลสำหรับ machine learning

เครื่องหมายคำถามในแสงนีออนสีแดง

1 Image credit: https://unsplash.com/@simonesecci
การวิเคราะห์ข้อมูลเชิงสำรวจด้วย Python

ข้อมูลที่เป็นตัวแทน

  • ตัวอย่างต้องแทนประชากรได้

ตัวอย่างเช่น:

  • การศึกษาเทียบกับรายได้ในสหรัฐฯ
    • ใช้ข้อมูลจากฝรั่งเศสไม่ได้

ธงสหรัฐอเมริกา

ธงฝรั่งเศส

1 Image credits: https://unsplash.com/@cristina_glebova; https://unsplash.com/@nimbus_vulpis
การวิเคราะห์ข้อมูลเชิงสำรวจด้วย Python

คลาสเชิงหมวดหมู่

  • คลาส = ป้ายกำกับ


  • สำรวจทัศนคติเรื่องการแต่งงาน
    • สถานภาพสมรส
      • โสด
      • แต่งงานแล้ว
      • หย่าร้าง
การวิเคราะห์ข้อมูลเชิงสำรวจด้วย Python

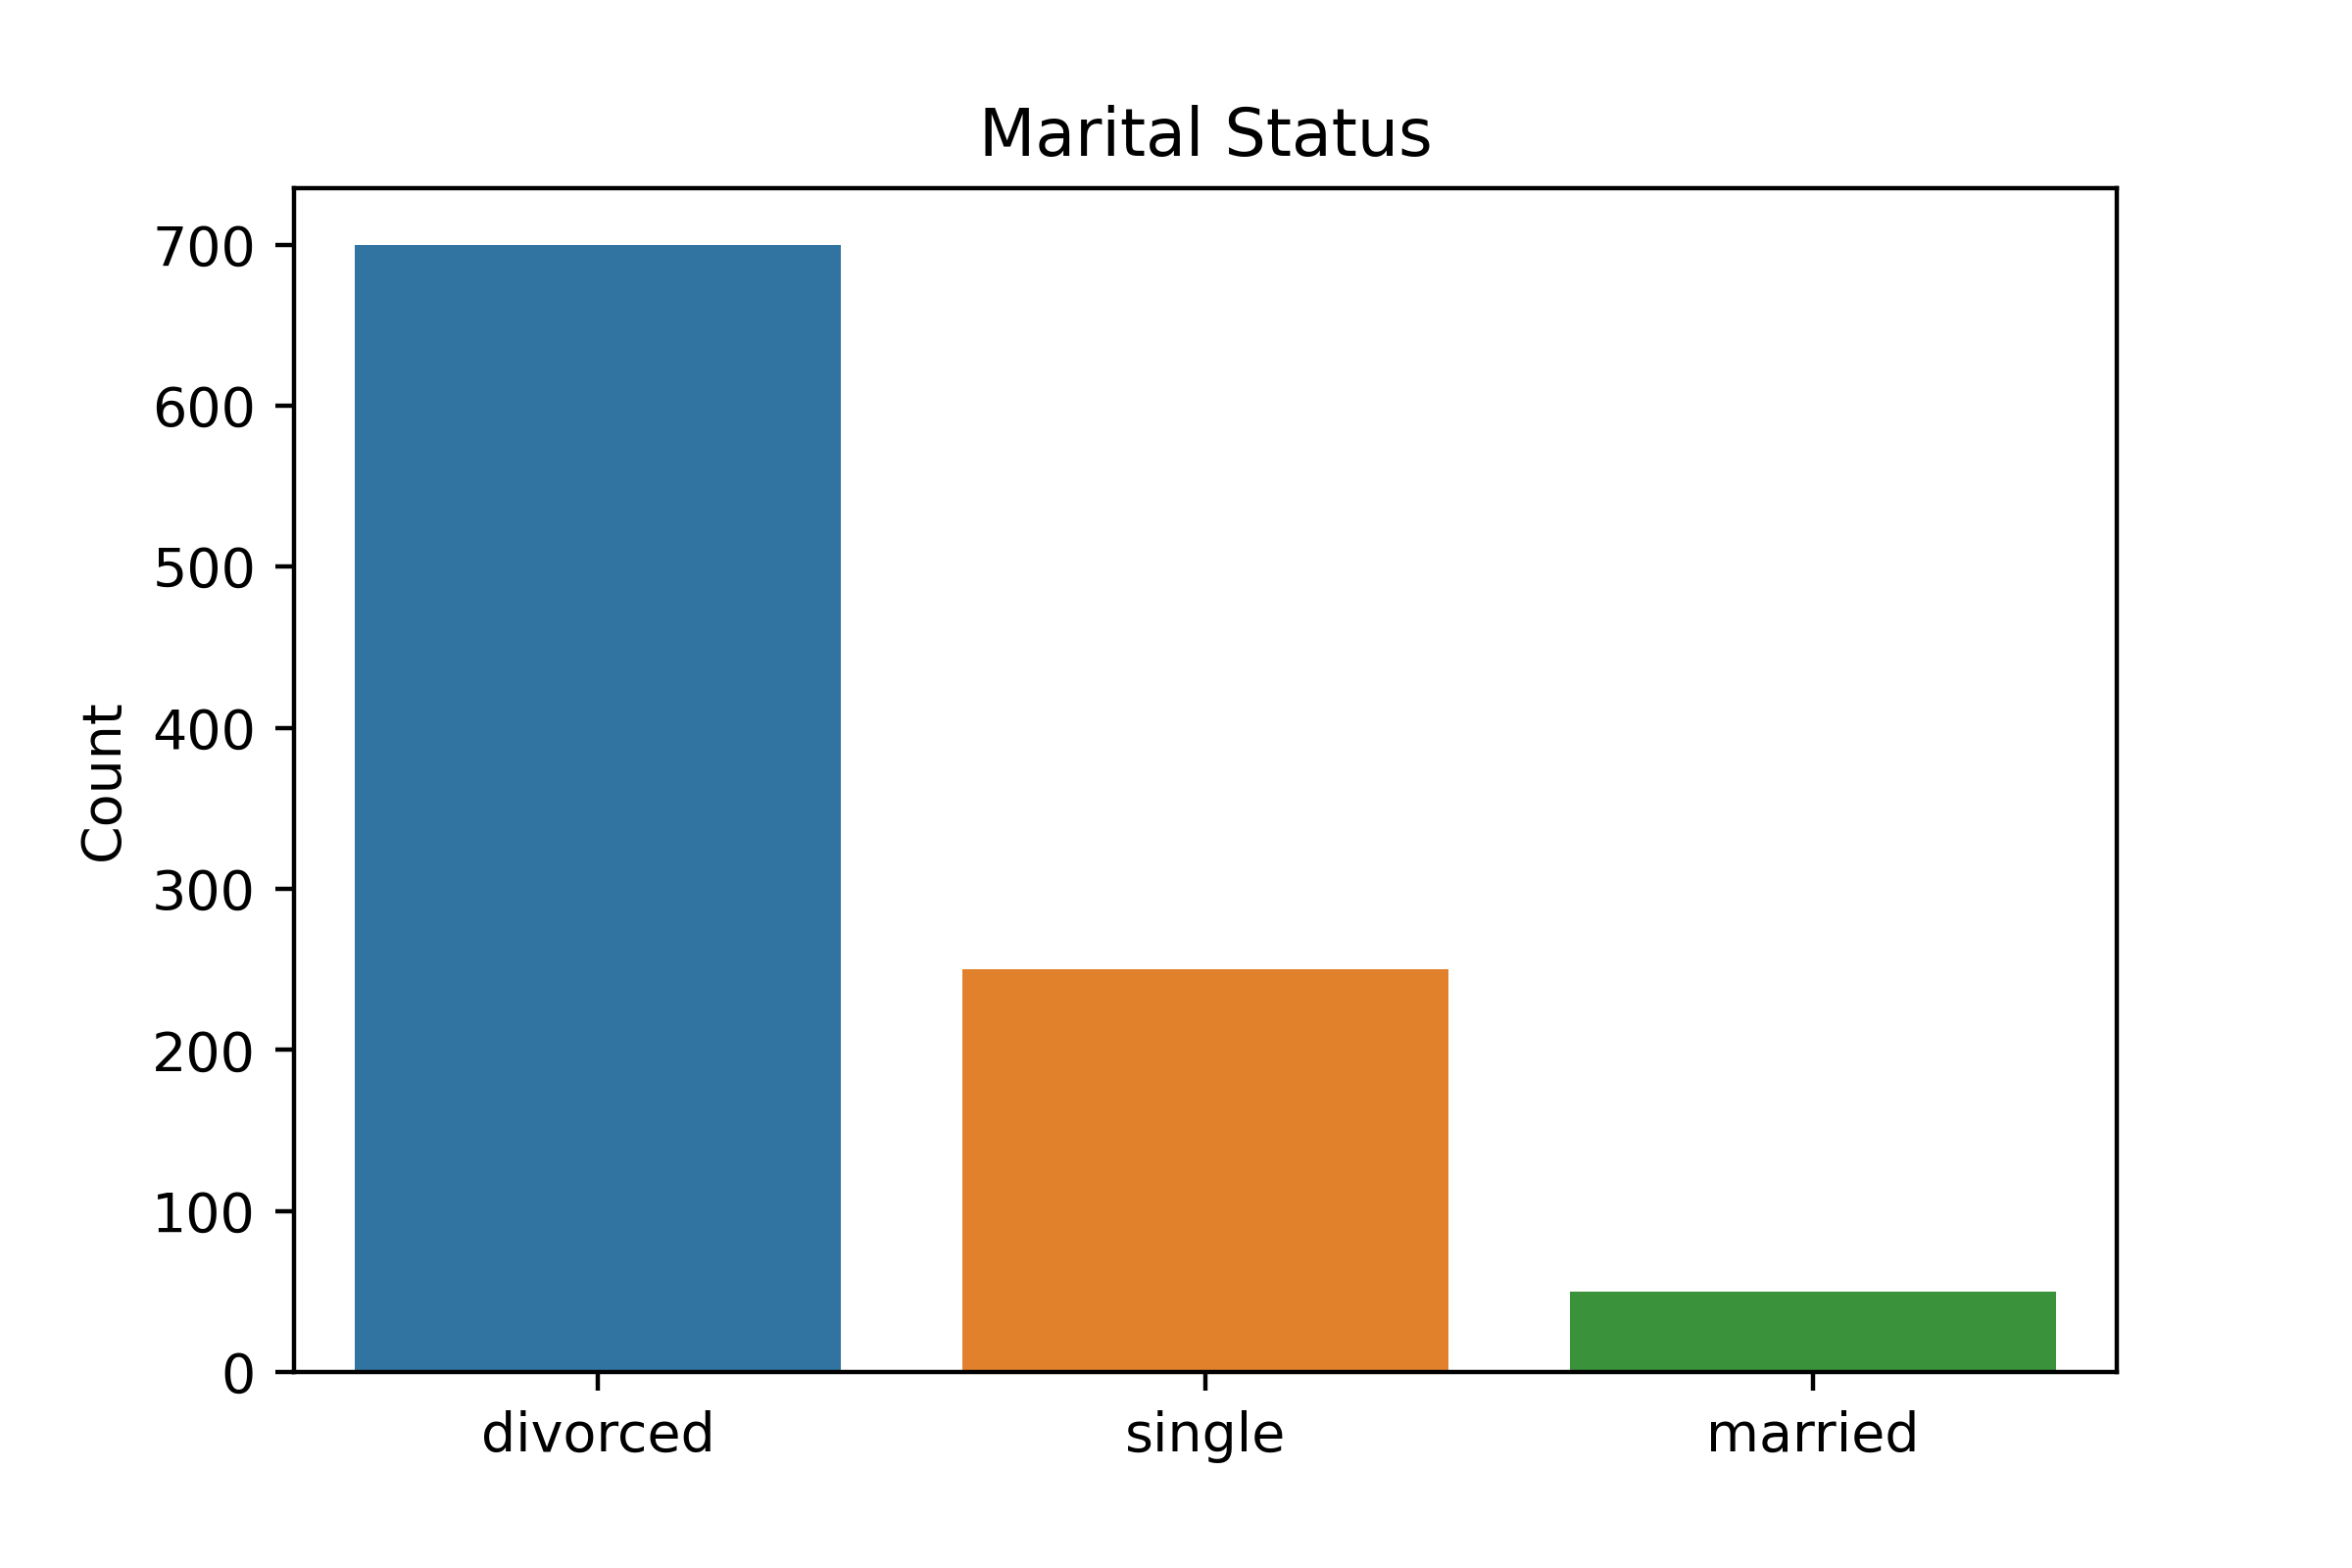
ความไม่สมดุลของคลาส

กราฟแท่งแสดงจำนวนสถานภาพสมรสในตัวอย่าง - หย่าร้าง 700 คน โสด 250 คน และแต่งงานแล้ว 50 คน

การวิเคราะห์ข้อมูลเชิงสำรวจด้วย Python

ความถี่ของคลาส

print(planes["Destination"].value_counts())
Cochin       4391
Banglore     2773
Delhi        1219
New Delhi     888
Hyderabad     673
Kolkata       369
Name: Destination, dtype: int64
การวิเคราะห์ข้อมูลเชิงสำรวจด้วย Python

ความถี่สัมพัทธ์ของคลาส

  • 40% ของเที่ยวบินในประเทศอินเดียมีปลายทางคือเดลี
planes["Destination"].value_counts(normalize=True)
Cochin       0.425773
Banglore     0.268884
Delhi        0.118200
New Delhi    0.086105
Hyderabad    0.065257
Kolkata      0.035780
Name: Destination, dtype: float64
  • ตัวอย่างของเราเป็นตัวแทนของประชากร (เที่ยวบินในประเทศอินเดีย) หรือไม่?
การวิเคราะห์ข้อมูลเชิงสำรวจด้วย Python

Cross-tabulation

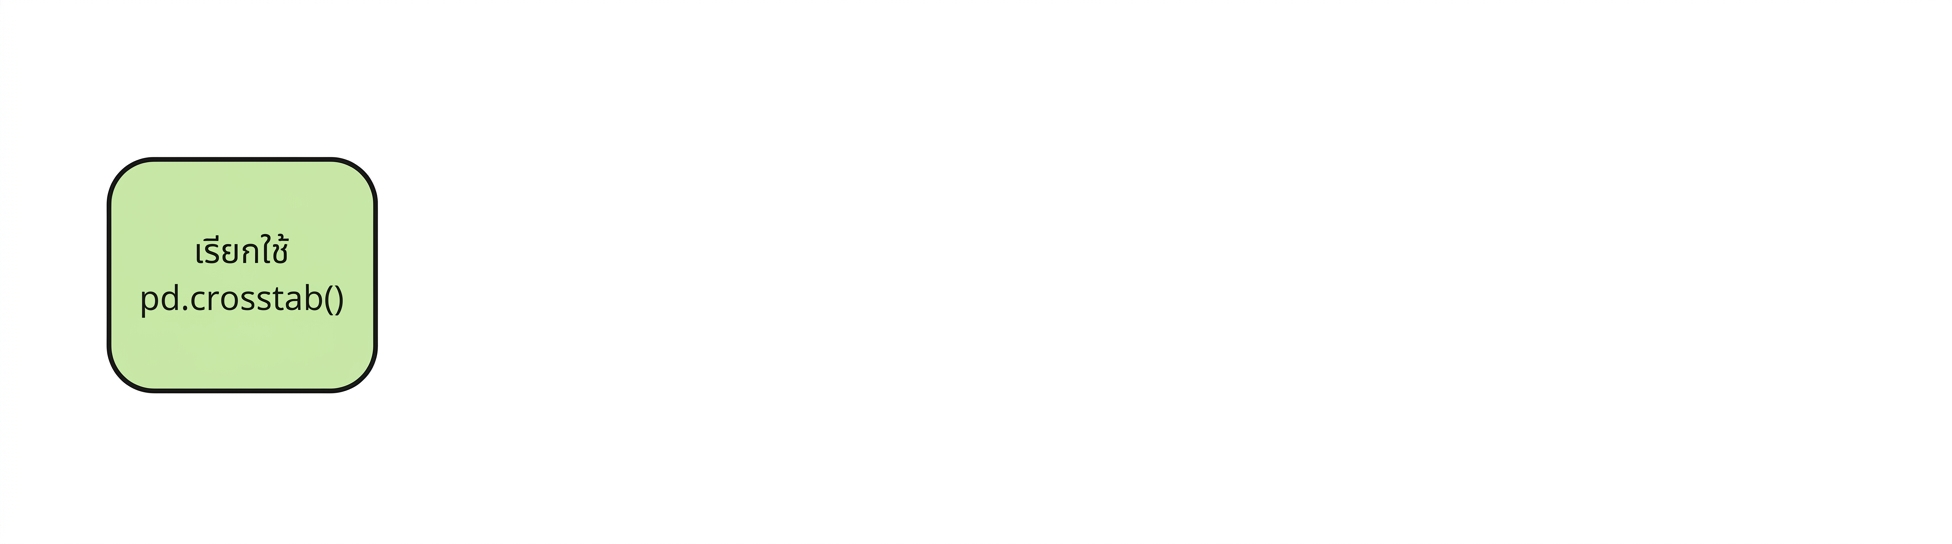
เรียกใช้ pd.crosstab

pd.crosstab(
การวิเคราะห์ข้อมูลเชิงสำรวจด้วย Python

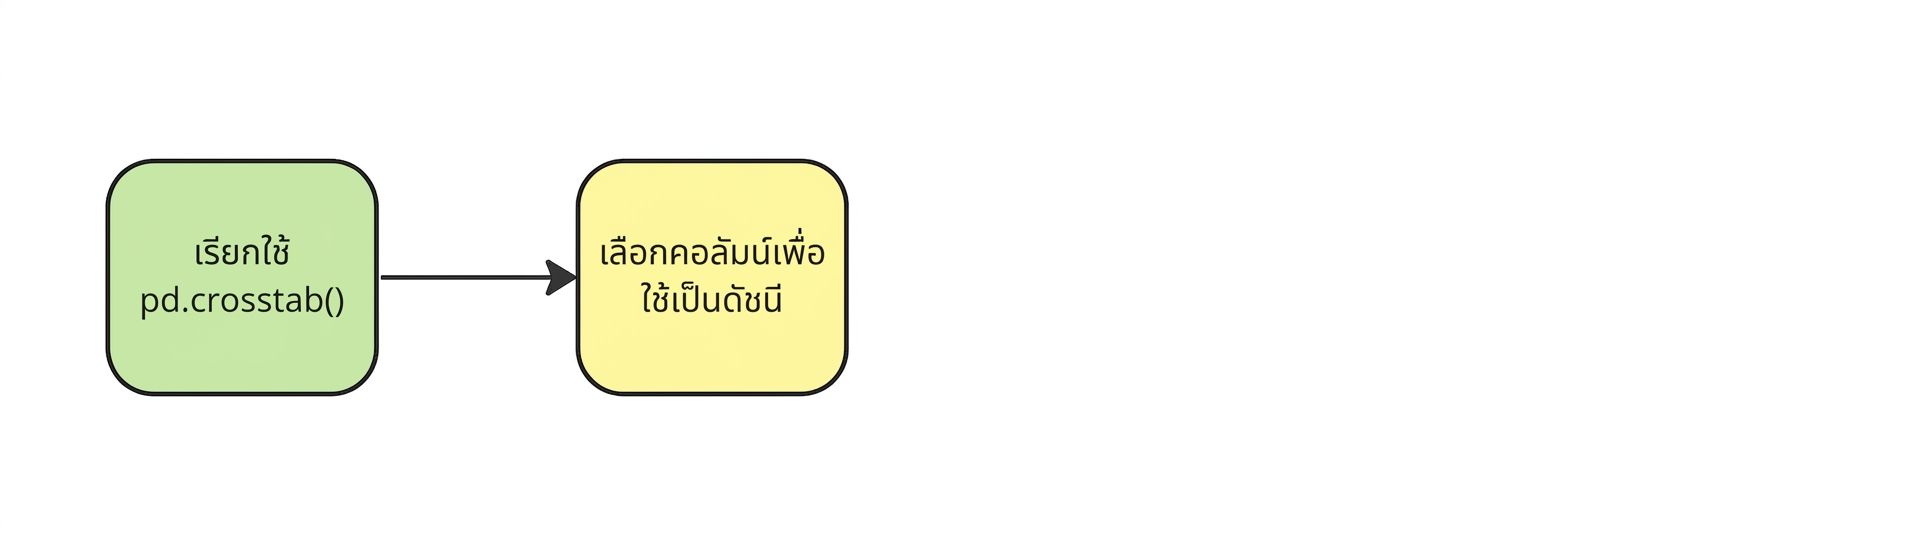
เลือก index

เลือกคอลัมน์ที่จะใช้เป็น index

pd.crosstab(planes["Source"],
การวิเคราะห์ข้อมูลเชิงสำรวจด้วย Python

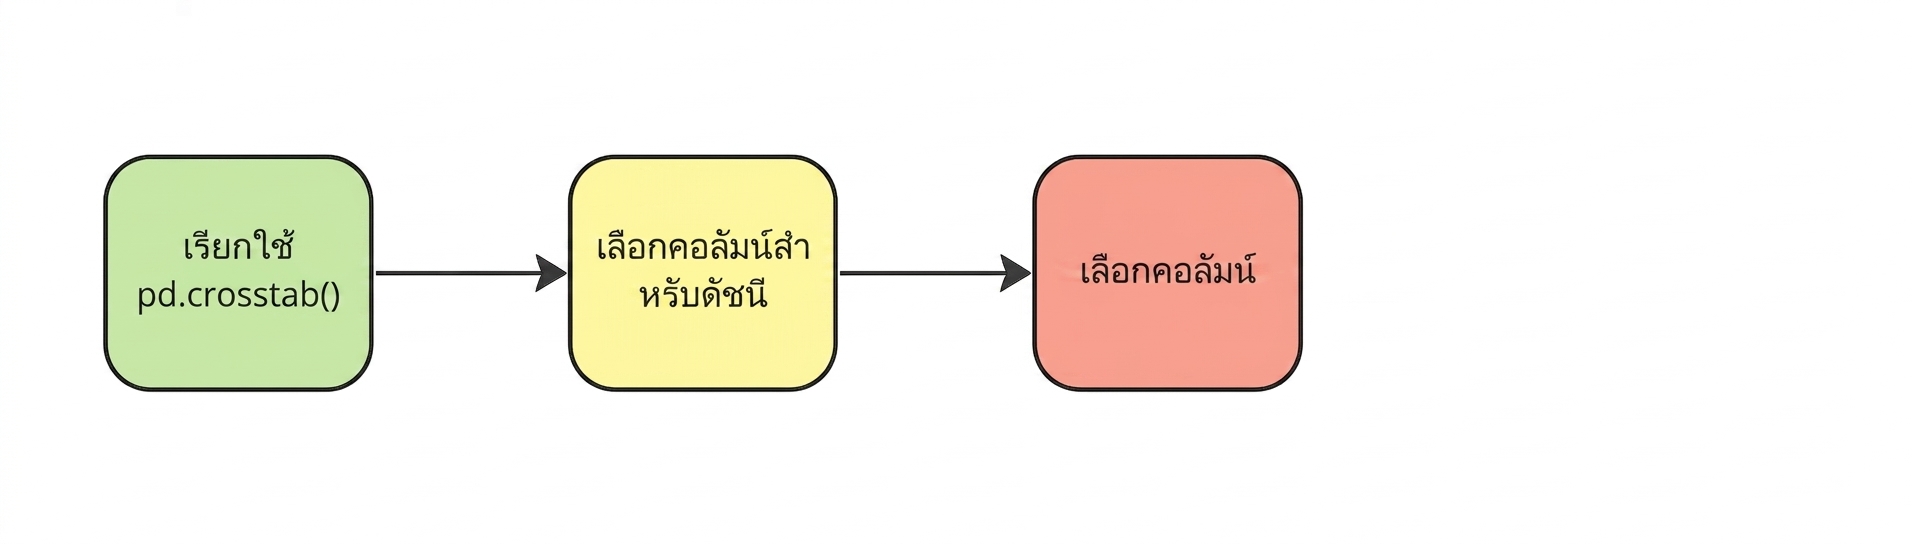
เลือกคอลัมน์

เลือกคอลัมน์

pd.crosstab(planes["Source"], planes["Destination"])
การวิเคราะห์ข้อมูลเชิงสำรวจด้วย Python

Cross-tabulation

Destination  Banglore  Cochin  Delhi  Hyderabad  Kolkata  New Delhi
Source                                                             
Banglore            0       0   1199          0        0        868
Chennai             0       0      0          0      364          0
Delhi               0    4318      0          0        0          0
Kolkata          2720       0      0          0        0          0
Mumbai              0       0      0        662        0          0
การวิเคราะห์ข้อมูลเชิงสำรวจด้วย Python

ขยาย cross-tabulation

Source Destination Median Price (IDR)
Banglore Delhi 4232.21
Banglore New Delhi 12114.56
Chennai Kolkata 3859.76
Delhi Cochin 9987.63
Kolkata Banglore 9654.21
Mumbai Hyderabad 3431.97
การวิเคราะห์ข้อมูลเชิงสำรวจด้วย Python

ค่าแบบรวมกลุ่มด้วย pd.crosstab()

pd.crosstab(planes["Source"], planes["Destination"],

values=planes["Price"], aggfunc="median")
Destination  Banglore   Cochin   Delhi  Hyderabad  Kolkata  New Delhi
Source                                                               
Banglore          NaN      NaN  4823.0        NaN      NaN    10976.5
Chennai           NaN      NaN     NaN        NaN   3850.0        NaN
Delhi             NaN  10262.0     NaN        NaN      NaN        NaN
Kolkata        9345.0      NaN     NaN        NaN      NaN        NaN
Mumbai            NaN      NaN     NaN     3342.0      NaN        NaN
การวิเคราะห์ข้อมูลเชิงสำรวจด้วย Python

เปรียบเทียบตัวอย่างกับประชากร

Source Destination Median Price (IDR) Median Price (dataset)
Banglore Delhi 4232.21 4823.0
Banglore New Delhi 12114.56 10976.50
Chennai Kolkata 3859.76 3850.0
Delhi Cochin 9987.63 10260.0
Kolkata Banglore 9654.21 9345.0
Mumbai Hyderabad 3431.97 3342.0
การวิเคราะห์ข้อมูลเชิงสำรวจด้วย Python

มาฝึกกันเถอะ!

การวิเคราะห์ข้อมูลเชิงสำรวจด้วย Python

Preparing Video For Download...