Зв'язки факторів і розподіли

Exploratory Data Analysis у Python

Izzy Weber

Curriculum Manager, DataCamp

Рівень освіти: чоловік

divorce["education_man"].value_counts()
Professional    1313
Preparatory      501
Secondary        288
Primary          100
None               4
Other              3
Name: education_man, dtype: int64
Exploratory Data Analysis у Python

Дослідження категоріальних зв'язків

sns.histplot(data=divorce, x="marriage_duration", binwidth=1)
plt.show()
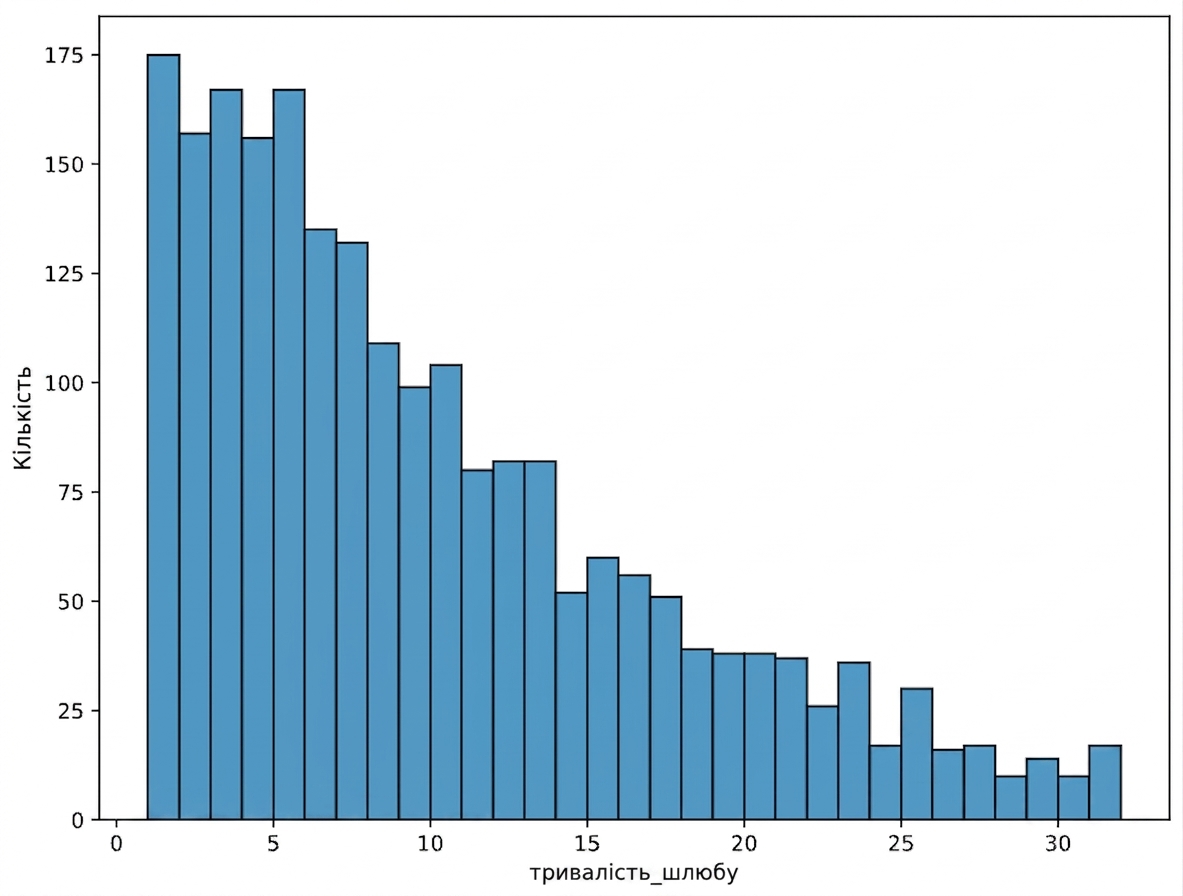
Гістограма тривалості шлюбу

Exploratory Data Analysis у Python

Дослідження категоріальних зв'язків

sns.histplot(data=divorce, x="marriage_duration", hue="education_man", binwidth=1)
plt.show()

Гістограма тривалості шлюбу з кольорами за education_man

Exploratory Data Analysis у Python

Графіки KDE (оцінка щільності ядра)

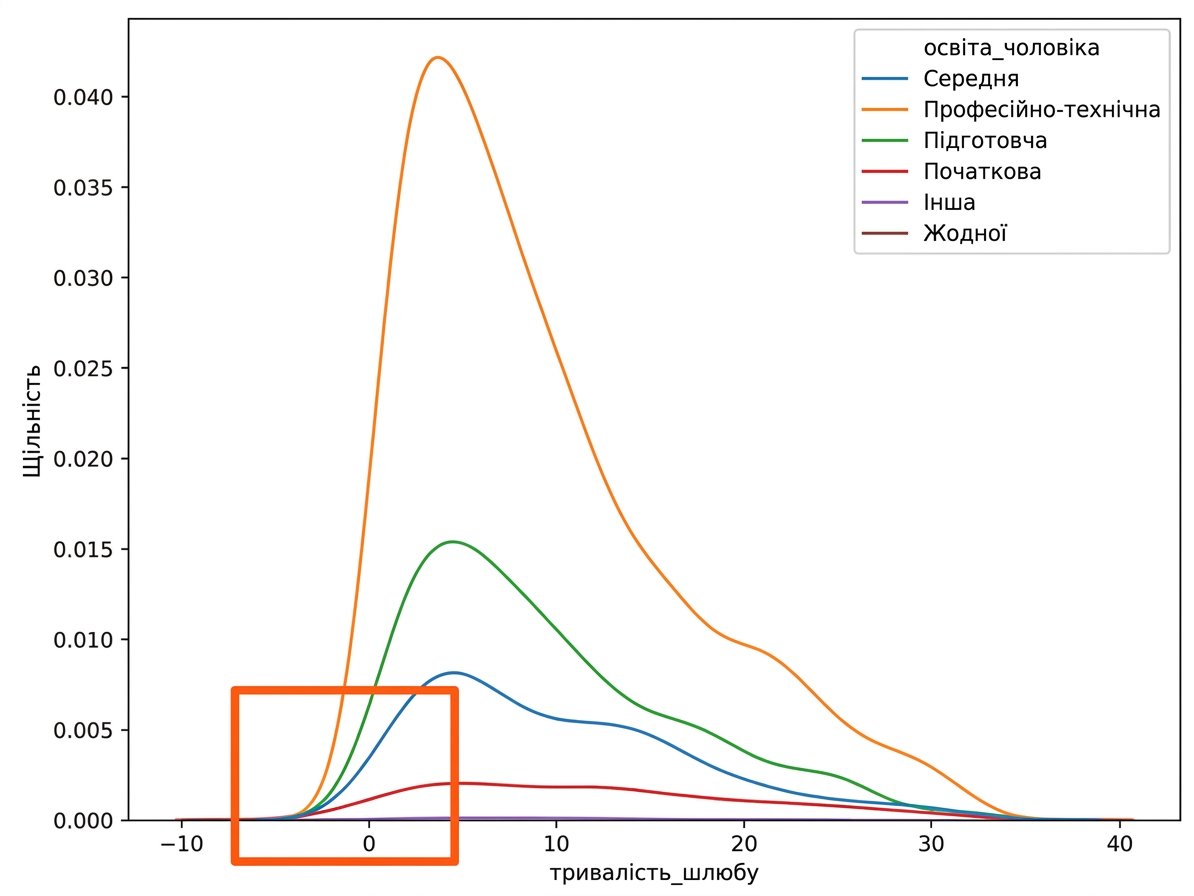
sns.kdeplot(data=divorce, x="marriage_duration", hue="education_man")
plt.show()

KDE тривалості шлюбу з кольорами за education_man

Exploratory Data Analysis у Python

Графіки KDE (оцінка щільності ядра)

KDE тривалості шлюбу з кольорами за education_man, масштабовано до marriage_duration, що дорівнює нулю

Exploratory Data Analysis у Python

Графіки KDE (оцінка щільності ядра)

sns.kdeplot(data=divorce, x="marriage_duration", hue="education_man", cut=0)
plt.show()

KDE тривалості шлюбу з кольорами за education_man і cut дорівнює нулю

Exploratory Data Analysis у Python

Кумулятивні графіки KDE

sns.kdeplot(data=divorce, x="marriage_duration", hue="education_man", cut=0, cumulative=True)
plt.show()

Кумулятивна функція розподілу тривалості шлюбу з кольорами за education_man і cut дорівнює нулю

Exploratory Data Analysis у Python

Зв'язок між віком шлюбу та освітою

  • Чи є зв'язок між віком укладання шлюбу та рівнем освіти?
divorce["man_age_marriage"] = divorce["marriage_year"] - divorce["dob_man"].dt.year
divorce["woman_age_marriage"] = divorce["marriage_year"] - divorce["dob_woman"].dt.year
Exploratory Data Analysis у Python

Скатерплоти з категоріальними змінними

sns.scatterplot(data=divorce, x="woman_age_marriage", y="man_age_marriage")
plt.show()
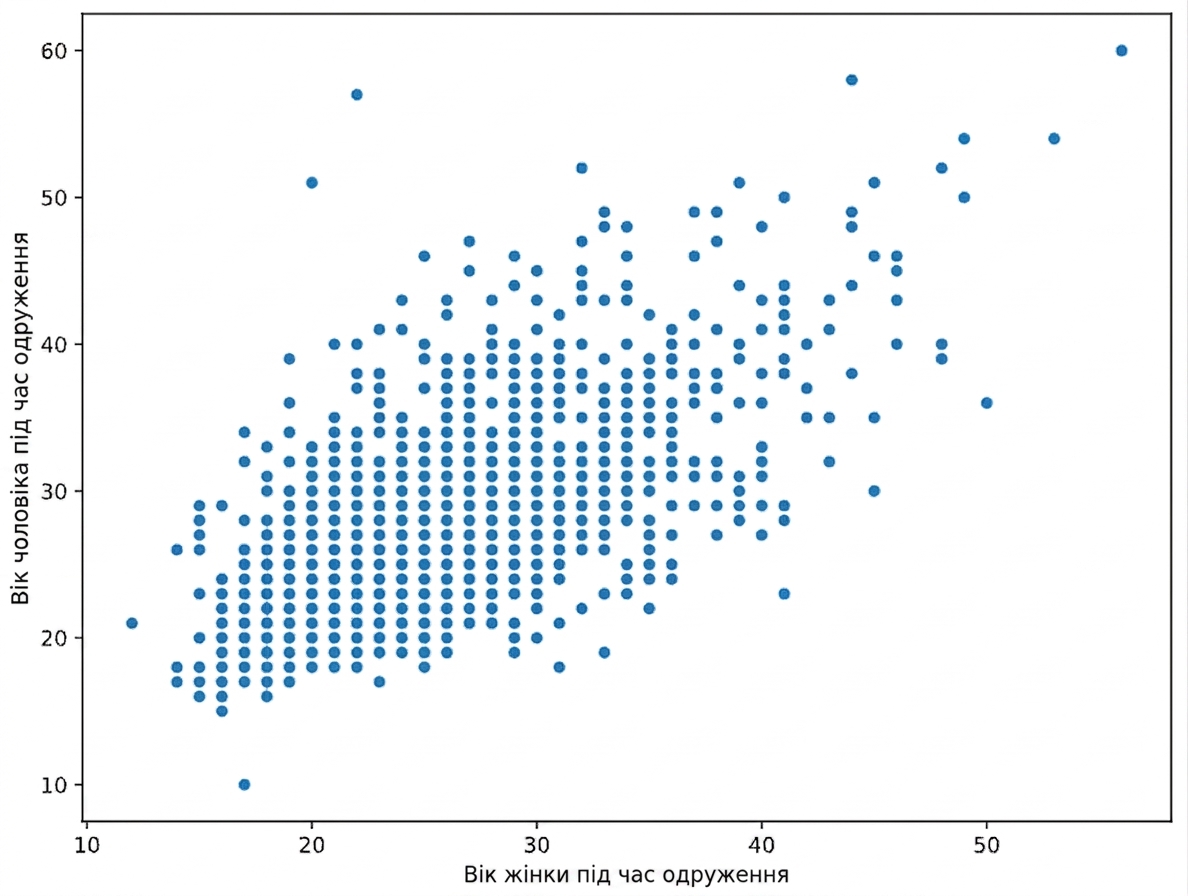
Точкова діаграма woman_age_marriage і man_age_marriage

Exploratory Data Analysis у Python

Скатерплоти з категоріальними змінними

sns.scatterplot(data=divorce, 
                x="woman_age_marriage",
                y="man_age_marriage", 
                hue="education_man")
plt.show()

Точкова діаграма woman_age_marriage і man_age_marriage з кольорами за education_man

Exploratory Data Analysis у Python

Давайте потренуємось!

Exploratory Data Analysis у Python

Preparing Video For Download...