Box plots
Introduction to the Tidyverse

David Robinson
Chief Data Scientist, DataCamp
Histogram
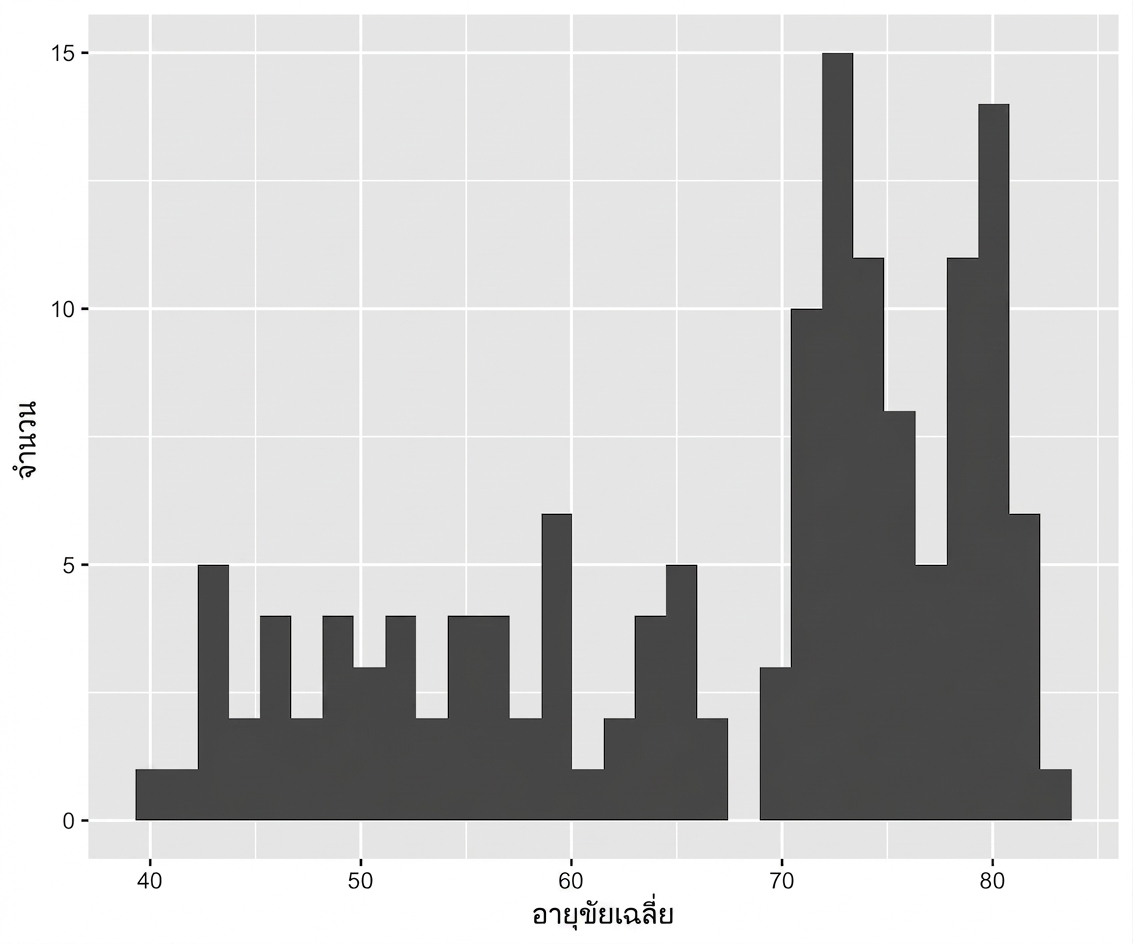
ggplot(gapminder_2007, aes(x = lifeExp)) +
  geom_histogram()
Box plots
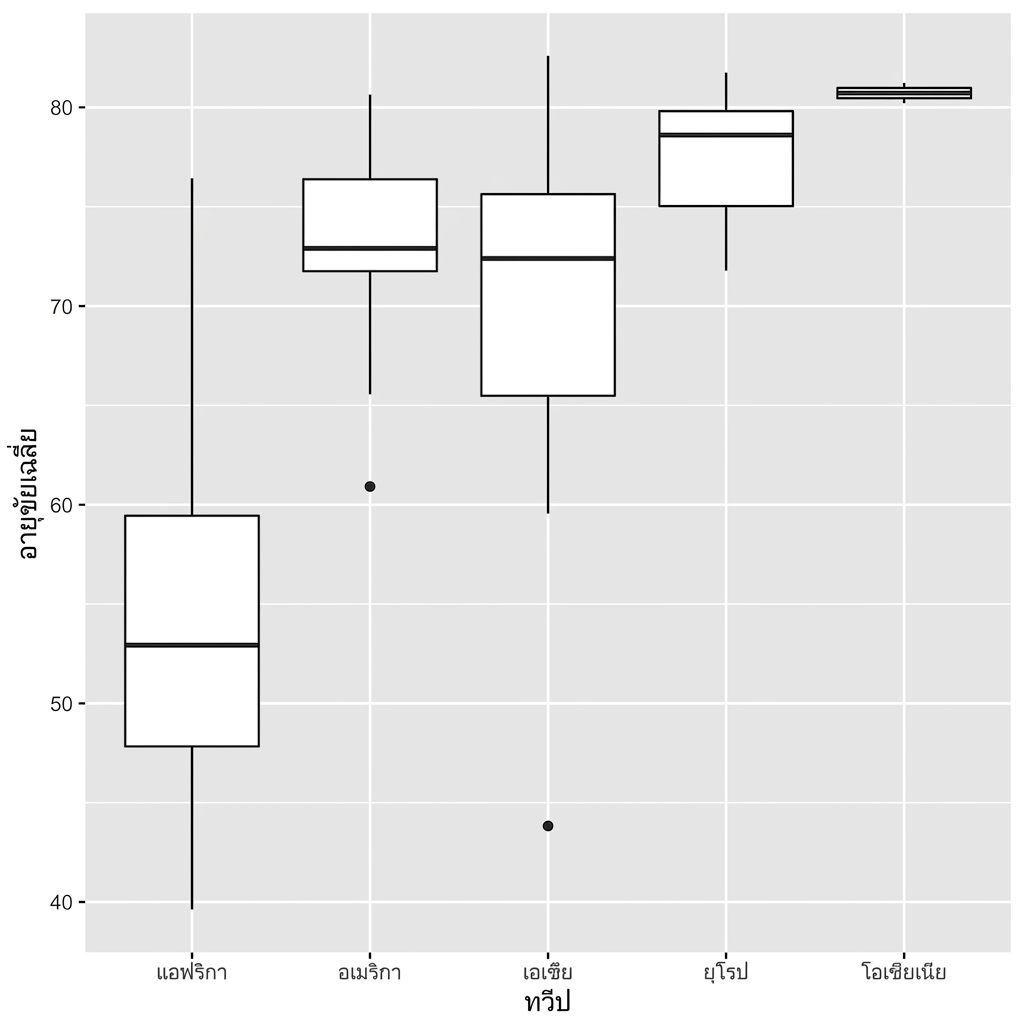
ggplot(gapminder_2007, aes(x = continent, y = lifeExp)) +
  geom_boxplot()
Histogram vs Box plot

