एक प्लॉट हज़ार बातें कहता है
डेटा विज़ुअलाइज़ेशन समझना

Richie Cotton
Data Evangelist at DataCamp
आप क्या सीखेंगे
- उपयुक्त प्लॉट कैसे चुनें?
- आम प्लॉट्स की व्याख्या कैसे करें?
- प्लॉट बनाने की सर्वोत्तम प्रथाएँ क्या हैं?
इनसाइट्स पाने के तीन तरीके
सार-सांख्यिकी निकालना
mean, median, standard deviation
मॉडल चलाना
linear और logistic regression
प्लॉट बनाना
scatter, bar, histogram
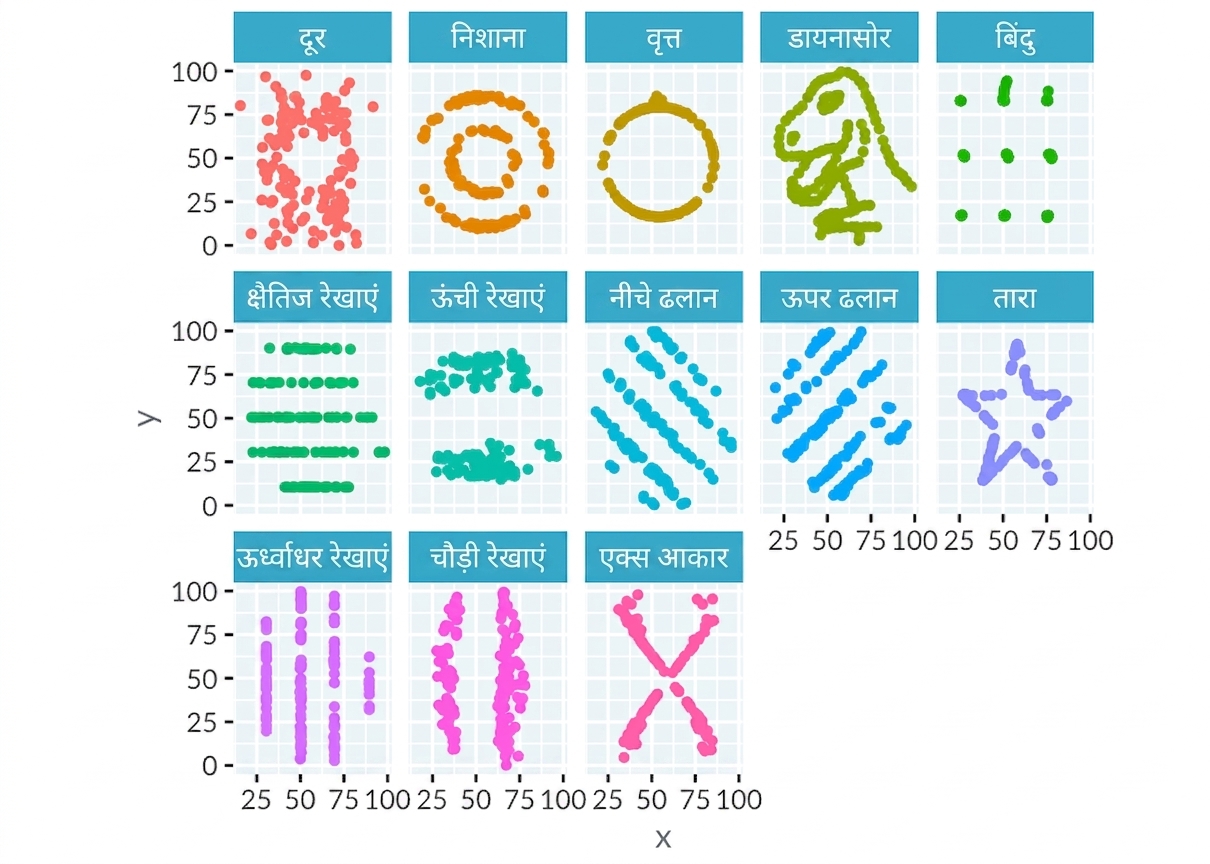
Datasaurus Dozen
| away_x | away_y | bullseye_x | bullseye_y | ... | x_shape_x | x_shape_y |
|---|---|---|---|---|---|---|
| 32.33 | 61.41 | 51.20 | 83.34 | ... | 38.34 | 92.47 |
| 53.42 | 26.19 | 58.97 | 85.50 | ... | 35.75 | 94.12 |
| 63.92 | 30.83 | 51.87 | 85.83 | ... | 32.77 | 88.52 |
| 70.29 | 82.53 | 48.18 | 85.05 | ... | 33.73 | 88.62 |
| 34.12 | 45.73 | 41.68 | 84.02 | ... | 37.24 | 83.72 |
| 67.67 | 37.11 | 37.89 | 82.57 | ... | 36.03 | 82.04 |
1 Matejka, J., & Fitzmaurice, G. (2017) https://www.autodeskresearch.com/publications/samestats
हर डेटासेट के लिए x का mean
| dataset | mean(x) |
|---|---|
| away | 54.27 |
| bullseye | 54.27 |
| circle | 54.27 |
| dino | 54.26 |
| dots | 54.26 |
| h_lines | 54.26 |
| high_lines | 54.27 |
| dataset | mean(x) |
|---|---|
| slant_down | 54.27 |
| slant_up | 54.27 |
| star | 54.27 |
| v_lines | 54.27 |
| wide_lines | 54.27 |
| x_shape | 54.26 |
हर डेटासेट के लिए x और y के mean
| dataset | mean(x) | mean(y) |
|---|---|---|
| away | 54.27 | 47.83 |
| bullseye | 54.27 | 47.83 |
| circle | 54.27 | 47.84 |
| dino | 54.26 | 47.83 |
| dots | 54.26 | 47.84 |
| h_lines | 54.26 | 47.83 |
| high_lines | 54.27 | 47.84 |
| dataset | mean(x) | mean(y) |
|---|---|---|
| slant_down | 54.27 | 47.84 |
| slant_up | 54.27 | 47.83 |
| star | 54.27 | 47.84 |
| v_lines | 54.27 | 47.84 |
| wide_lines | 54.27 | 47.83 |
| x_shape | 54.26 | 47.84 |
हर डेटासेट के standard deviations
| dataset | std_dev(x) | std_dev(y) |
|---|---|---|
| away | 16.77 | 26.94 |
| bullseye | 16.77 | 26.94 |
| circle | 16.76 | 26.93 |
| dino | 16.77 | 26.94 |
| dots | 16.77 | 26.93 |
| h_lines | 16.77 | 26.94 |
| high_lines | 16.77 | 26.94 |
| dataset | std_dev(x) | std_dev(y) |
|---|---|---|
| slant_down | 16.77 | 26.94 |
| slant_up | 16.77 | 26.94 |
| star | 16.77 | 26.93 |
| v_lines | 16.77 | 26.94 |
| wide_lines | 16.77 | 26.94 |
| x_shape | 16.77 | 26.93 |
Continuous और categorical वैरिएबल्स
Continuous: प्रायः numbers
- heights, temperatures, revenues
Continuous और categorical वैरिएबल्स
Continuous: प्रायः numbers
- heights, temperatures, revenues
Categorical: प्रायः text
- eye colors, countries, industry
Continuous और categorical वैरिएबल्स
Continuous: प्रायः numbers
- heights, temperatures, revenues
Categorical: प्रायः text
- eye colors, countries, industry
दोनों हो सकते हैं
- age continuous है, पर age group categorical है
- time continuous है, पर month of year categorical है
अभ्यास करते हैं!
डेटा विज़ुअलाइज़ेशन समझना

