केंद्र के माप

Python में Statistics परिचय

Maggie Matsui

Content Developer, DataCamp

स्तनधारी नींद डेटा

print(msleep)
                 name       genus   vore         order  ... sleep_cycle  awake  brainwt   bodywt
1             Cheetah    Acinonyx  carni     Carnivora  ...         NaN   11.9      NaN   50.000
2          Owl monkey       Aotus   omni      Primates  ...         NaN    7.0  0.01550    0.480
3     Mountain beaver  Aplodontia  herbi      Rodentia  ...         NaN    9.6      NaN    1.350
4 Greater short-ta...     Blarina   omni  Soricomorpha  ...    0.133333    9.1  0.00029    0.019
5                 Cow         Bos  herbi  Artiodactyla  ...    0.666667   20.0  0.42300  600.000
..                ...         ...    ...           ...  ...         ...    ...      ...      ...
79         Tree shrew      Tupaia   omni    Scandentia  ...    0.233333   15.1  0.00250    0.104
80 Bottle-nosed do...    Tursiops  carni       Cetacea  ...         NaN   18.8      NaN  173.330
81              Genet     Genetta  carni     Carnivora  ...         NaN   17.7  0.01750    2.000
82         Arctic fox      Vulpes  carni     Carnivora  ...         NaN   11.5  0.04450    3.380
83            Red fox      Vulpes  carni     Carnivora  ...    0.350000   14.2  0.05040    4.230
Python में Statistics परिचय

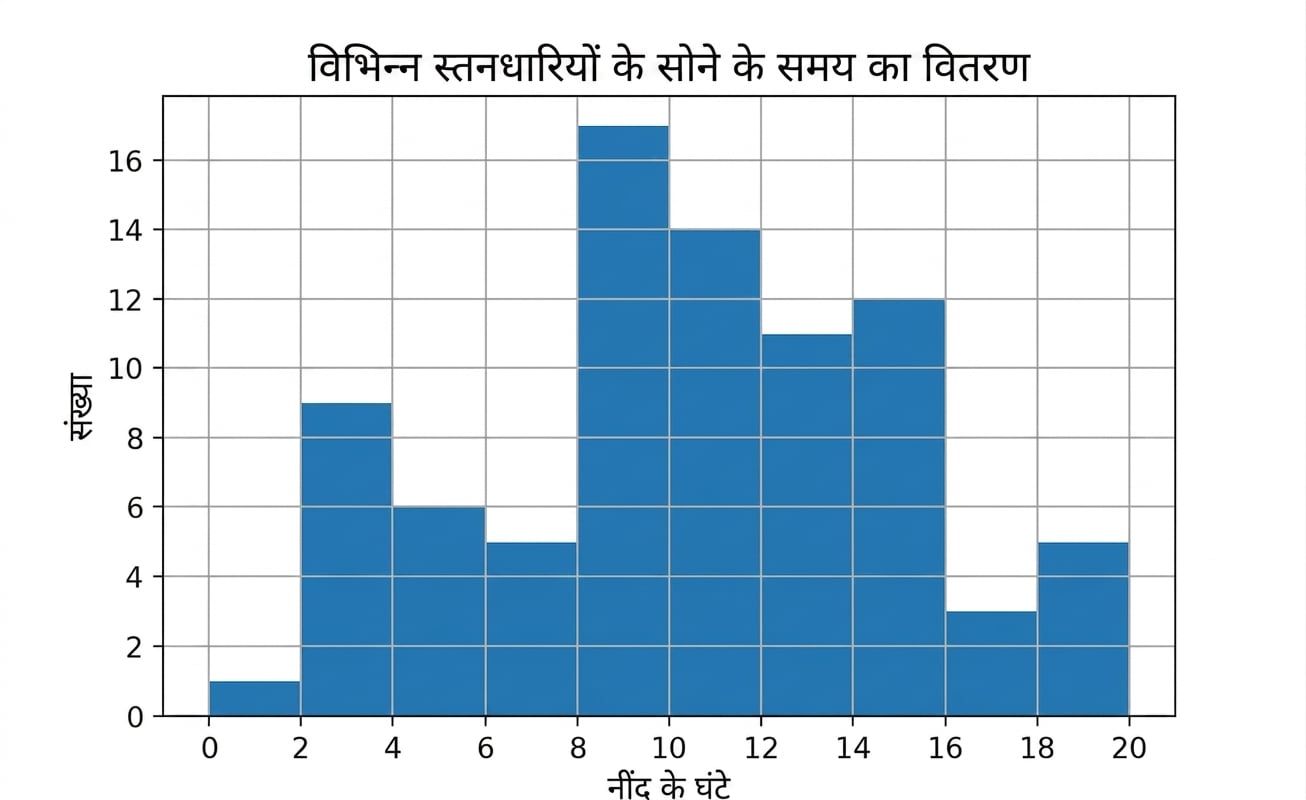
हिस्टोग्राम

msleep_hist.png

Python में Statistics परिचय

इस डेटासेट में स्तनधारी आम तौर पर कितना सोते हैं?

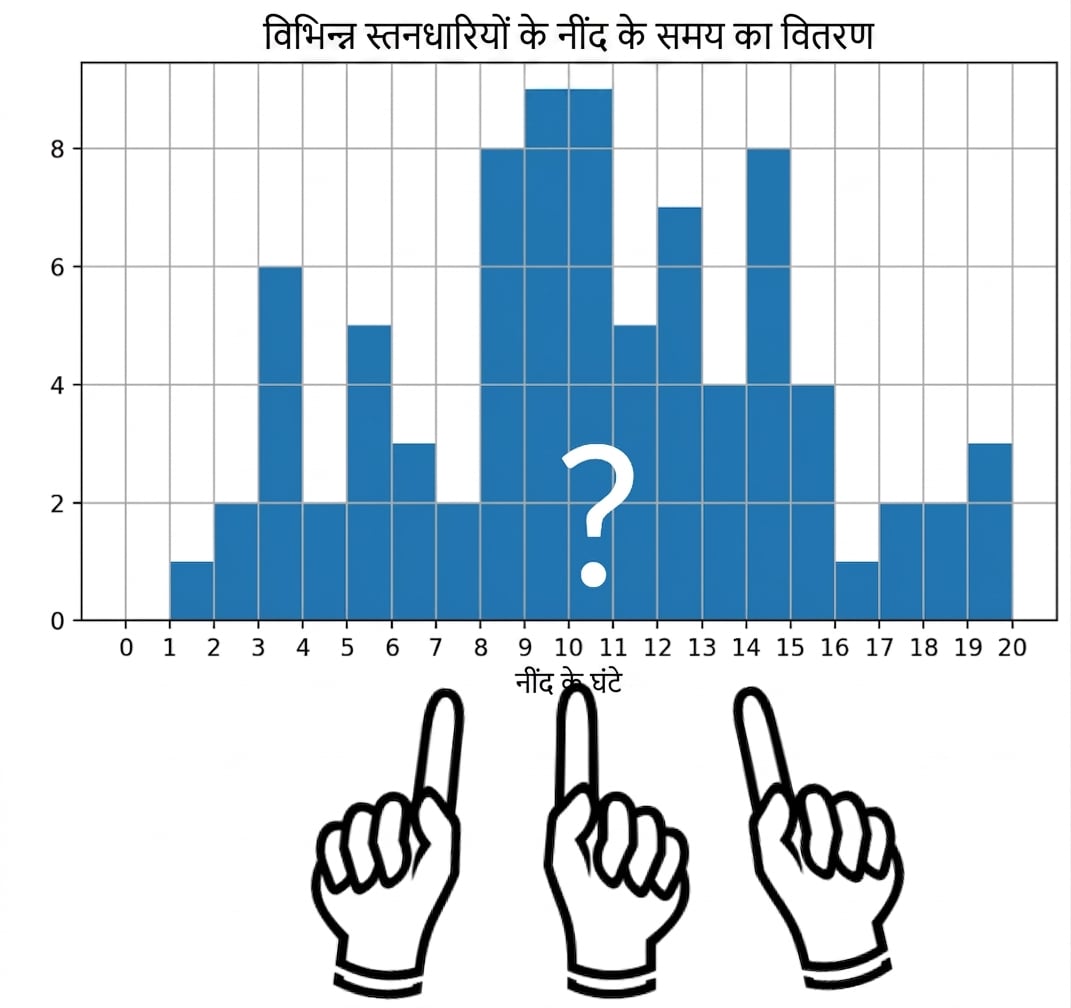
एक सामान्य मान क्या है?

डेटा का केंद्र कहाँ है?

  • Mean
  • Median
  • Mode

Screen Shot 2020-07-02 at 11.01.16 AM.png

Python में Statistics परिचय

केंद्र के माप: Mean

                  name  sleep_total
1              Cheetah         12.1
2           Owl monkey         17.0
3      Mountain beaver         14.4
4   Greater short-t...         14.9
5                  Cow          4.0
..                 ...          ...

$\text{औसत नींद समय}=$

$$\frac{12.1 + 17.0 + 14.4 + 14.9 + ...}{83} = 10.43$$

import numpy as np
np.mean(msleep['sleep_total'])
10.43373
Python में Statistics परिचय

केंद्र के माप: Median

msleep['sleep_total'].sort_values()
29     1.9
30     2.7
22     2.9
9      3.0
23     3.1
      ... 
19    18.0
61    18.1
36    19.4
21    19.7
42    19.9
msleep['sleep_total'].sort_values().iloc[41]
10.1


np.median(msleep['sleep_total'])
10.1
Python में Statistics परिचय

केंद्र के माप: Mode

सबसे अधिक बार आने वाला मान

msleep['sleep_total'].value_counts()
12.5    4
10.1    3
14.9    2
11.0    2
8.4     2
...
14.3    1
17.0    1
Name: sleep_total, Length: 65, dtype: int64
msleep['vore'].value_counts()
herbi      32
omni       20
carni      19
insecti     5
Name: vore, dtype: int64
import statistics
statistics.mode(msleep['vore'])
'herbi'
Python में Statistics परिचय

एक बाहरी मान जोड़ना

# Subset msleep to select rows where 'vore' equals 'insecti'
msleep[msleep['vore'] == 'insecti']
                     name         genus     vore         order  sleep_total
22          Big brown bat     Eptesicus  insecti    Chiroptera         19.7
43       Little brown bat        Myotis  insecti    Chiroptera         19.9
62        Giant armadillo    Priodontes  insecti     Cingulata         18.1
67  Eastern american mole      Scalopus  insecti  Soricomorpha          8.4
Python में Statistics परिचय

एक बाहरी मान जोड़ना

msleep[msleep['vore'] == "insecti"]['sleep_total'].agg(["mean", "median"])
mean      16.53
median    18.9
Name: sleep_total, dtype: float64
Python में Statistics परिचय

एक बाहरी मान जोड़ना

msleep[msleep['vore'] == 'insecti']
                     name         genus     vore         order  sleep_total
22          Big brown bat     Eptesicus  insecti    Chiroptera         19.7
43       Little brown bat        Myotis  insecti    Chiroptera         19.9
62        Giant armadillo    Priodontes  insecti     Cingulata         18.1
67  Eastern american mole      Scalopus  insecti  Soricomorpha          8.4

84 Mystery insectivore ... insecti ... 0.0
Python में Statistics परिचय

एक बाहरी मान जोड़ना

msleep[msleep['vore'] == "insecti"]['sleep_total'].agg(["mean", "median"])
mean      13.22
median    18.1
Name: sleep_total, dtype: float64

Mean: 16.5 → 13.2

Median: 18.9 → 18.1

Python में Statistics परिचय

कौन सा माप उपयोग करें?

# Import matplotlib.pyplot with alias plt
import matplotlib.pyplot as plt

# Histogram of values
data['values'].hist()

# Show the plot
plt.show()

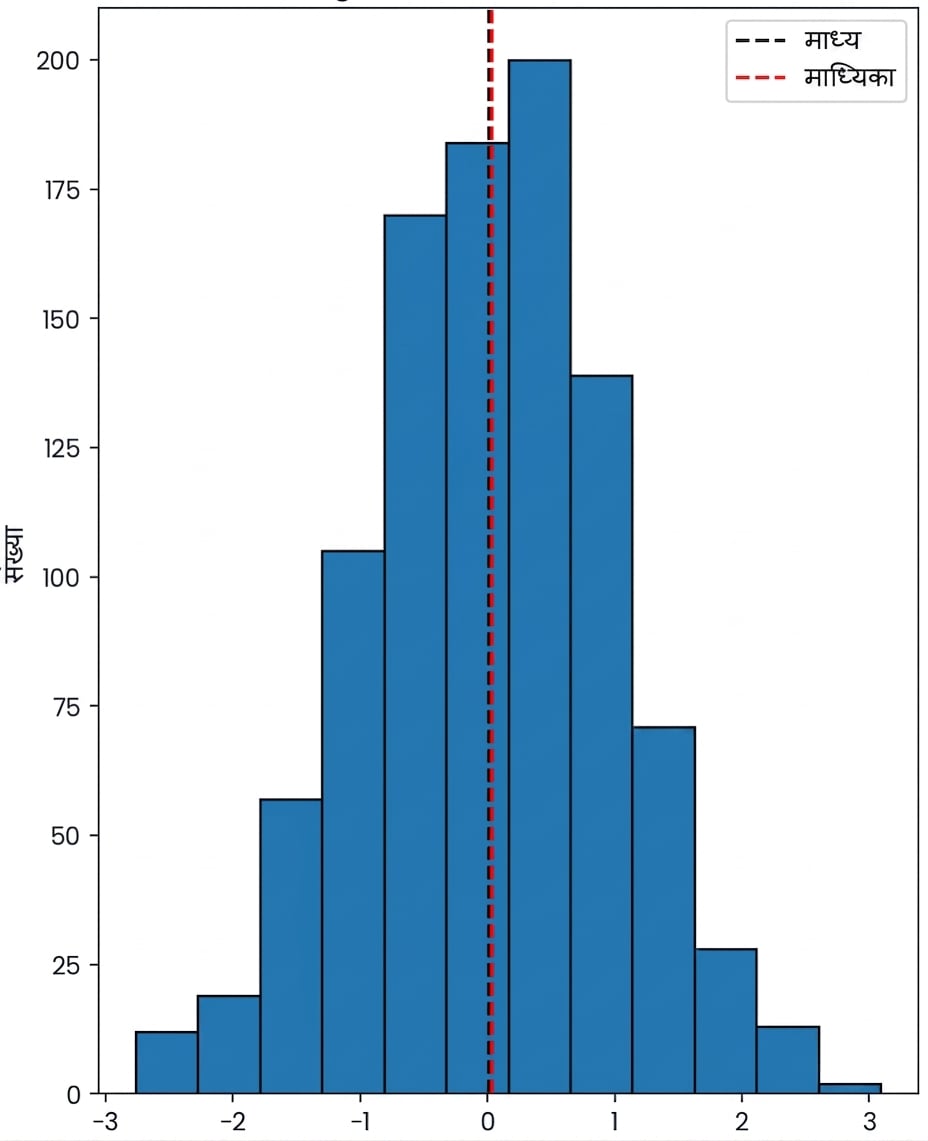
symmetrical data histogram

Python में Statistics परिचय

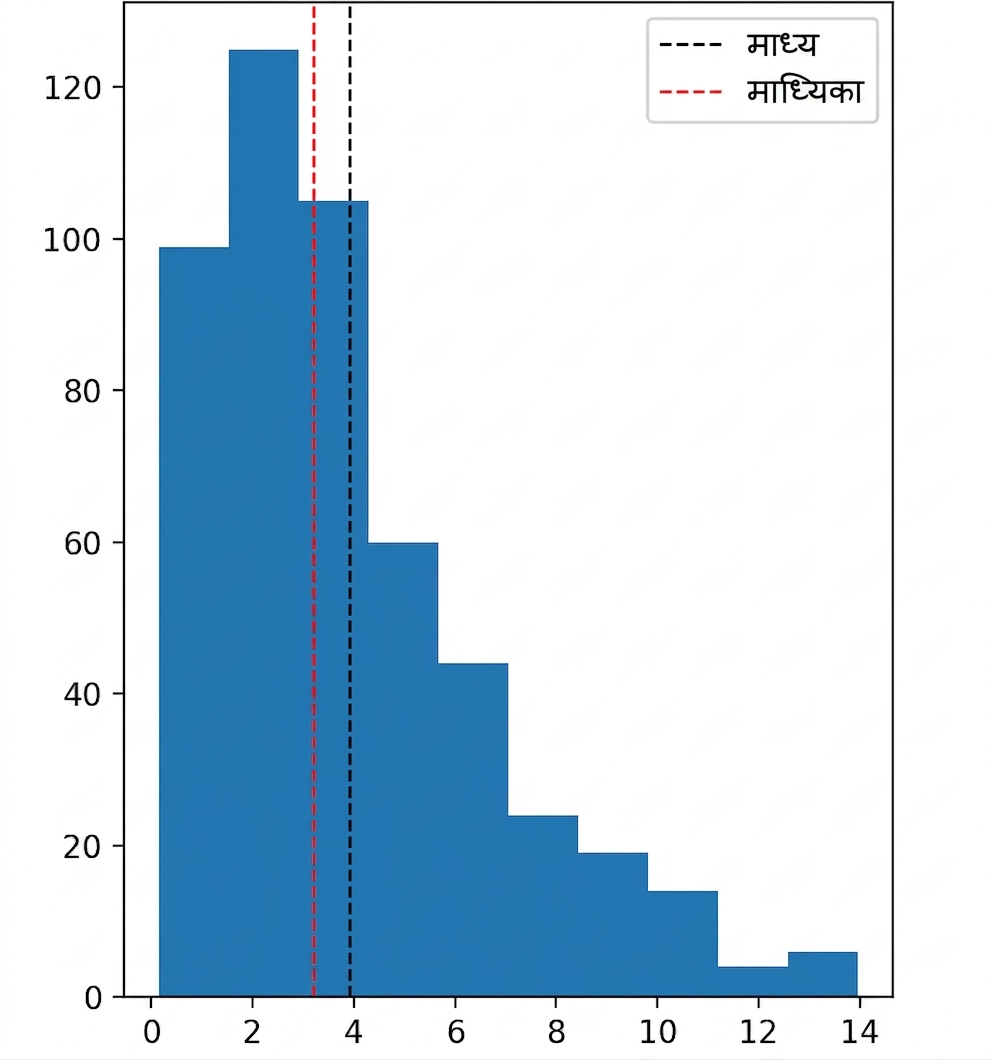
Skew

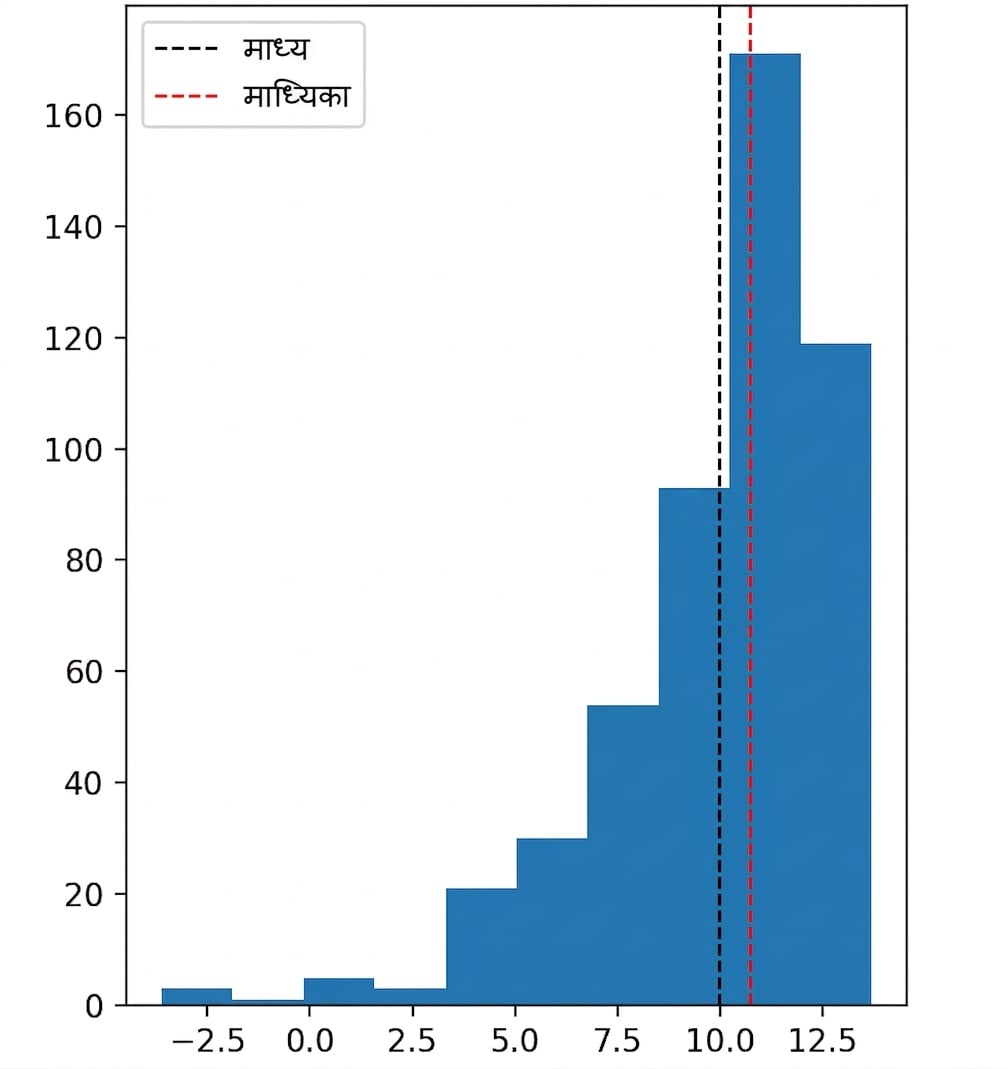
                                        Left-skewed

बाएँ तरफ कम और दाएँ तरफ बढ़ते मानों वाला हिस्टोग्राम.

                                        Right-skewed

बाएँ तरफ अधिक और दाएँ तरफ घटते मानों वाला हिस्टोग्राम.

Python में Statistics परिचय

कौन सा माप उपयोग करें?

बाएँ तरफ कम और दाएँ तरफ बढ़ते मानों वाला हिस्टोग्राम.

बाएँ तरफ अधिक और दाएँ तरफ घटते मानों वाला हिस्टोग्राम.

Python में Statistics परिचय

अभ्यास करते हैं!

Python में Statistics परिचय

Preparing Video For Download...