Logistic regression और ROC curve

scikit-learn के साथ Supervised Learning

George Boorman

Core Curriculum Manager, DataCamp

बाइनरी classification के लिए Logistic regression

  • Logistic regression का उपयोग classification समस्याओं में होता है

  • Logistic regression probabilities आउटपुट करता है

  • अगर probability, $ \ p>0.5$:

    • डेटा को 1 लेबल दिया जाता है
  • अगर probability, $ \ p<0.5$:

    • डेटा को 0 लेबल दिया जाता है
scikit-learn के साथ Supervised Learning

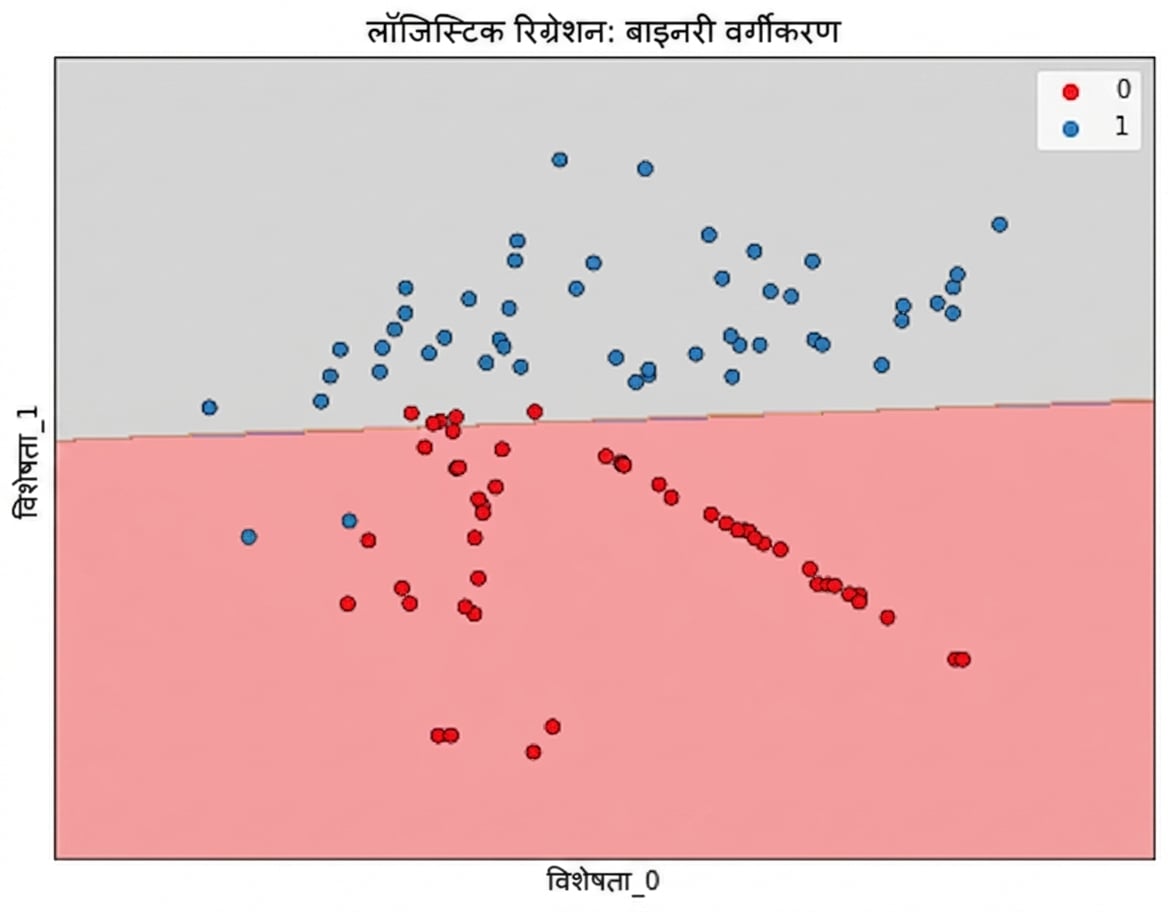
Linear decision boundary

feature1 बनाम feature2 का scatter plot, churn predict करने हेतु बाएँ से दाएँ जाती सीधी decision boundary

scikit-learn के साथ Supervised Learning

scikit-learn में Logistic regression

from sklearn.linear_model import LogisticRegression

logreg = LogisticRegression()
X_train, X_test, y_train, y_test = train_test_split(X, y, test_size=0.3, random_state=42)
logreg.fit(X_train, y_train)
y_pred = logreg.predict(X_test)
scikit-learn के साथ Supervised Learning

Probabilities predict करना

y_pred_probs = logreg.predict_proba(X_test)[:, 1]

print(y_pred_probs[0])
[0.08961376]
scikit-learn के साथ Supervised Learning

Probability thresholds

  • डिफॉल्ट रूप से, logistic regression threshold = 0.5

  • यह सिर्फ logistic regression तक सीमित नहीं

    • KNN classifiers में भी thresholds होते हैं
  • यदि हम threshold बदलें तो क्या होगा?

scikit-learn के साथ Supervised Learning

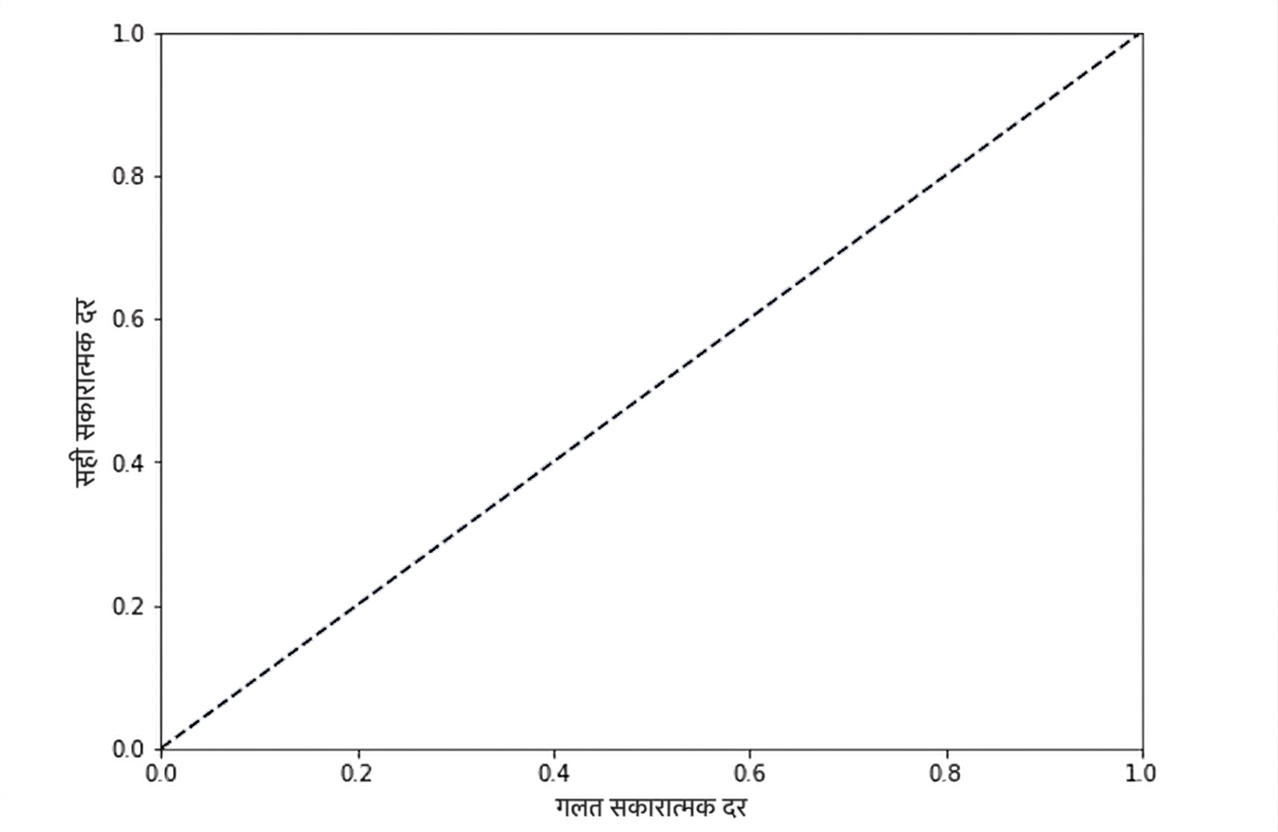
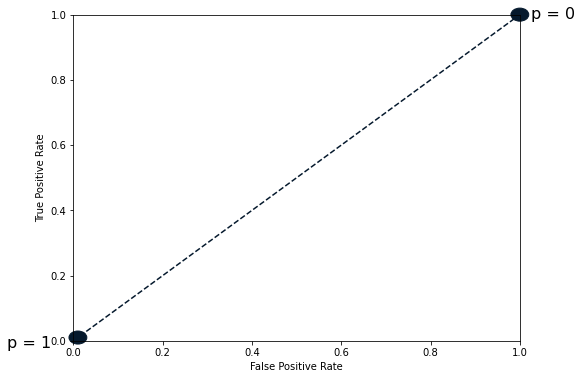
ROC curve

true positive rate बनाम false positive rate, नीचे-बाएँ से ऊपर-दाएँ जाती डॉटेड रेखा के साथ

scikit-learn के साथ Supervised Learning

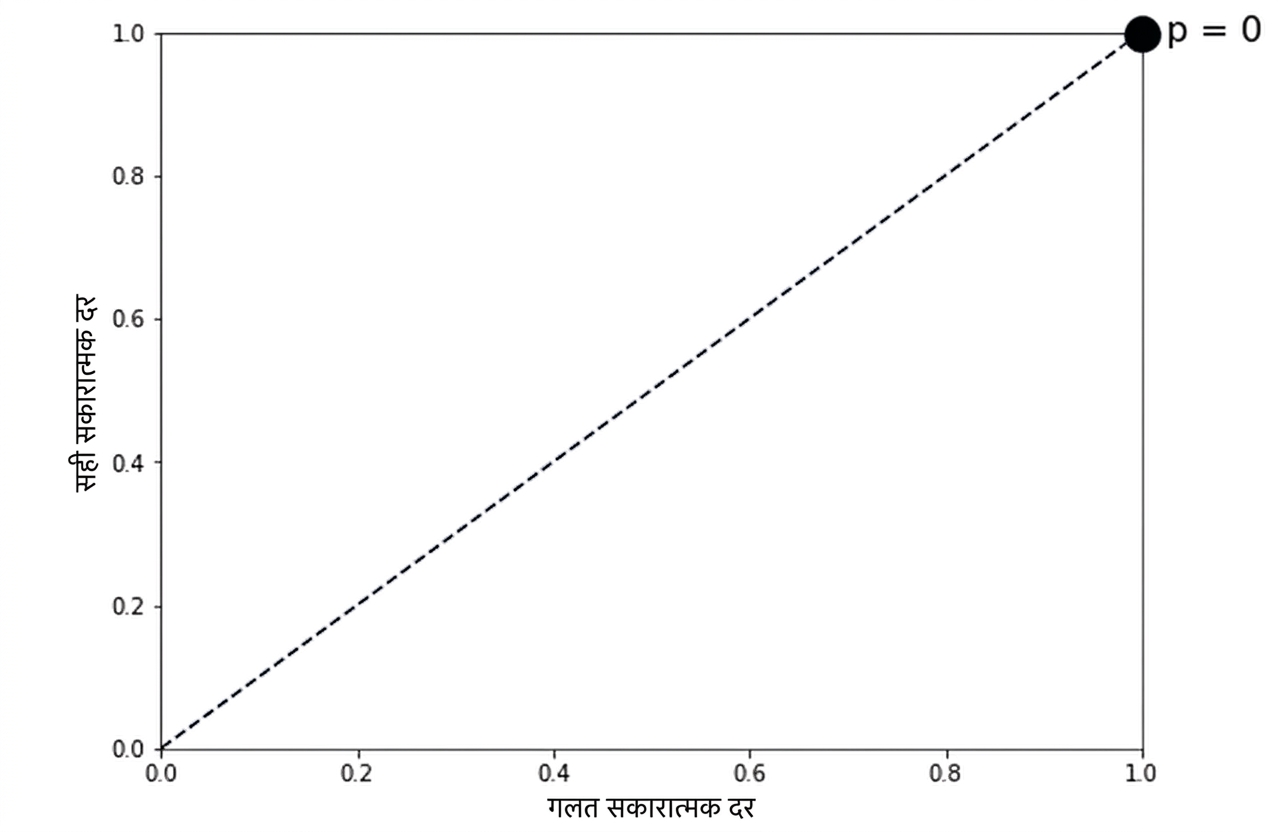
ROC curve

ऊपर-दाएँ कोने में zero threshold हाइलाइटेड

scikit-learn के साथ Supervised Learning

ROC curve

नीचे-बाएँ में threshold 1 भी हाइलाइटेड

scikit-learn के साथ Supervised Learning

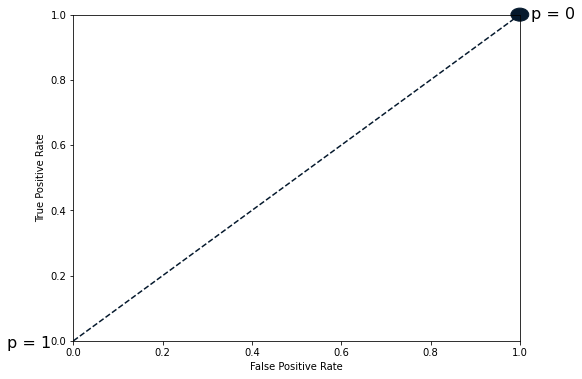
ROC curve

दोनों thresholds हाइलाइटेड

scikit-learn के साथ Supervised Learning

ROC curve

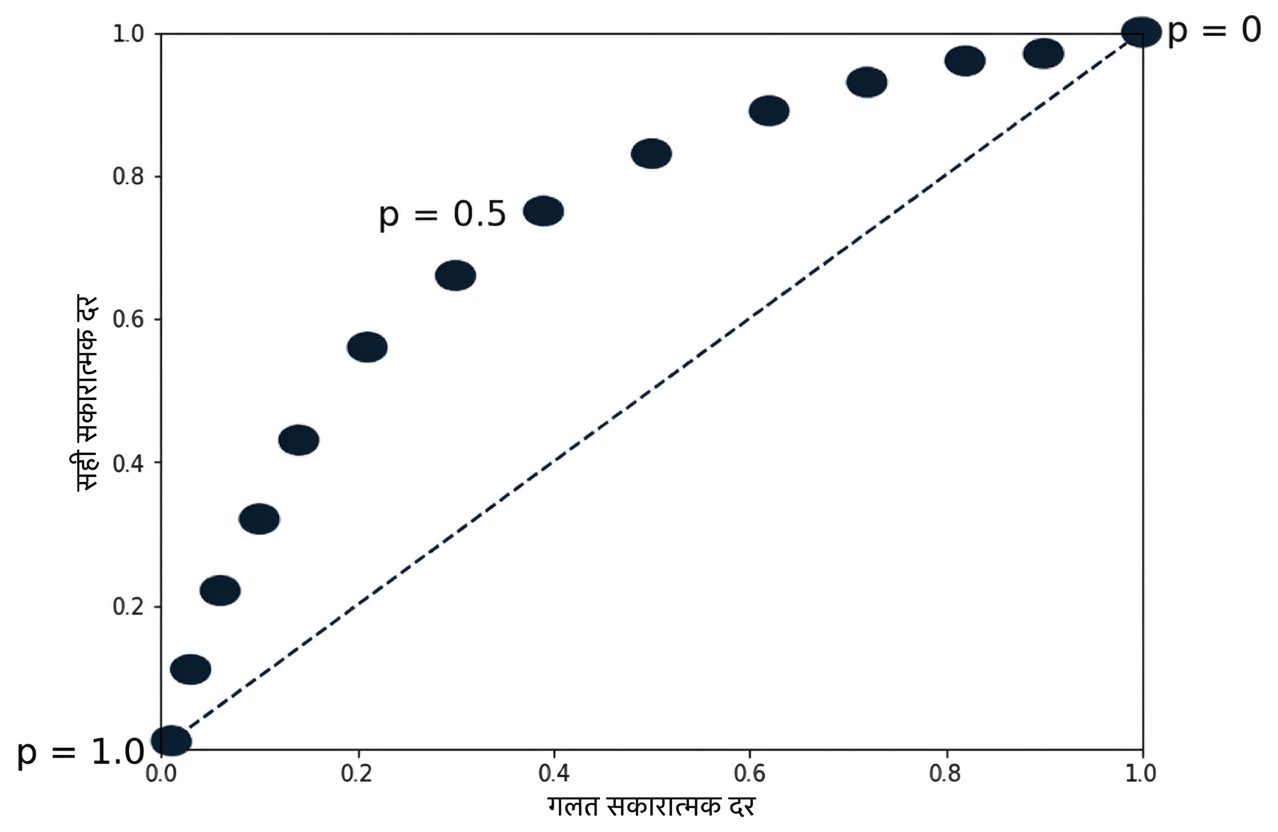
विभिन्न thresholds दर्शाते बिंदु, डॉटेड रेखा के ऊपर-दाएँ मुड़ते हुए

scikit-learn के साथ Supervised Learning

ROC curve

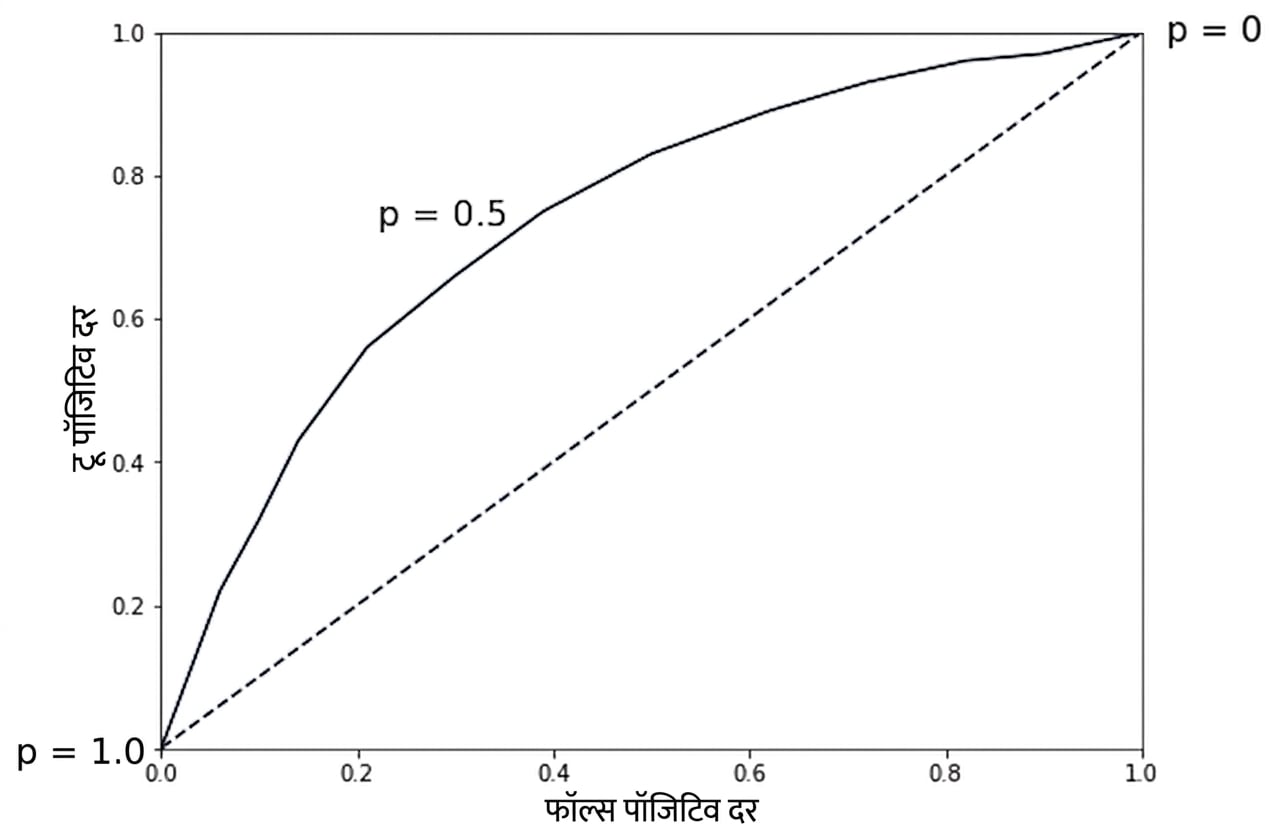
विभिन्न thresholds दर्शाती रेखा, डॉटेड रेखा के ऊपर-दाएँ मुड़ती हुई

scikit-learn के साथ Supervised Learning

ROC curve प्लॉट करना

from sklearn.metrics import roc_curve

fpr, tpr, thresholds = roc_curve(y_test, y_pred_probs)
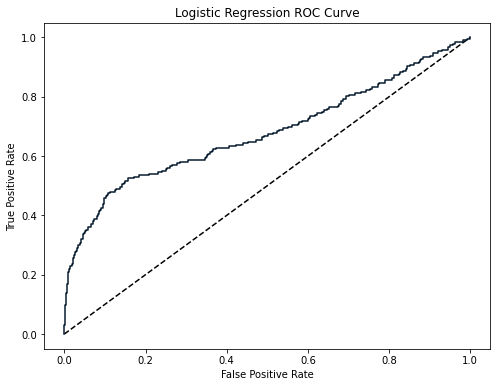
plt.plot([0, 1], [0, 1], 'k--') plt.plot(fpr, tpr) plt.xlabel('False Positive Rate') plt.ylabel('True Positive Rate') plt.title('Logistic Regression ROC Curve') plt.show()
scikit-learn के साथ Supervised Learning

ROC curve प्लॉट करना

churn डेटासेट का ROC curve प्लॉट, नीचे-बाएँ से ऊपर-दाएँ जाती रेखा के साथ

scikit-learn के साथ Supervised Learning

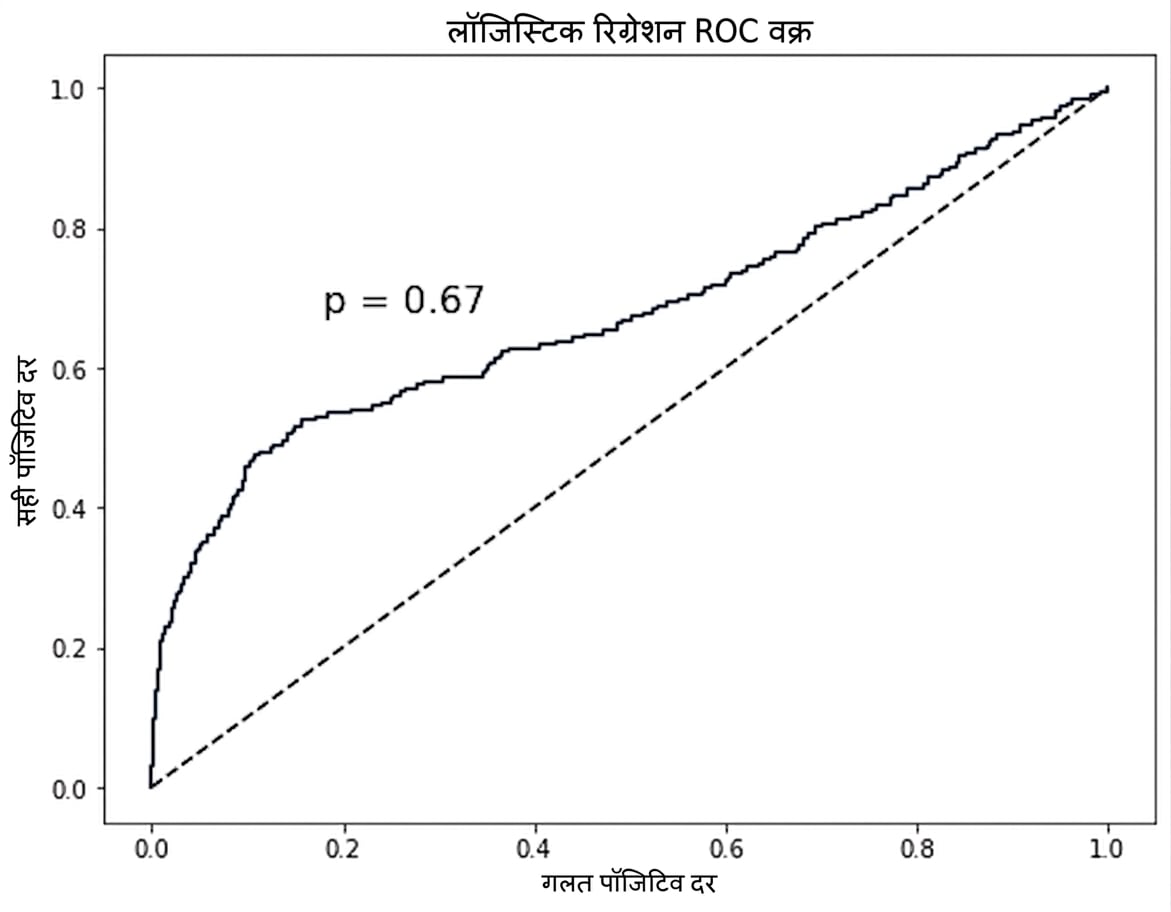
ROC AUC

churn डेटासेट का ROC curve प्लॉट, नीचे-बाएँ से ऊपर-दाएँ जाती रेखा, जिसमें p=0.67 annotation है

scikit-learn के साथ Supervised Learning

scikit-learn में ROC AUC

from sklearn.metrics import roc_auc_score

print(roc_auc_score(y_test, y_pred_probs))
0.6700964152663693
scikit-learn के साथ Supervised Learning

अभ्यास करते हैं!

scikit-learn के साथ Supervised Learning

Preparing Video For Download...