फैक्टर संबंध और वितरण

Python में Exploratory Data Analysis

Izzy Weber

Curriculum Manager, DataCamp

शिक्षा स्तर: पुरुष साथी

divorce["education_man"].value_counts()
Professional    1313
Preparatory      501
Secondary        288
Primary          100
None               4
Other              3
Name: education_man, dtype: int64
Python में Exploratory Data Analysis

श्रेणीय संबंधों की जाँच

sns.histplot(data=divorce, x="marriage_duration", binwidth=1)
plt.show()
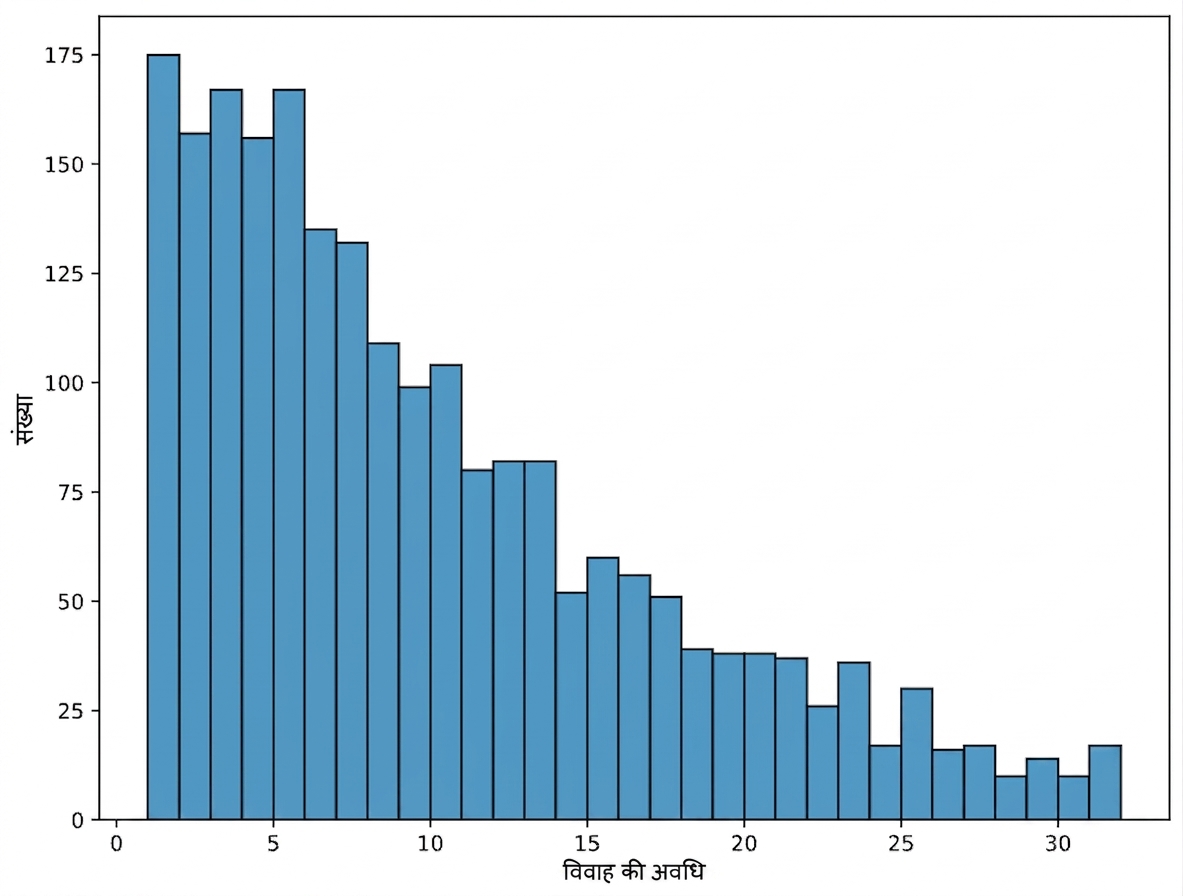
विवाह अवधि का हिस्टोग्राम

Python में Exploratory Data Analysis

श्रेणीय संबंधों की जाँच

sns.histplot(data=divorce, x="marriage_duration", hue="education_man", binwidth=1)
plt.show()
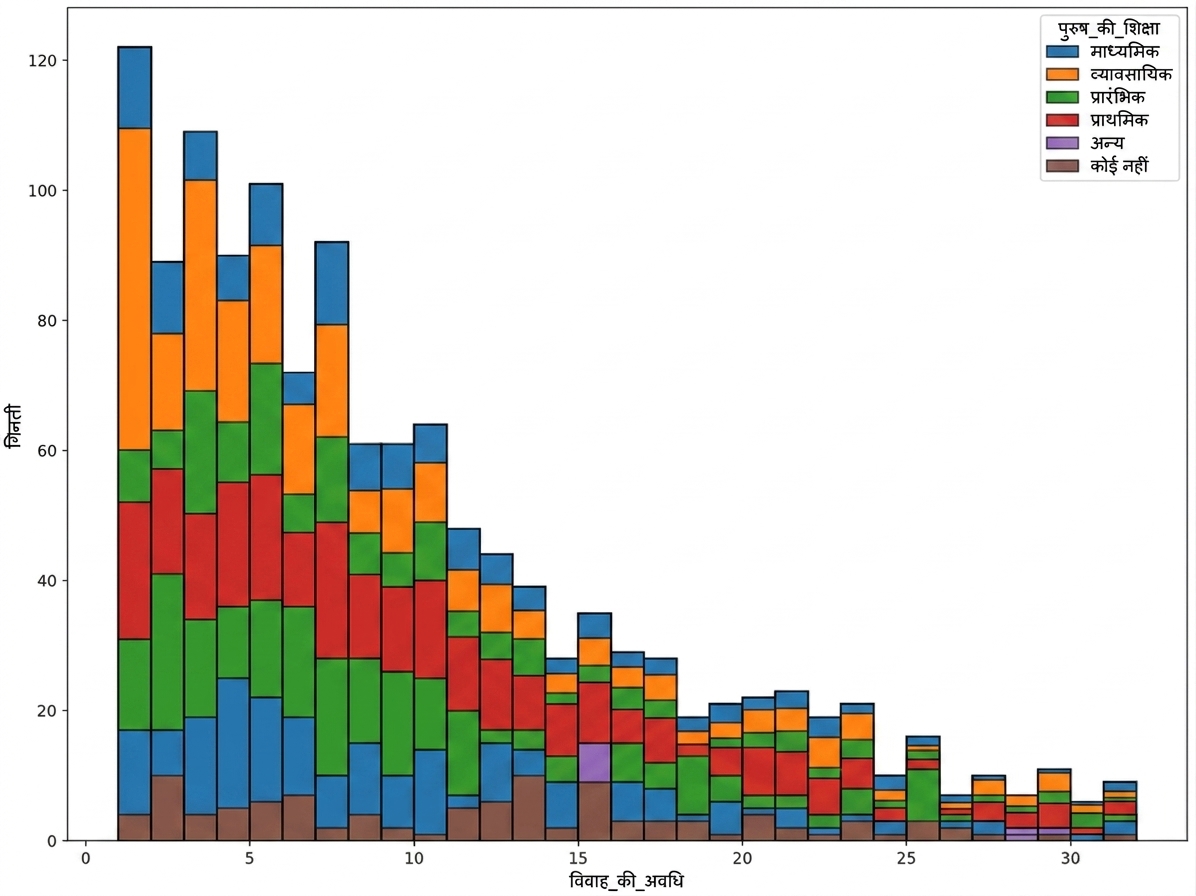
education_man के अनुसार रंग-कोडेड विवाह अवधि का हिस्टोग्राम

Python में Exploratory Data Analysis

कर्नेल डेन्सिटी इस्टीमेट (KDE) प्लॉट्स

sns.kdeplot(data=divorce, x="marriage_duration", hue="education_man")
plt.show()
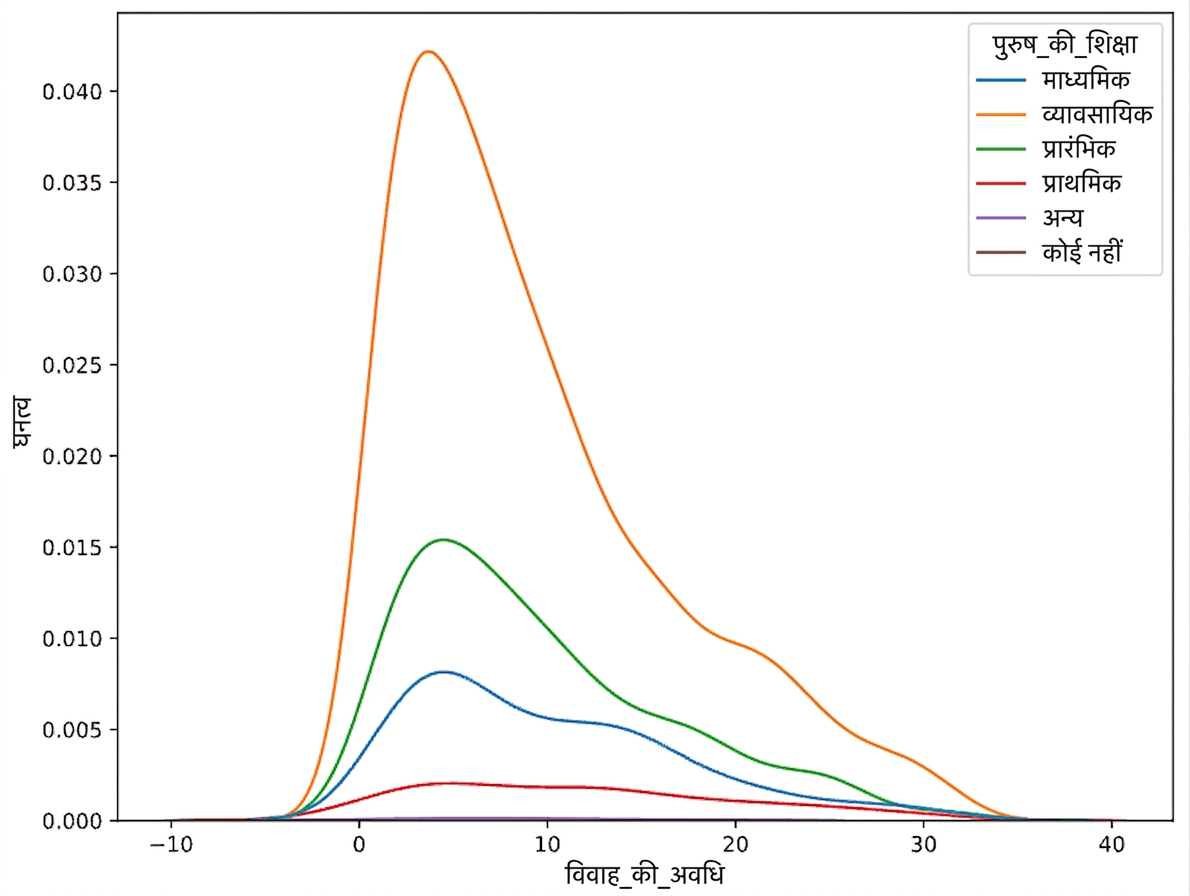
education_man को hue के रूप में सेट कर विवाह अवधि का KDE

Python में Exploratory Data Analysis

कर्नेल डेन्सिटी इस्टीमेट (KDE) प्लॉट्स
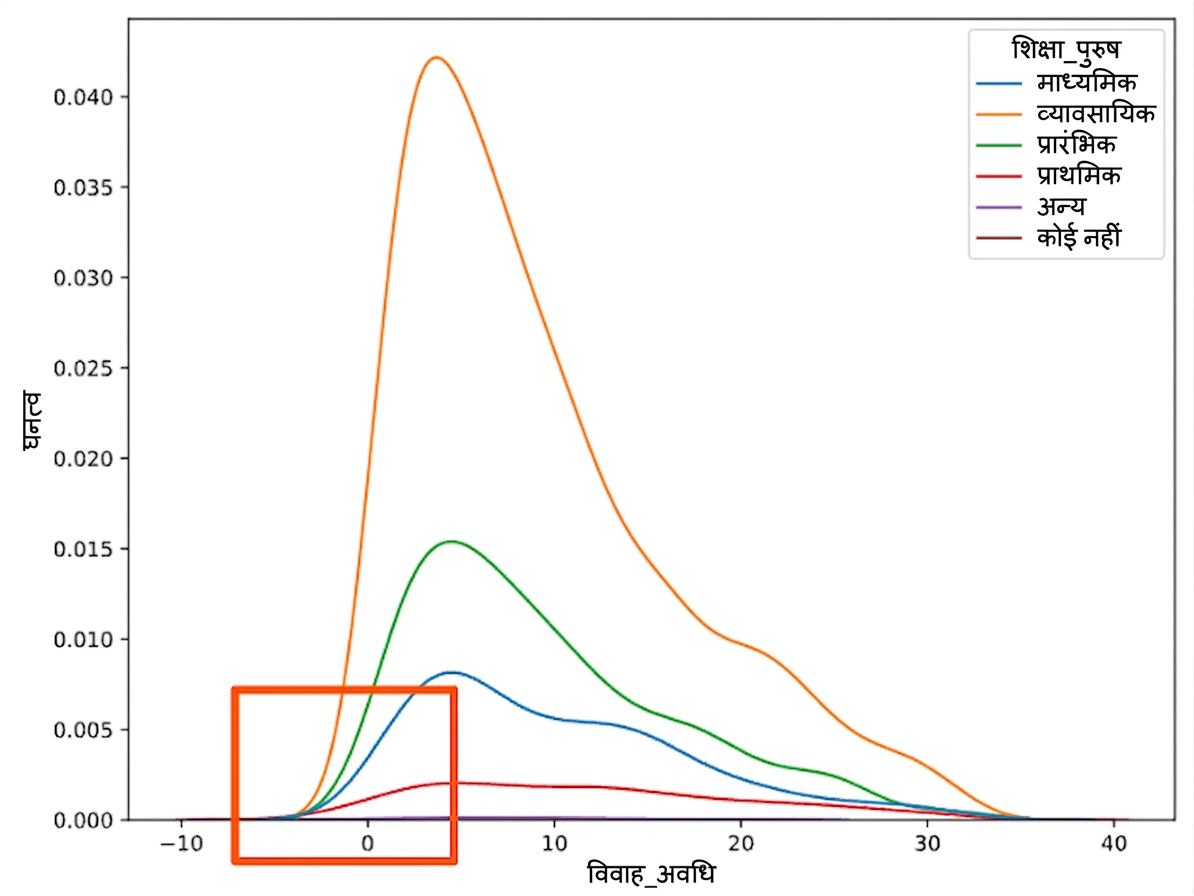
education_man को hue के रूप में सेट कर विवाह अवधि का KDE, marriage_duration शून्य पर ज़ूम

Python में Exploratory Data Analysis

कर्नेल डेन्सिटी इस्टीमेट (KDE) प्लॉट्स

sns.kdeplot(data=divorce, x="marriage_duration", hue="education_man", cut=0)
plt.show()
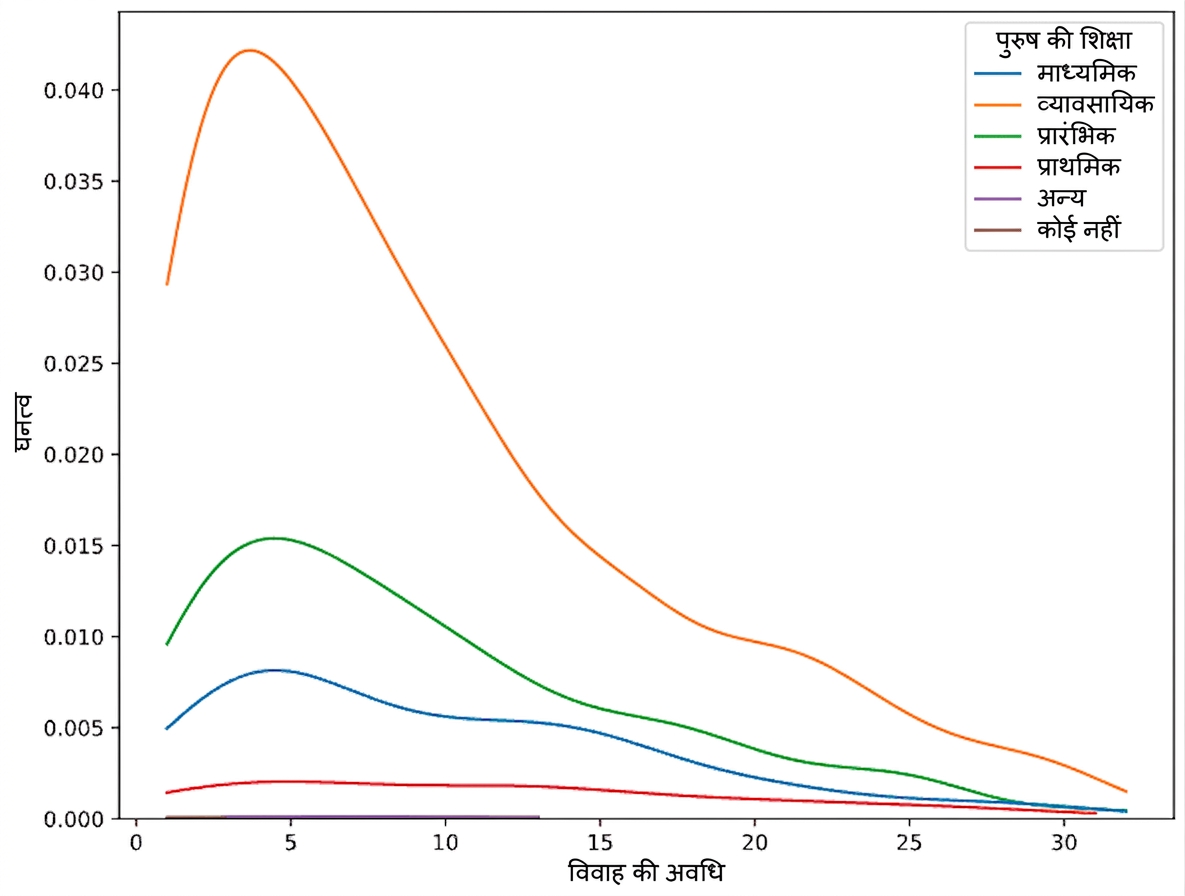
education_man को hue के रूप में सेट कर और cut शून्य के बराबर रखते हुए विवाह अवधि का KDE

Python में Exploratory Data Analysis

संचयी KDE प्लॉट्स

sns.kdeplot(data=divorce, x="marriage_duration", hue="education_man", cut=0, cumulative=True)
plt.show()
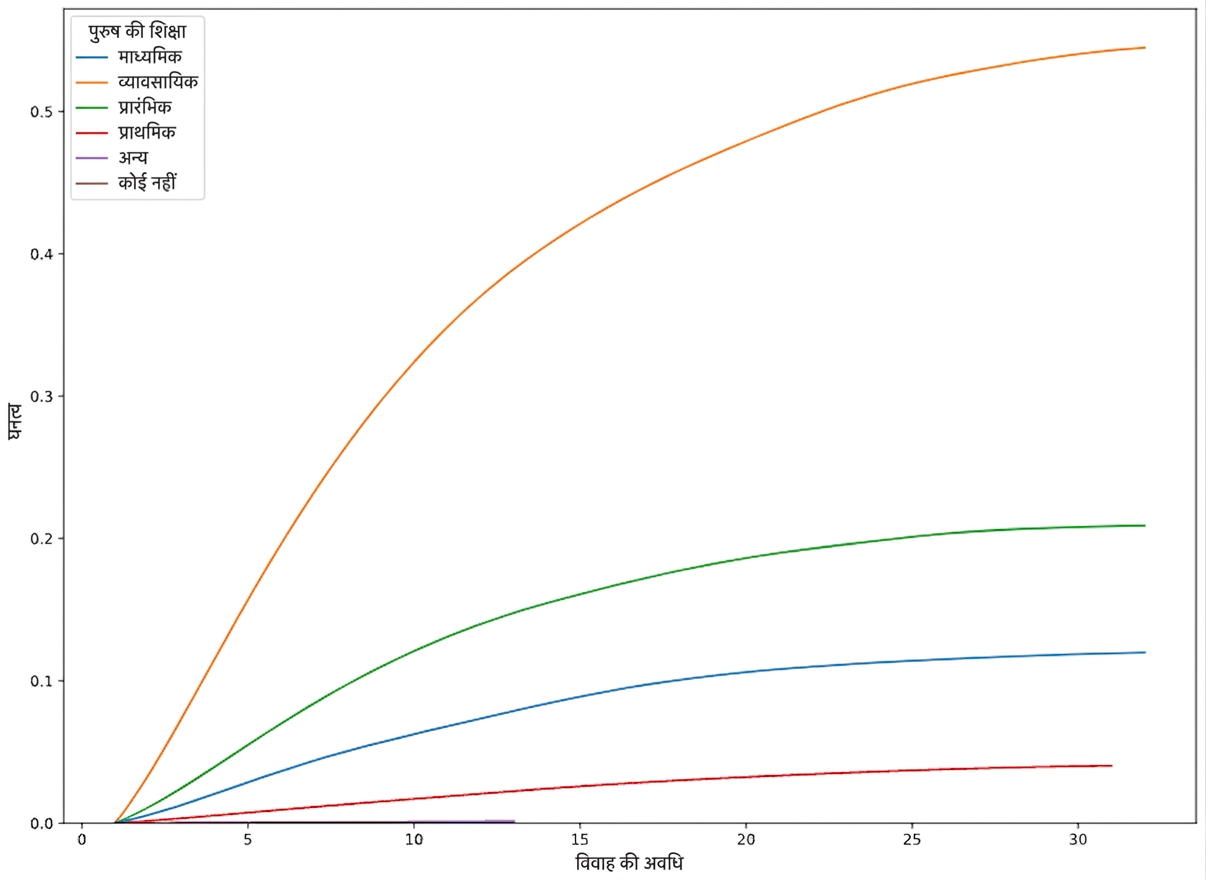
education_man को hue के रूप में सेट कर और cut शून्य रखते हुए विवाह अवधि का संचयी वितरण फंक्शन

Python में Exploratory Data Analysis

विवाह-आयु और शिक्षा का संबंध

  • क्या विवाह-आयु और शिक्षा स्तर में संबंध है?
divorce["man_age_marriage"] = divorce["marriage_year"] - divorce["dob_man"].dt.year
divorce["woman_age_marriage"] = divorce["marriage_year"] - divorce["dob_woman"].dt.year
Python में Exploratory Data Analysis

श्रेणीय वैरिएबल्स के साथ स्कैटर प्लॉट

sns.scatterplot(data=divorce, x="woman_age_marriage", y="man_age_marriage")
plt.show()
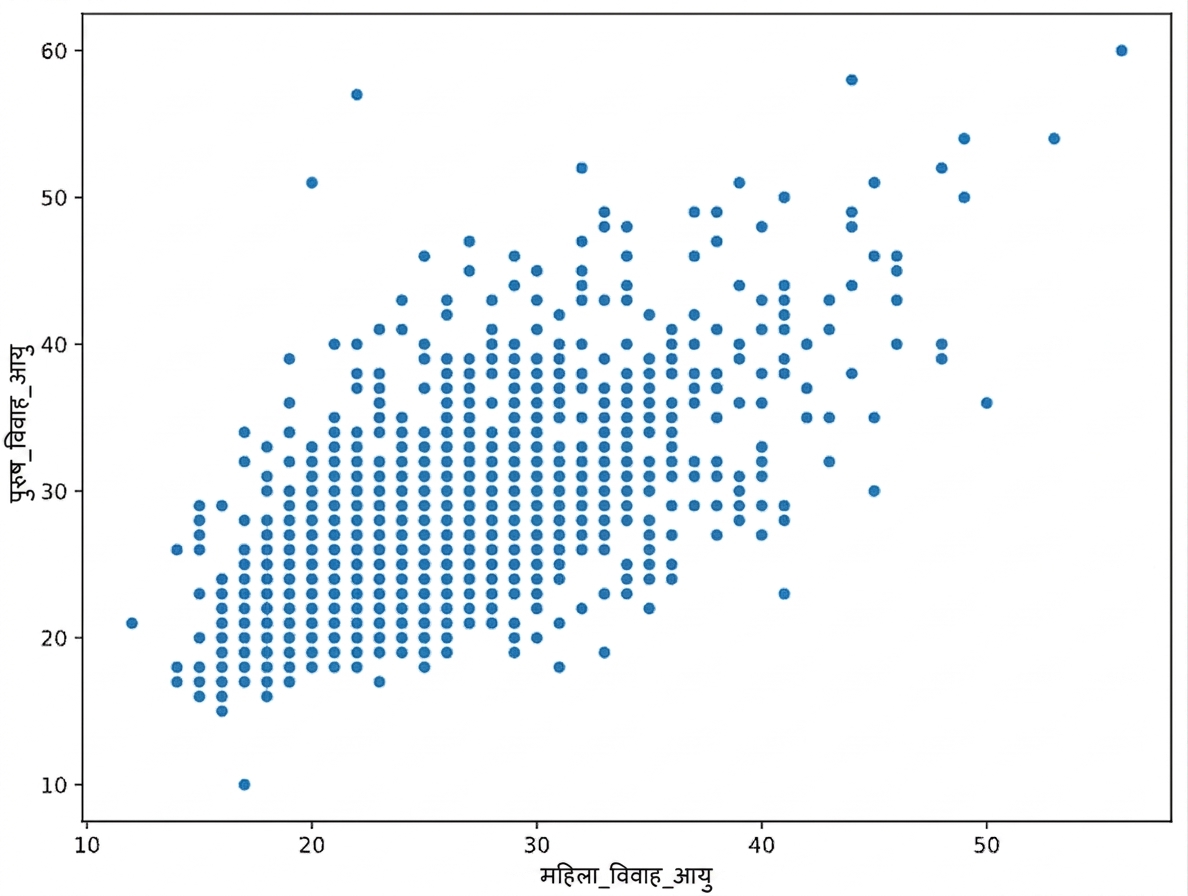
woman_age_marriage और man_age_marriage का स्कैटरप्लॉट

Python में Exploratory Data Analysis

श्रेणीय वैरिएबल्स के साथ स्कैटर प्लॉट
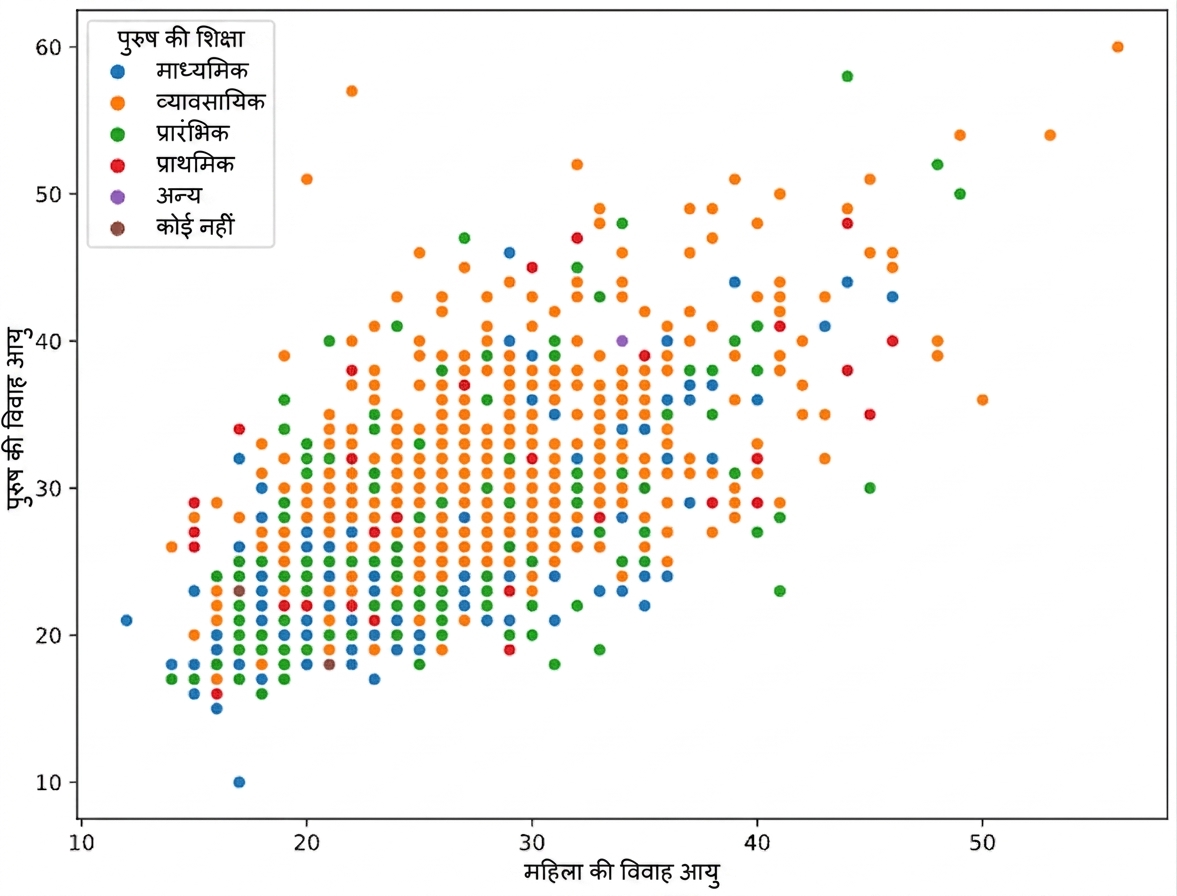
sns.scatterplot(data=divorce, 
                x="woman_age_marriage",
                y="man_age_marriage", 
                hue="education_man")
plt.show()

education_man को hue के रूप में सेट कर woman_age_marriage और man_age_marriage का स्कैटरप्लॉट

Python में Exploratory Data Analysis

अभ्यास करते हैं!

Python में Exploratory Data Analysis

Preparing Video For Download...