Introduktion till datavisualisering med ggplot2
Rick Scavetta
Founder, Scavetta Academy
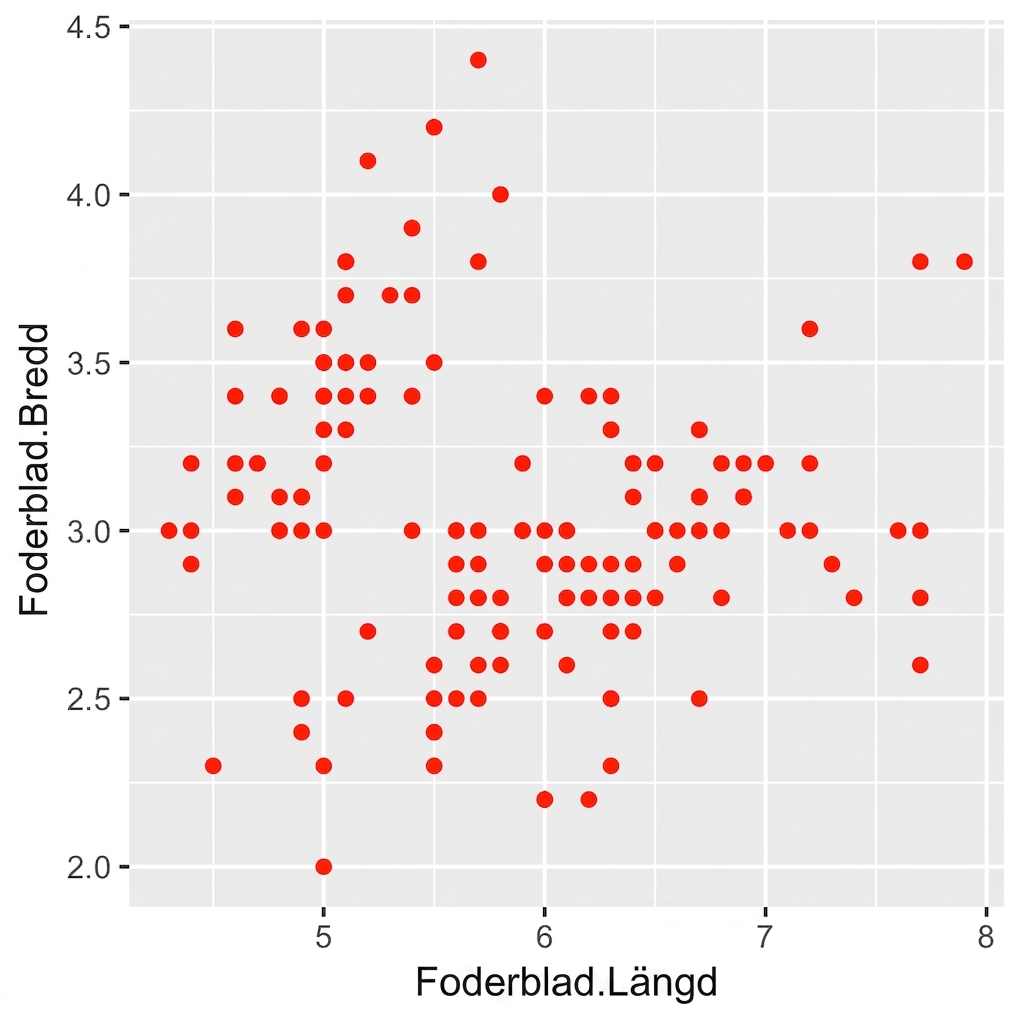
ggplot(iris, aes(x = Sepal.Length,
y = Sepal.Width)) +
geom_point(color = "red")
| Typ | Egenskap |
|---|---|
| Färg | "red" |
Ange attribut i geom_*().
Attributet color är satt till "red".

ggplot(iris, aes(x = Sepal.Length,
y = Sepal.Width)) +
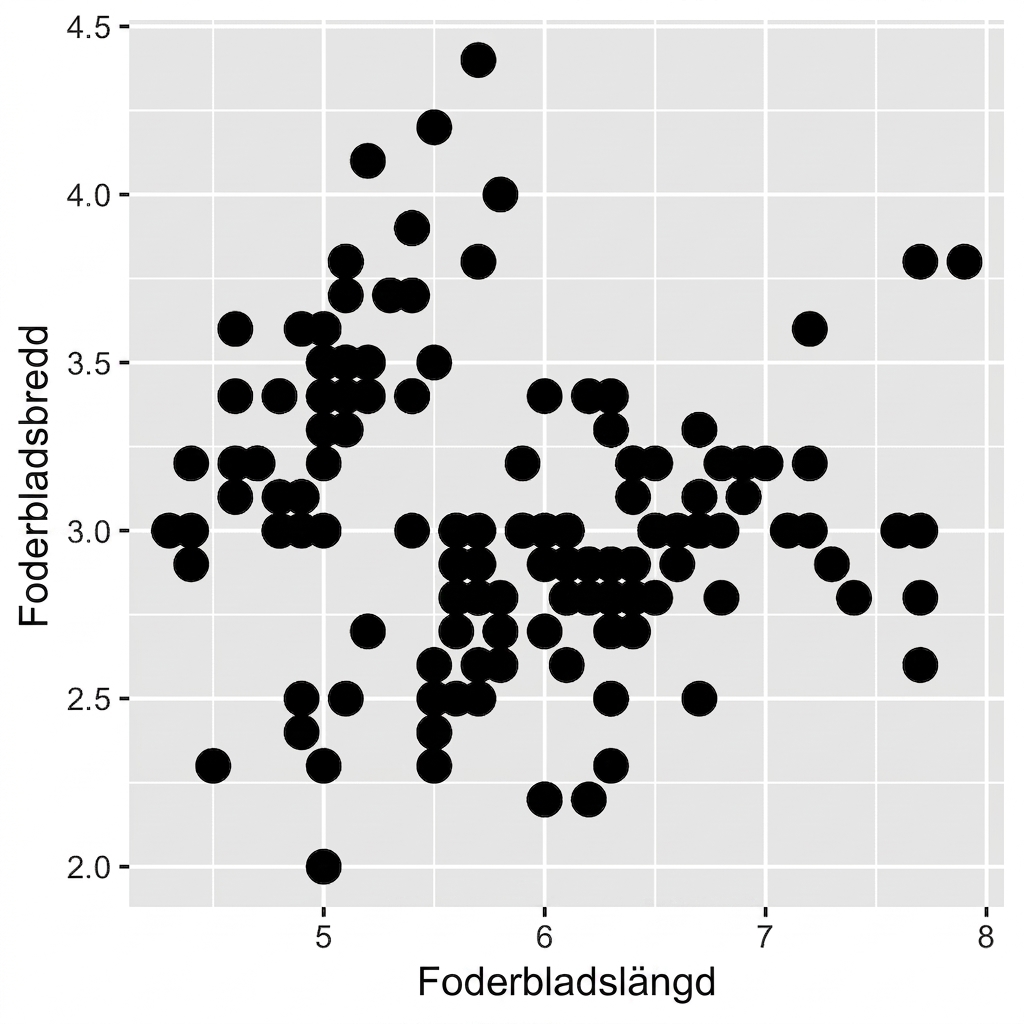
geom_point(size = 10)
| Typ | Egenskap |
|---|---|
| Storlek | 4 |

ggplot(iris, aes(x = Sepal.Length,
y = Sepal.Width)) +
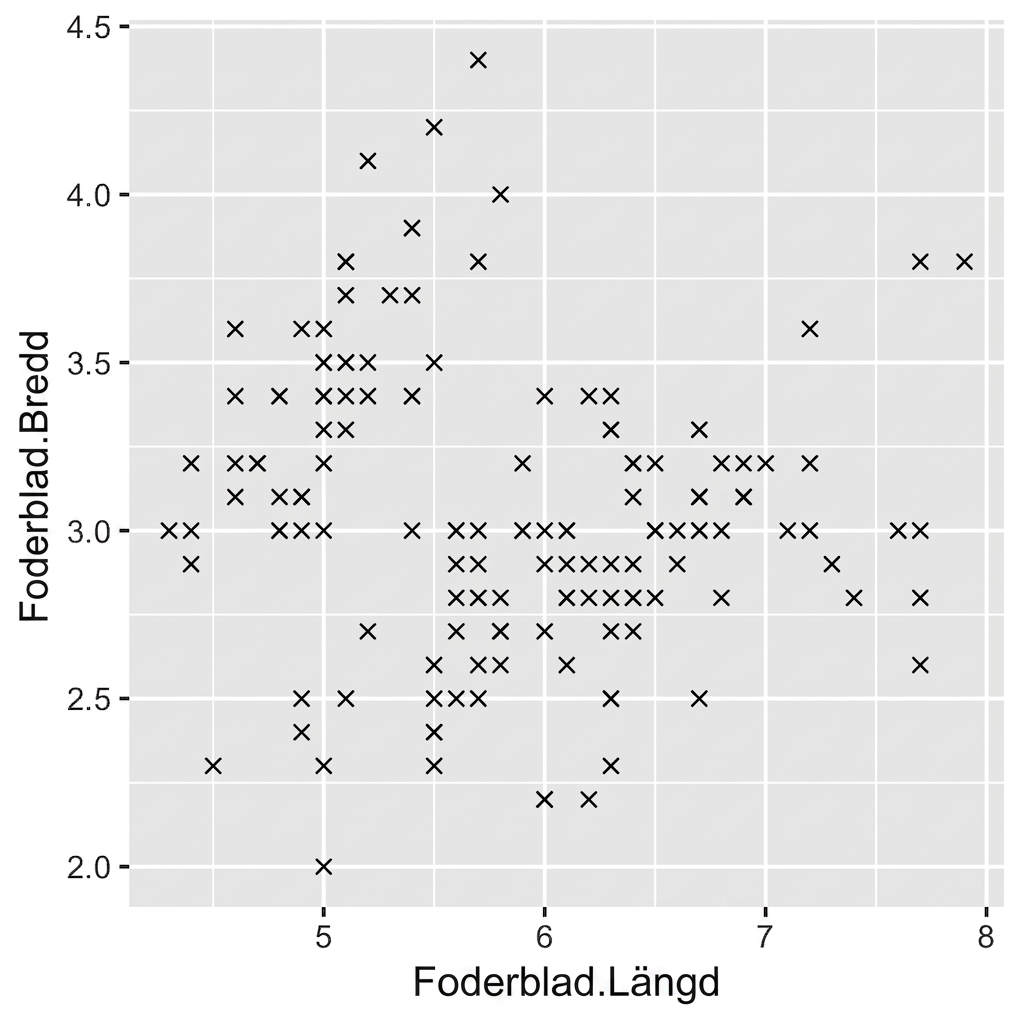
geom_point(shape = 4)
| Typ | Egenskap |
|---|---|
| Form | 4 |

Introduktion till datavisualisering med ggplot2