Histogram

Introduktion till datavisualisering med ggplot2

Rick Scavetta

Founder, Scavetta Academy

Vanliga diagramtyper

Plottyp Möjliga geoms
Spridningsdiagram points, jitter, abline, smooth, count
Stapeldiagram histogram, bar, col, errorbar
Linjediagram line, path
Introduktion till datavisualisering med ggplot2

Histogram

ggplot(iris, aes(x = Sepal.Width)) + 
  geom_histogram()
  • Ett diagram över grupperade värden
    • dvs. en statistisk funktion
`stat_bin()` using `bins = 30`.
Pick better value with `binwidth`.

Introduktion till datavisualisering med ggplot2

Standard: 30 jämna intervall

ggplot(iris, aes(x = Sepal.Width)) + 
  geom_histogram()
  • Ett diagram över grupperade värden
    • dvs. en statistisk funktion
# Default bin width:
diff(range(iris$Sepal.Width))/30
[1] 0.08

Introduktion till datavisualisering med ggplot2

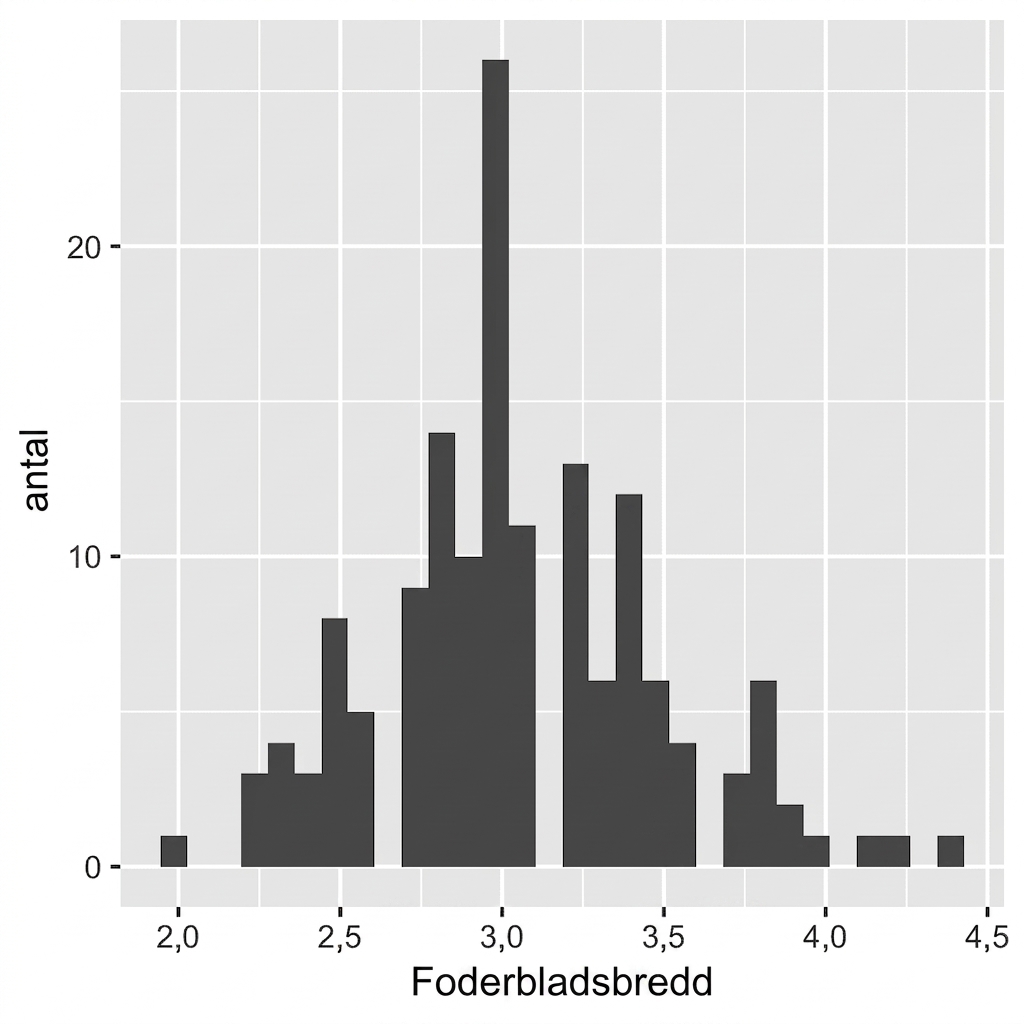
Intuitiva och meningsfulla intervallbredder
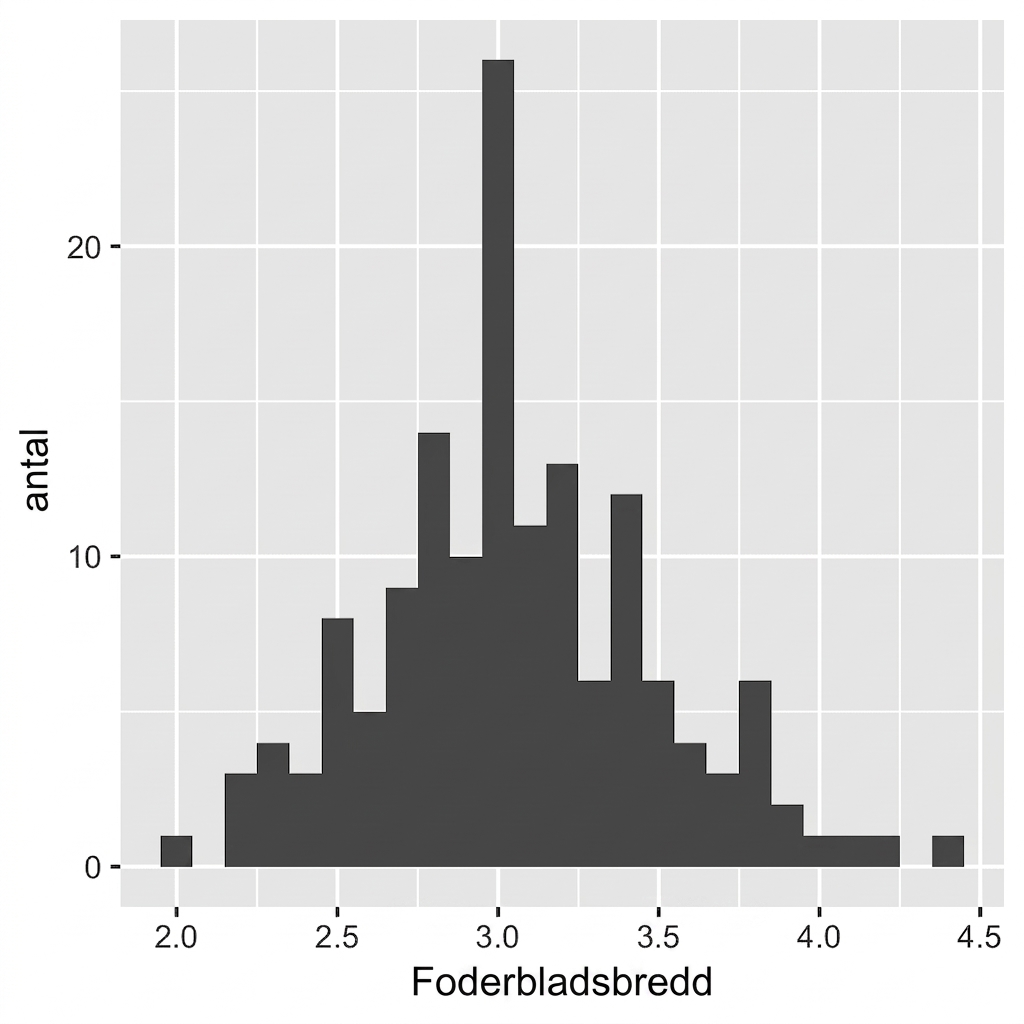
ggplot(iris, aes(x = Sepal.Width)) + 
  geom_histogram(binwidth = 0.1)
  • Ange alltid en meningsfull intervallbredd för dina data.

  • Inga mellanrum mellan staplarna.

Introduktion till datavisualisering med ggplot2

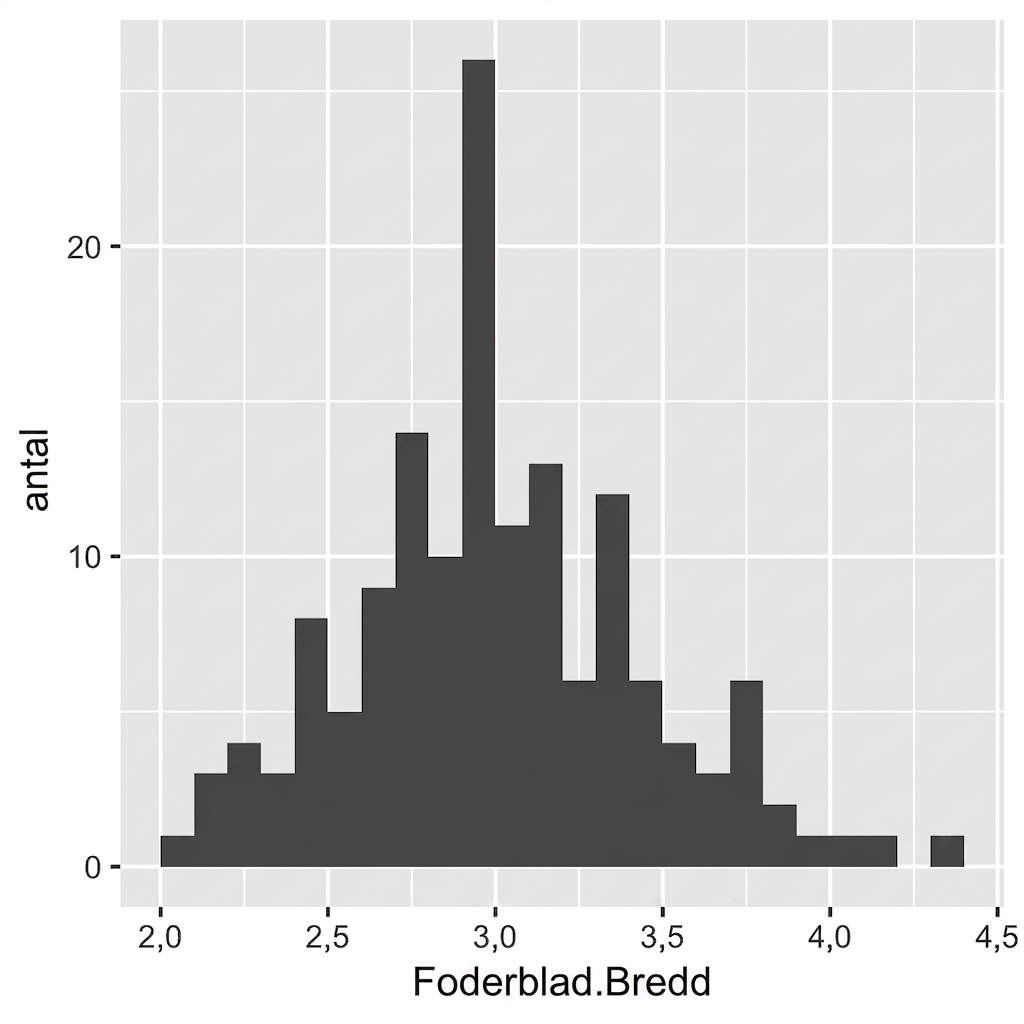
Flytta skalstreck

ggplot(iris, aes(x = Sepal.Width)) + 
  geom_histogram(binwidth = 0.1,
                 center = 0.05)
  • Ange alltid en meningsfull intervallbredd för dina data.

  • Inga mellanrum mellan staplarna.

  • X-axelns etiketter placeras mellan staplarna.

Introduktion till datavisualisering med ggplot2

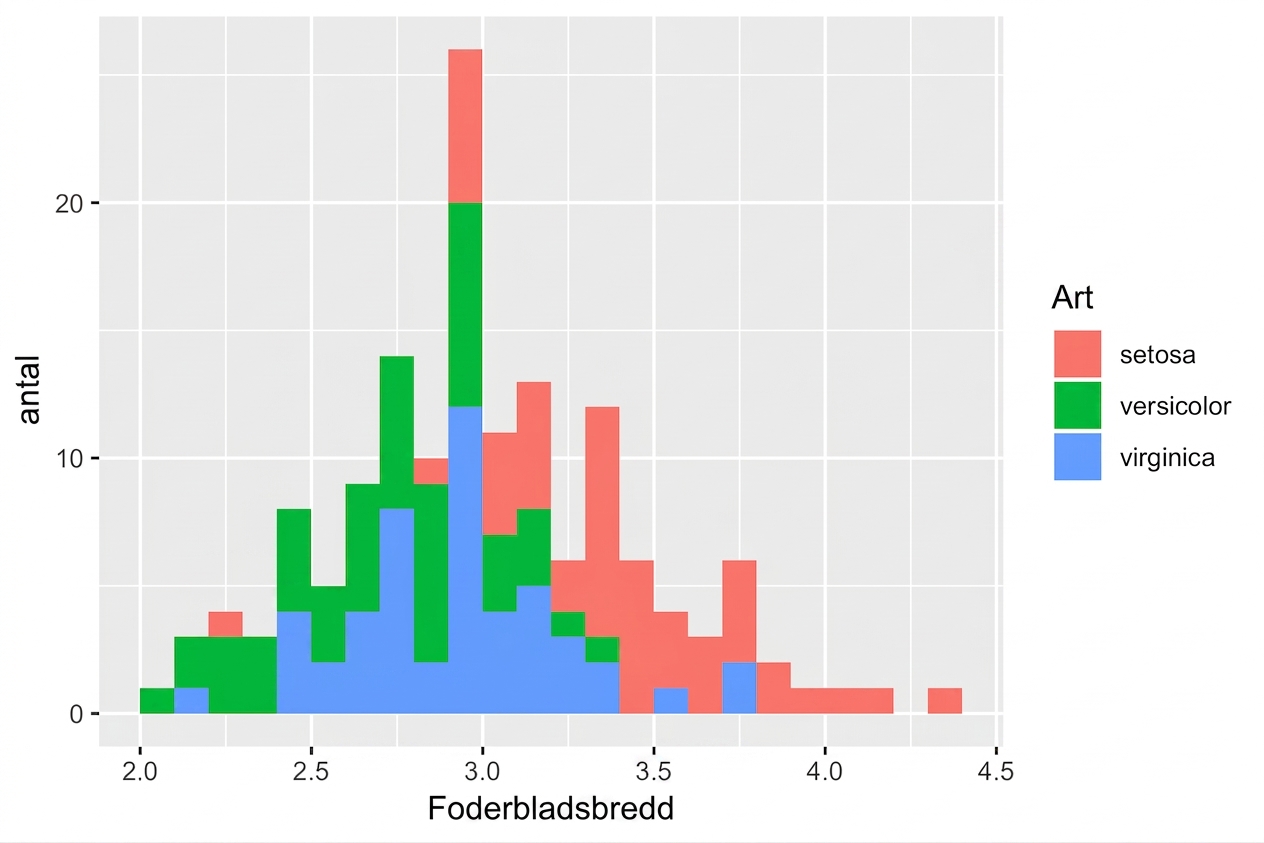
Olika arter

ggplot(iris, aes(x = Sepal.Width, 
                 fill = Species)) + 
  geom_histogram(binwidth = .1, 
                 center = 0.05)

Introduktion till datavisualisering med ggplot2

Standardposition är "stack"

ggplot(iris, aes(x = Sepal.Width,
                 fill = Species)) + 
  geom_histogram(binwidth = .1, 
                 center = 0.05,
                 position = "stack") 

Introduktion till datavisualisering med ggplot2

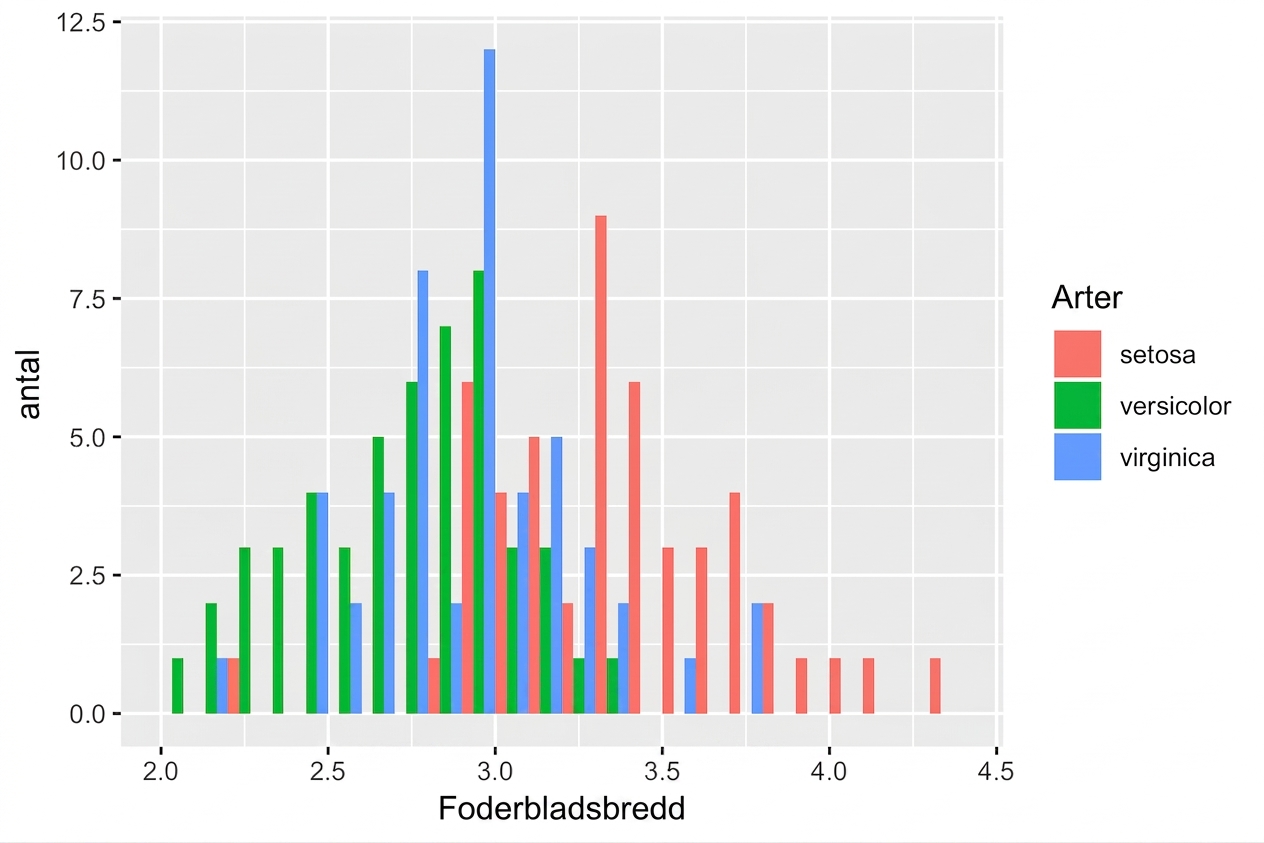
position = "dodge"

ggplot(iris, aes(x = Sepal.Width, 
                 fill = Species)) + 
  geom_histogram(binwidth = .1, 
                 center = 0.05, 
                 position = "dodge")

Introduktion till datavisualisering med ggplot2

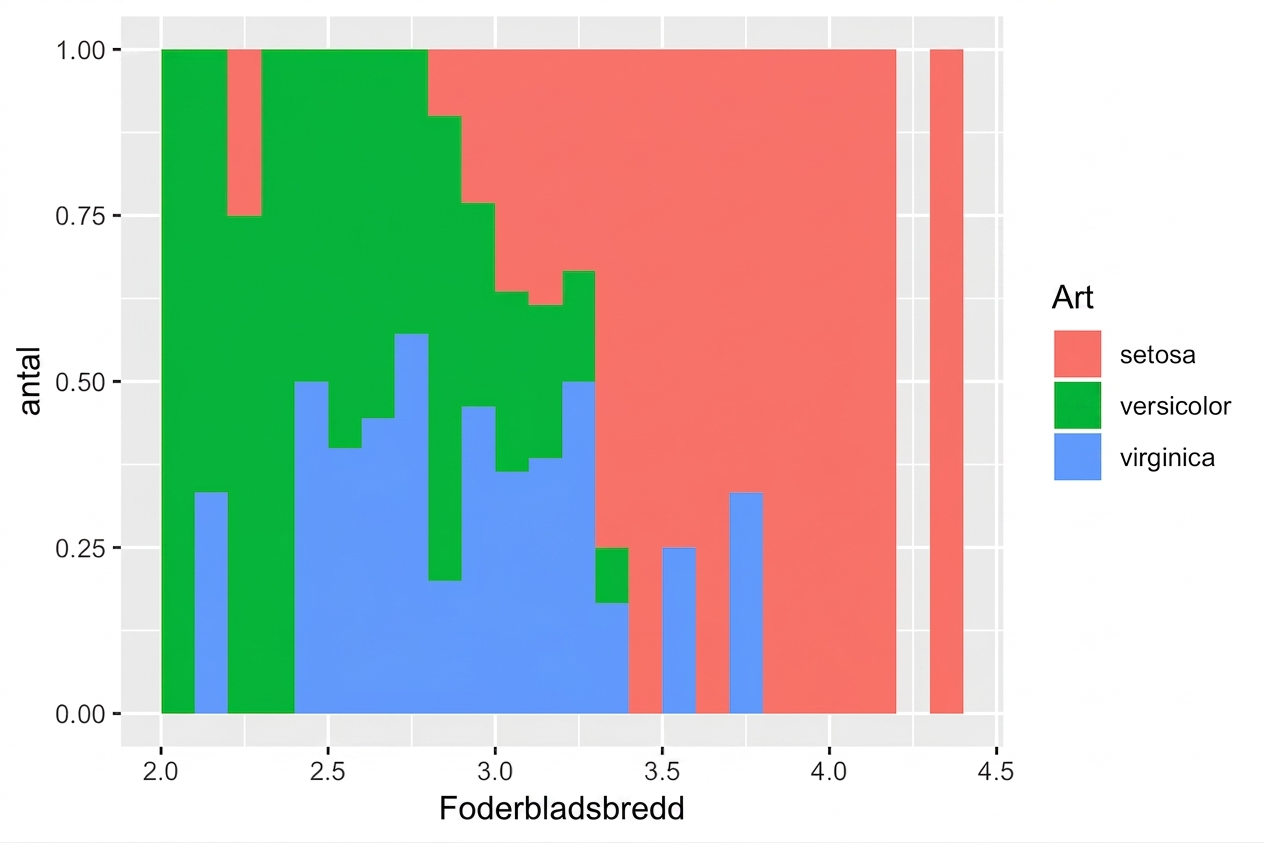
position = "fill"

ggplot(iris, aes(x = Sepal.Width, 
                 fill = Species)) + 
  geom_histogram(binwidth = .1, 
                 center = 0.05, 
                 position = "fill")  

Introduktion till datavisualisering med ggplot2

Nu kör vi en övning!

Introduktion till datavisualisering med ggplot2

Preparing Video For Download...