Graphiques de base avec Matplotlib
Python intermédiaire

Hugo Bowne-Anderson
Data Scientist at DataCamp
Graphiques de base avec Matplotlib
- Visualisation

- Structure des données

- Structures de contrôle

- Étude de cas

Visualisation de données
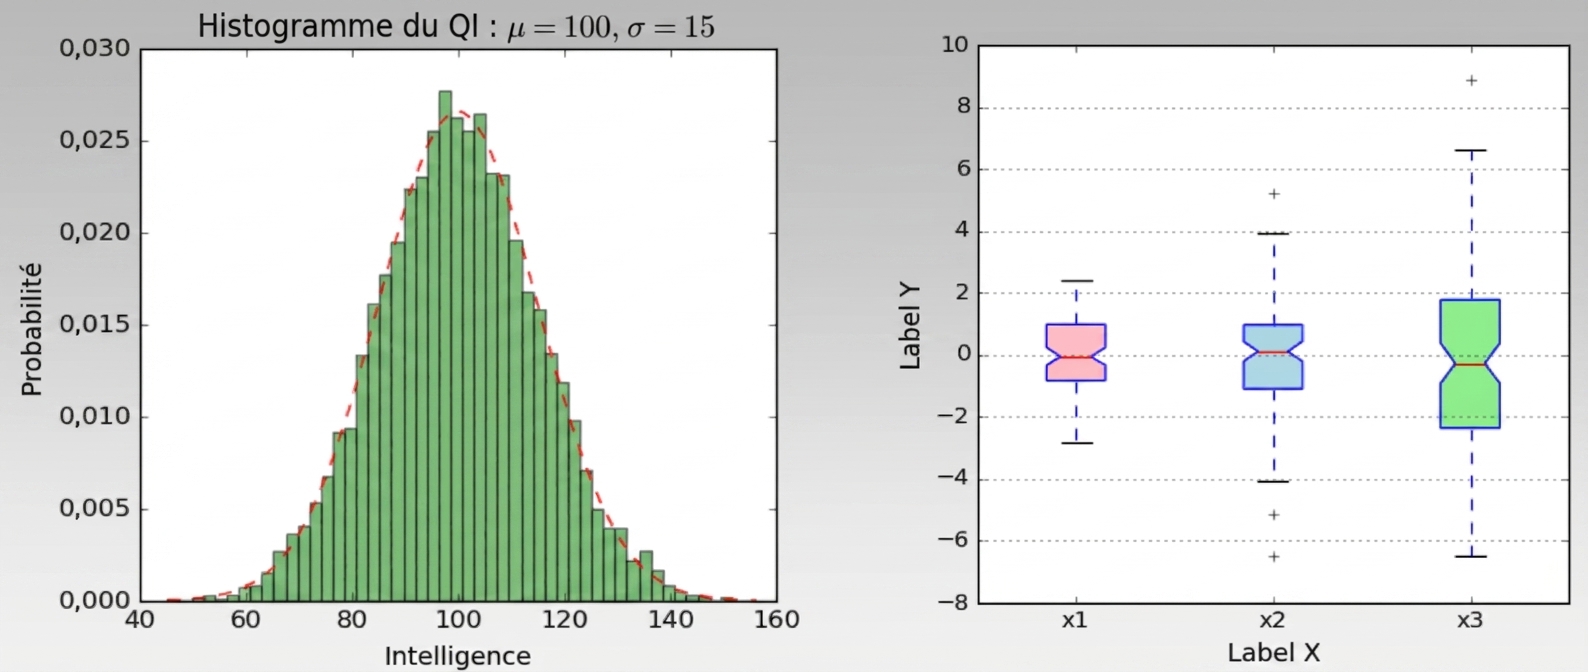
Indispensable en analyse de données
- Explorer les données
- Présenter les constats
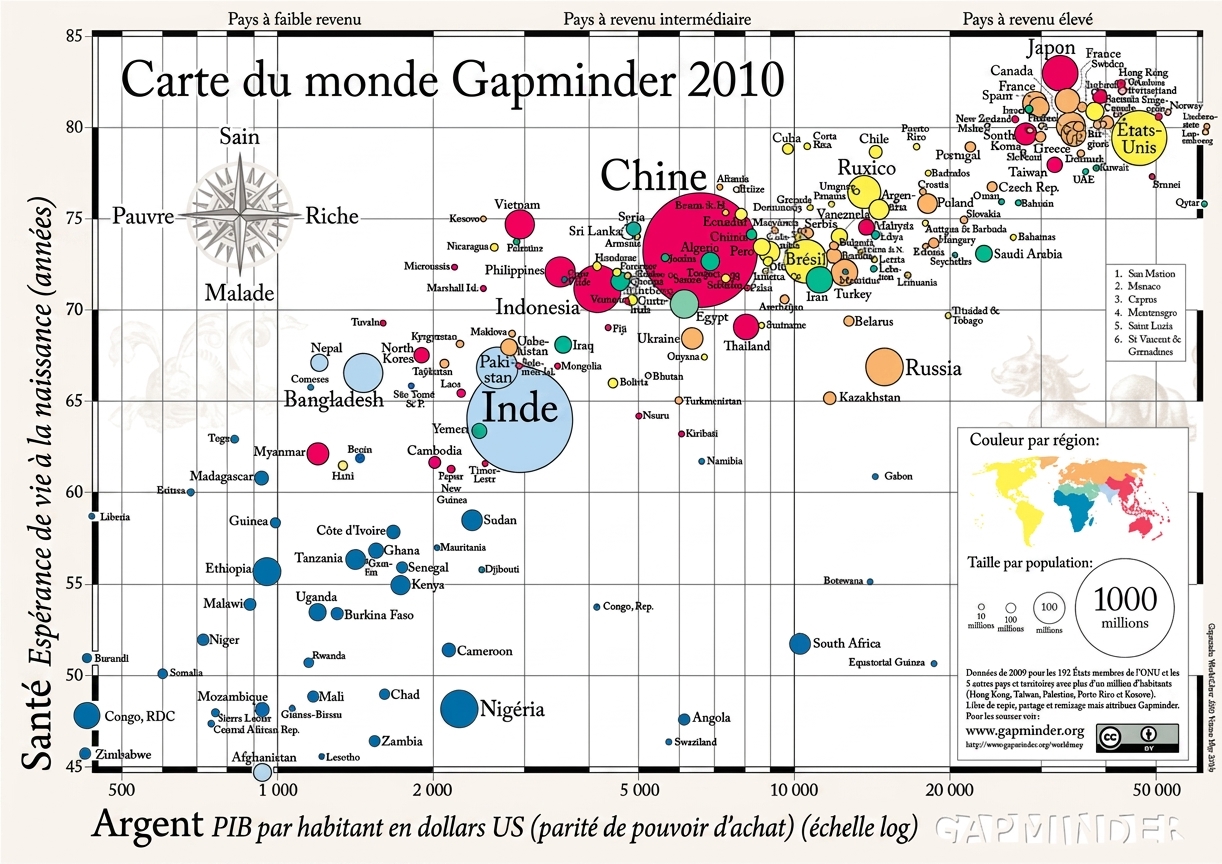
1 Source : GapMinder, Wealth and Health of Nations
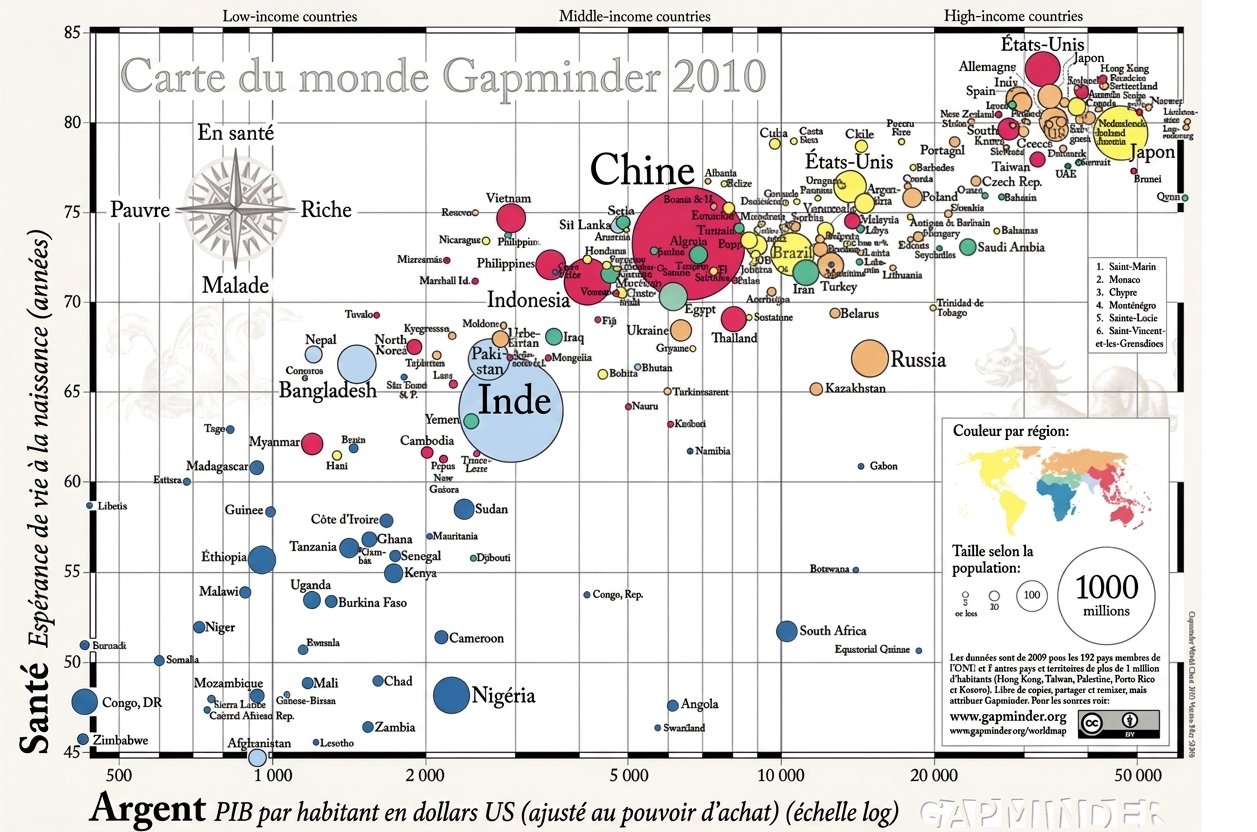
1 Source : GapMinder, Wealth and Health of Nations
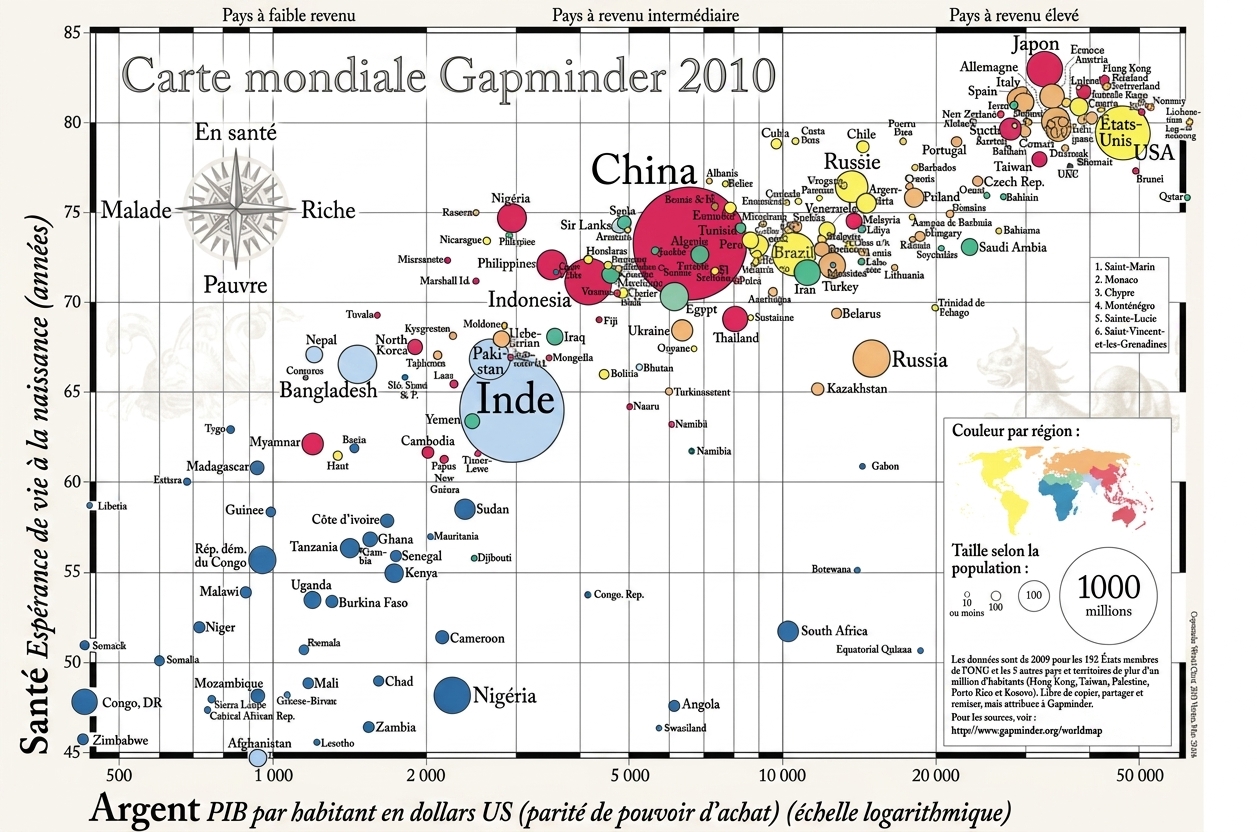
1 Source : GapMinder, Wealth and Health of Nations
Matplotlib
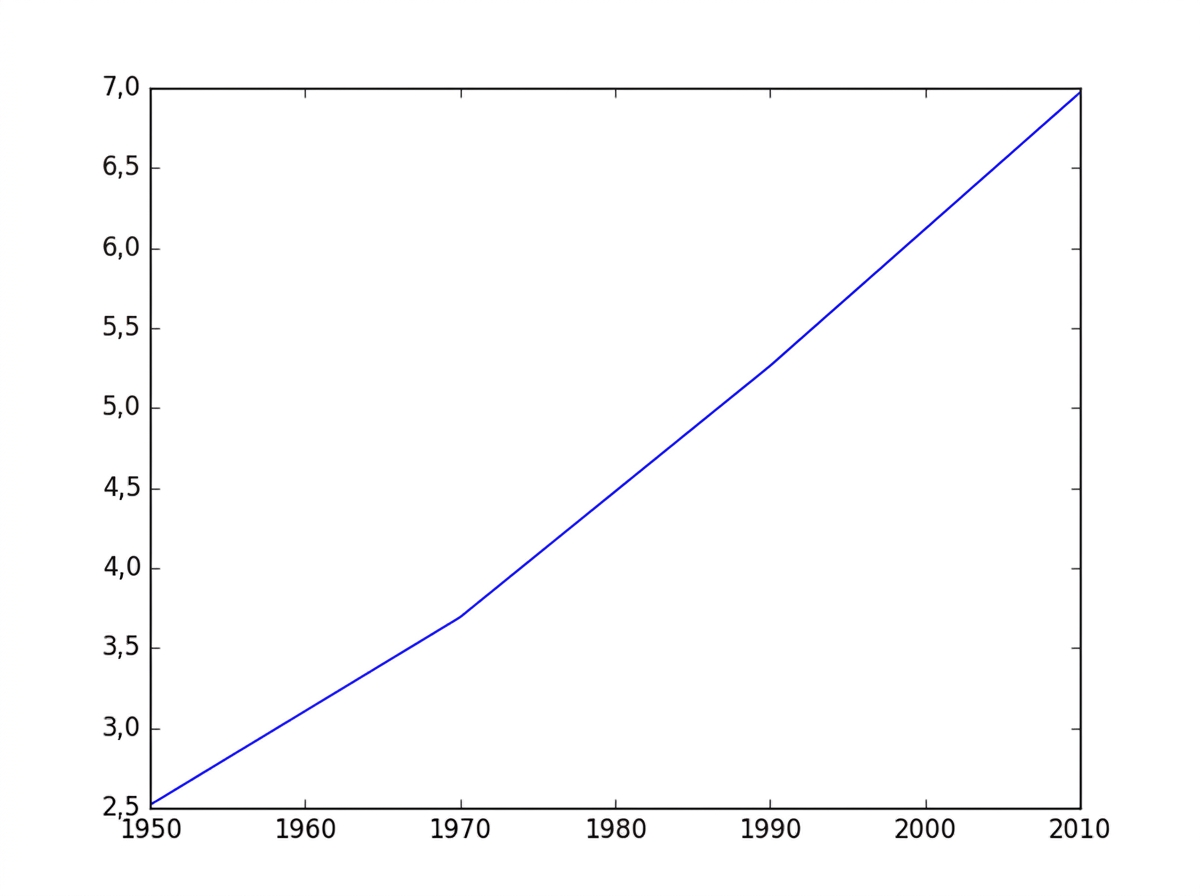
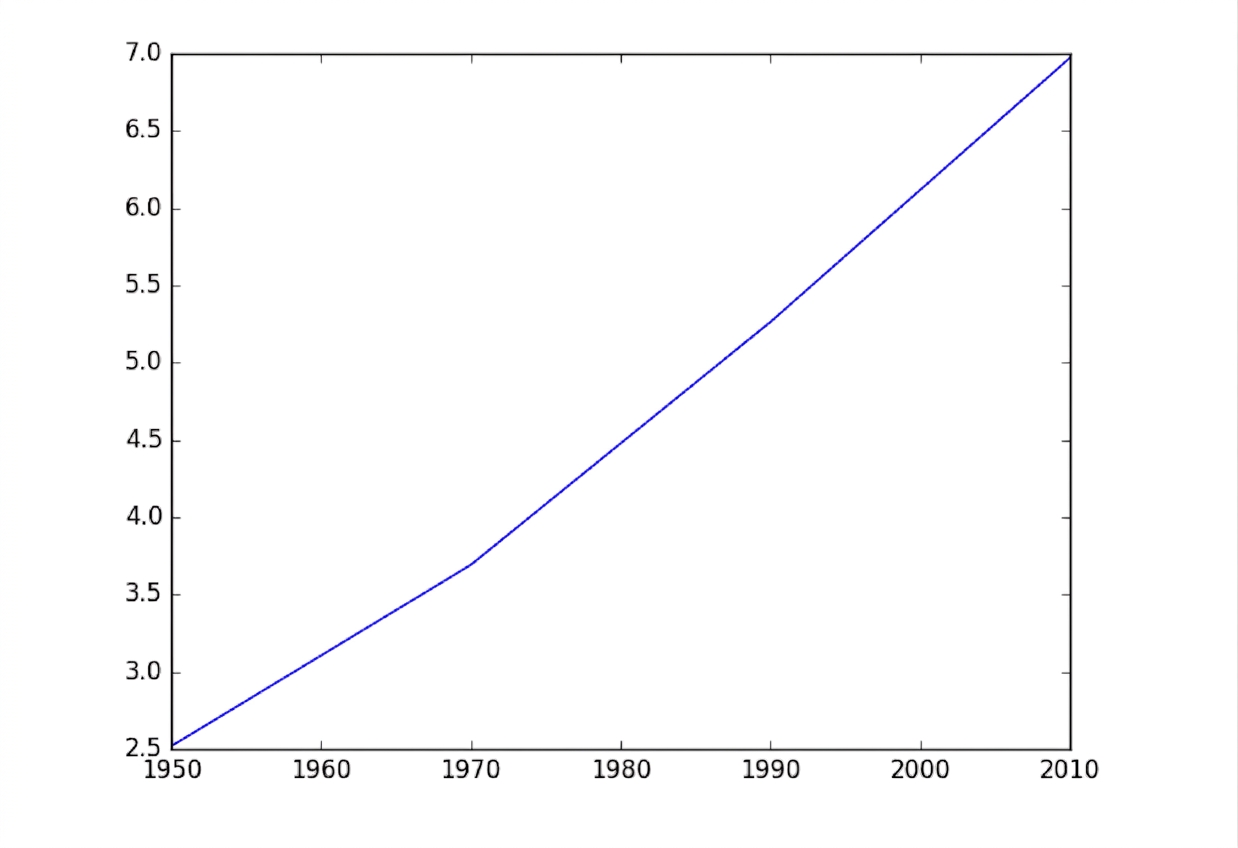
import matplotlib.pyplot as pltyear = [1950, 1970, 1990, 2010]pop = [2.519, 3.692, 5.263, 6.972]plt.plot(year, pop)plt.show()
Matplotlib
Matplotlib

Nuage de points
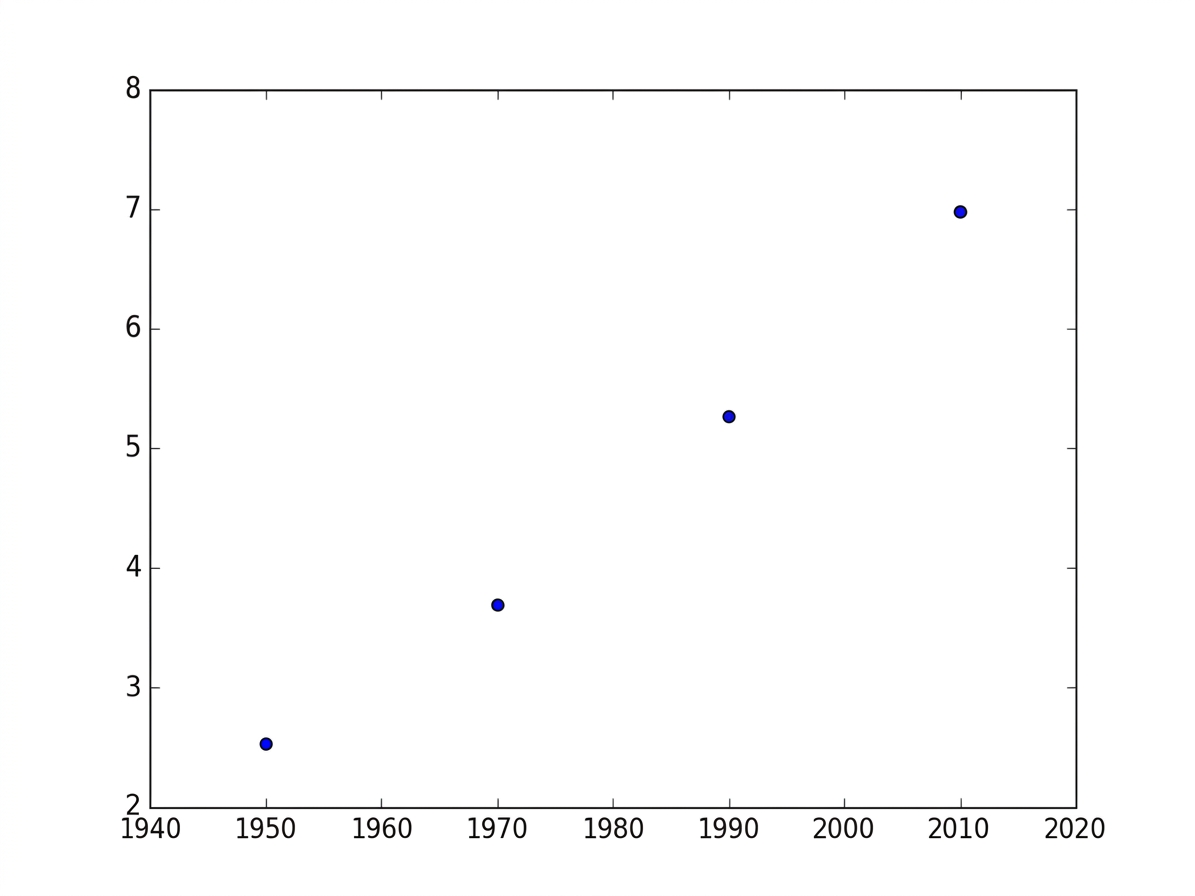
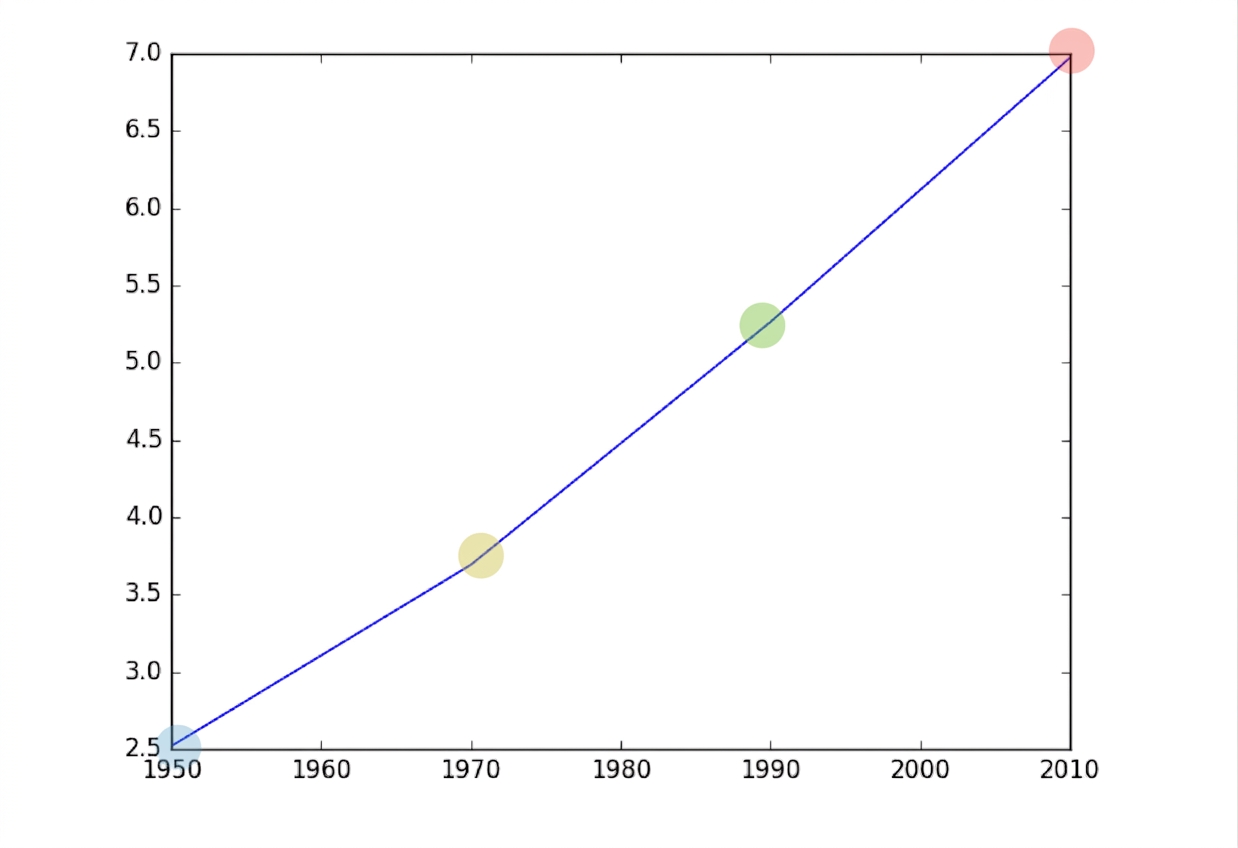
import matplotlib.pyplot as plt
year = [1950, 1970, 1990, 2010]
pop = [2.519, 3.692, 5.263, 6.972]
plt.scatter(year, pop)
plt.show()