Utiliser les attributs

Introduction à la visualisation de données avec ggplot2

Rick Scavetta

Founder, Scavetta Academy

Esthétiques ? Attributs !
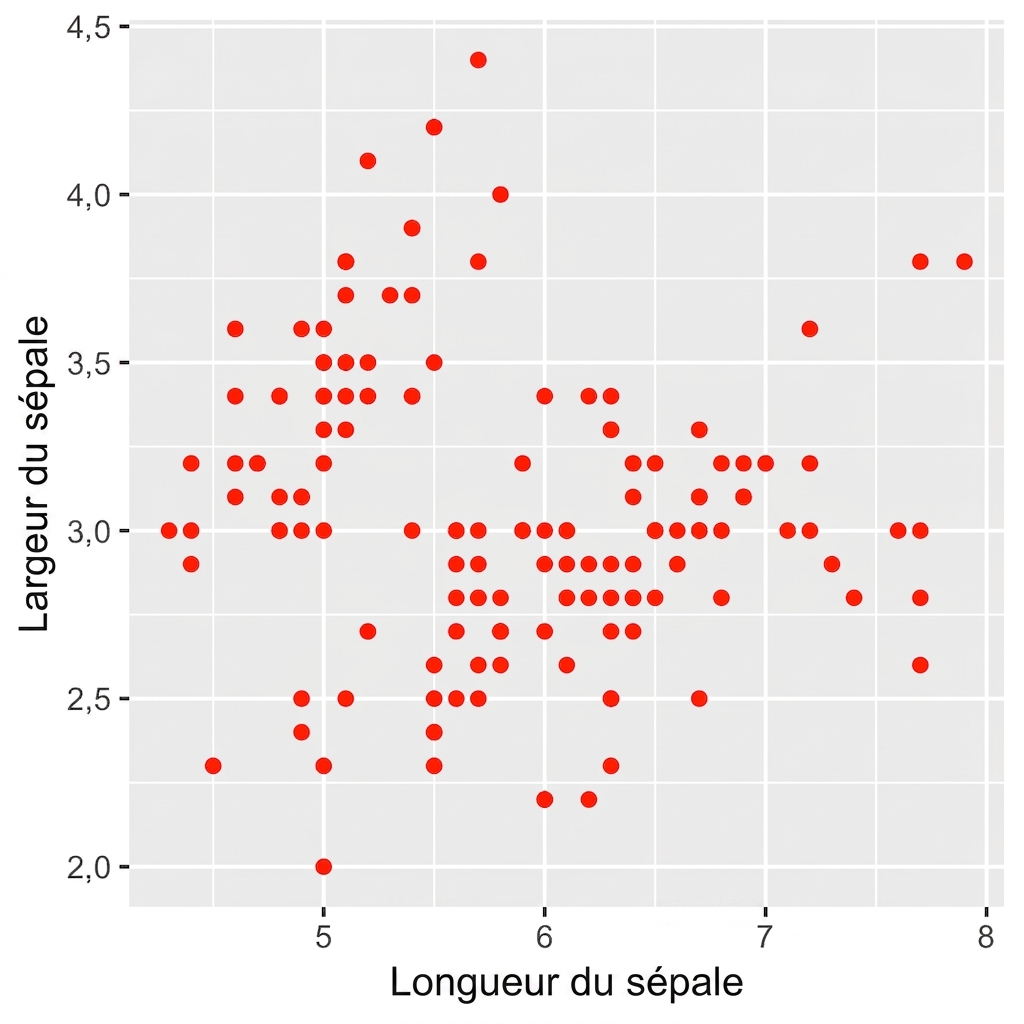
ggplot(iris, aes(x = Sepal.Length, 
                 y = Sepal.Width)) + 
  geom_point(color = "red")
Type Propriété
Couleur "red"

Définissez les attributs dans geom_*().

L'attribut color est défini à "red".

Introduction à la visualisation de données avec ggplot2

Esthétiques ? Attributs !

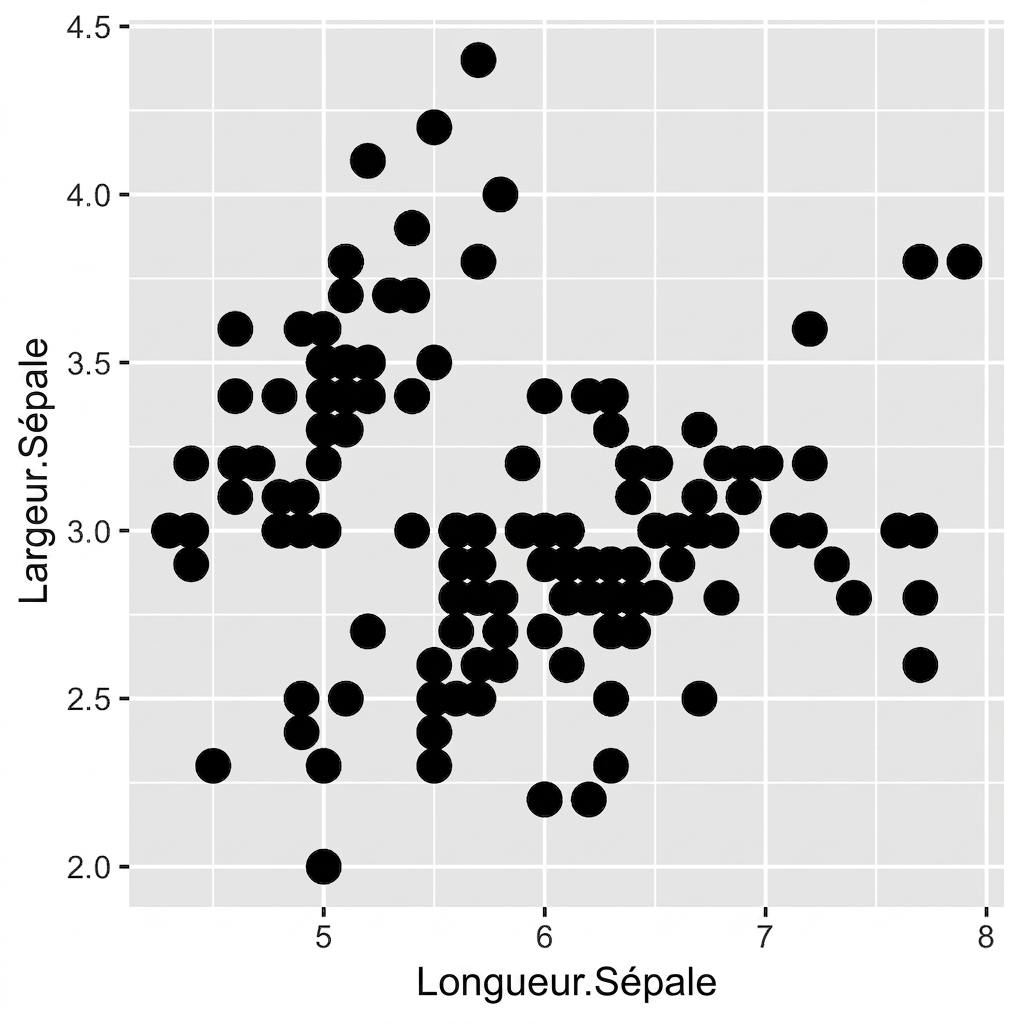
ggplot(iris, aes(x = Sepal.Length, 
                 y = Sepal.Width)) + 
  geom_point(size = 10)
Type Propriété
Taille 4

Introduction à la visualisation de données avec ggplot2

Esthétiques ? Attributs !

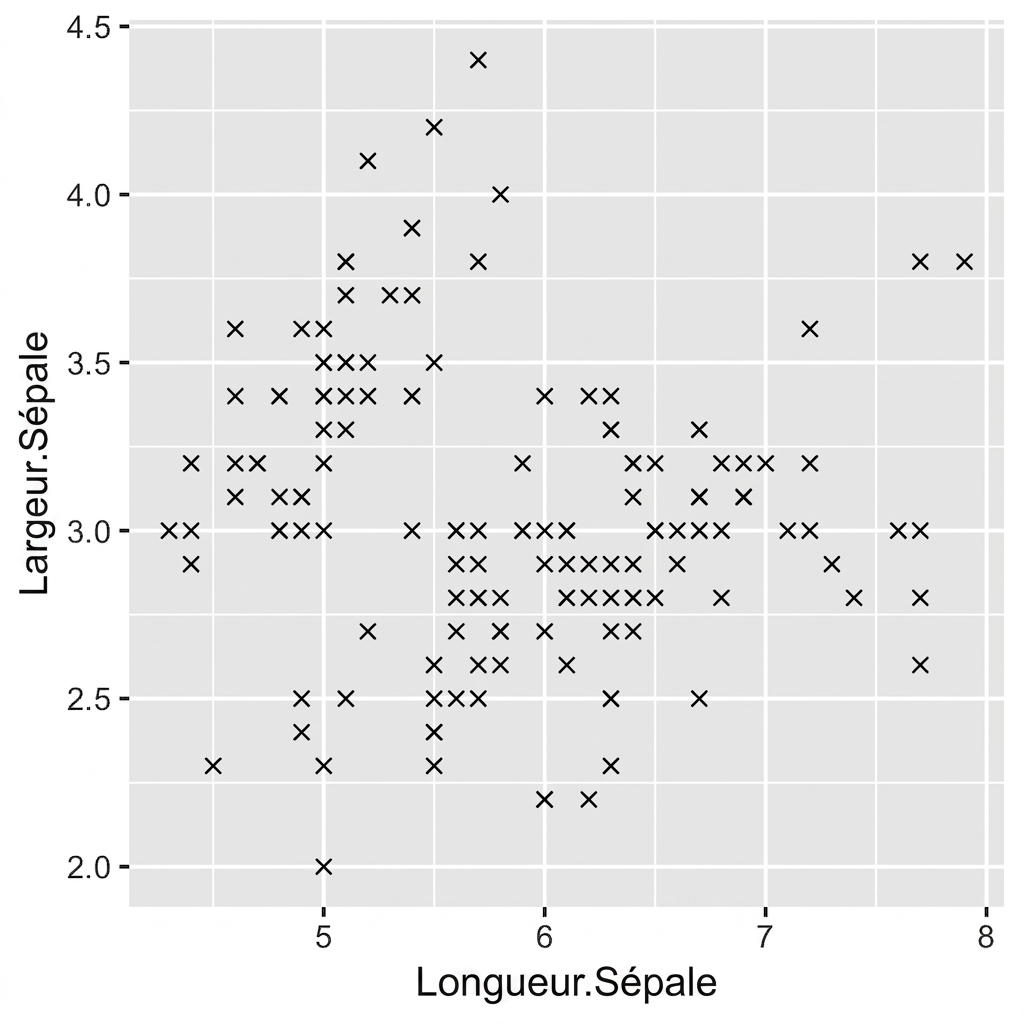
ggplot(iris, aes(x = Sepal.Length, 
                 y = Sepal.Width)) + 
  geom_point(shape = 4)
Type Propriété
Forme 4

Introduction à la visualisation de données avec ggplot2

Passons à la pratique !

Introduction à la visualisation de données avec ggplot2

Preparing Video For Download...