Thèmes à partir de zéro

Introduction à la visualisation de données avec ggplot2

Rick Scavetta

Founder, Scavetta Academy

La couche des thèmes

  • Toute l'encre hors données
  • Éléments visuels qui ne font pas partie des données
Introduction à la visualisation de données avec ggplot2

La couche des thèmes

  • Toute l'encre hors données
  • Éléments visuels qui ne font pas partie des données

Trois types

type
texte
ligne
rectangle
Introduction à la visualisation de données avec ggplot2

La couche des thèmes

  • Toute l'encre hors données
  • Éléments visuels qui ne font pas partie des données

Trois types

type modifié avec
texte element_text()
ligne element_line()
rectangle element_rect()
Introduction à la visualisation de données avec ggplot2

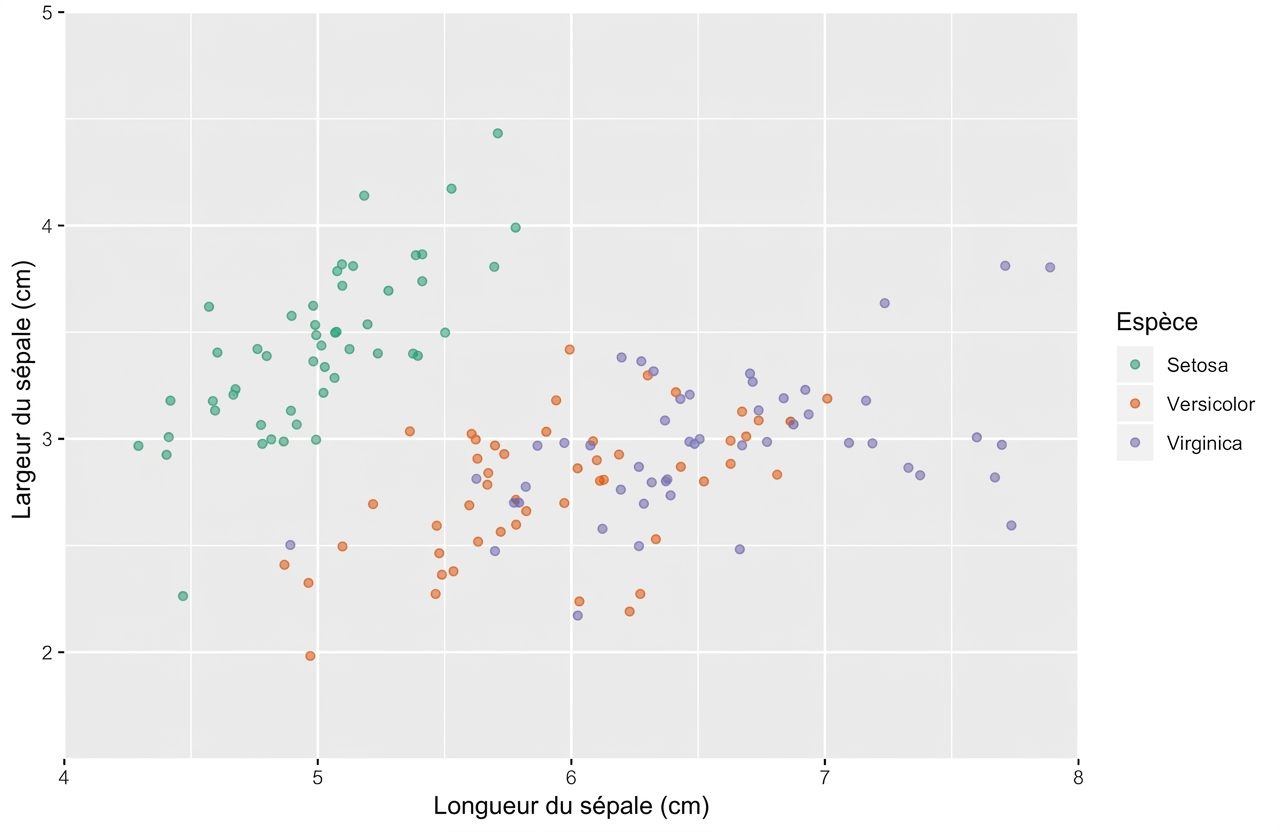
Un graphique de départ…

ggplot(iris, aes(x = Sepal.Length, y = Sepal.Width, color = Species)) + 
  geom_jitter(alpha = 0.6)
Introduction à la visualisation de données avec ggplot2

Les éléments de texte


text
  axis.title 
    axis.title.x
      axis.title.x.top
      axis.title.x.bottom 
    axis.title.y
      axis.title.y.left
      axis.title.y.right 
  title 
    legend.title 
    plot.title
    plot.subtitle 
    plot.caption 
    plot.tag
  axis.text 
    axis.text.x 
      axis.text.x.top
      axis.text.x.bottom 
    axis.text.y
      axis.text.y.left
      axis.text.y.right
  legend.text
  strip.text
    strip.text.x
    strip.text.y
Introduction à la visualisation de données avec ggplot2

Les éléments de texte

theme(
text, 
  axis.title, 
    axis.title.x,
      axis.title.x.top, 
      axis.title.x.bottom, 
    axis.title.y, 
      axis.title.y.left,
      axis.title.y.right, 
  title, 
    legend.title, 
    plot.title,
    plot.subtitle, 
    plot.caption, 
    plot.tag, 
  axis.text, 
    axis.text.x, 
      axis.text.x.top,
      axis.text.x.bottom, 
    axis.text.y, 
      axis.text.y.left, 
      axis.text.y.right,
  legend.text,
  strip.text, 
    strip.text.x, 
    strip.text.y)
Introduction à la visualisation de données avec ggplot2

Ajuster les éléments du thème

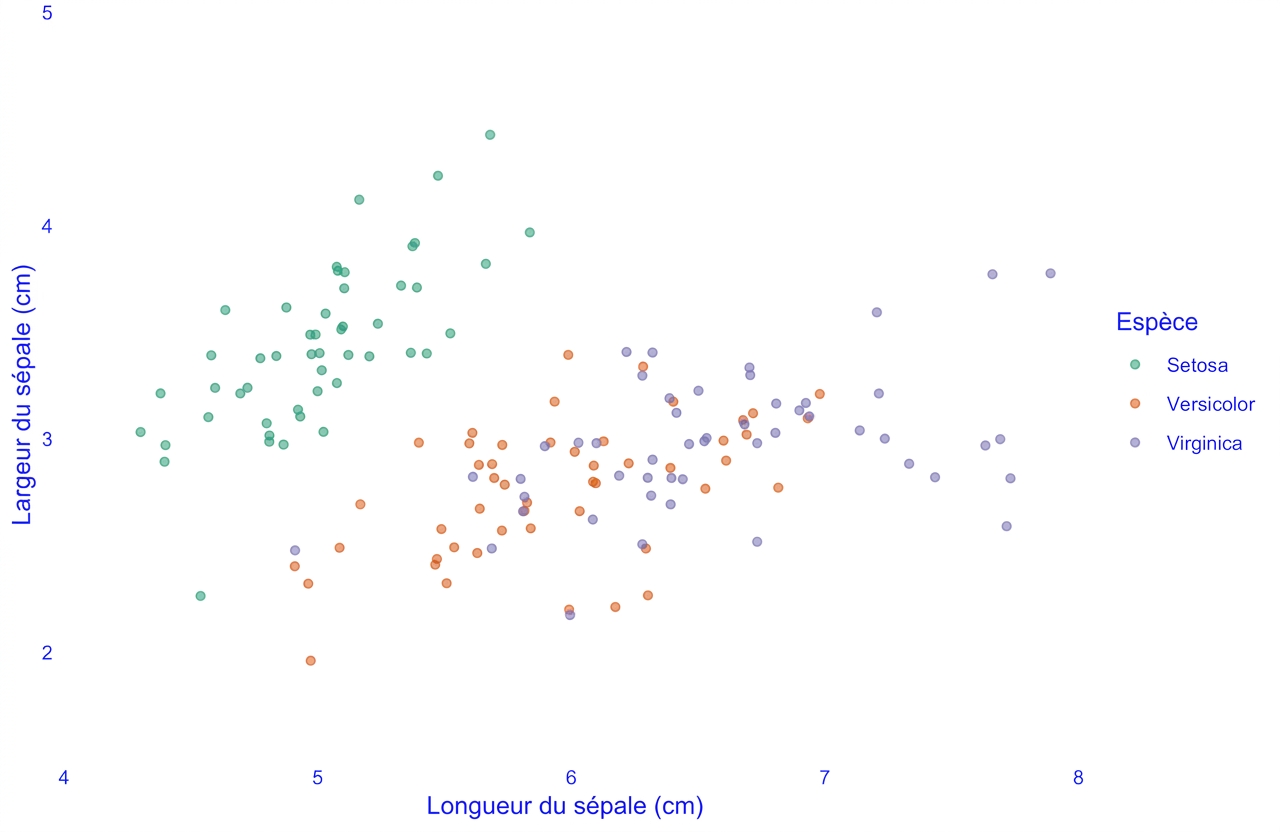
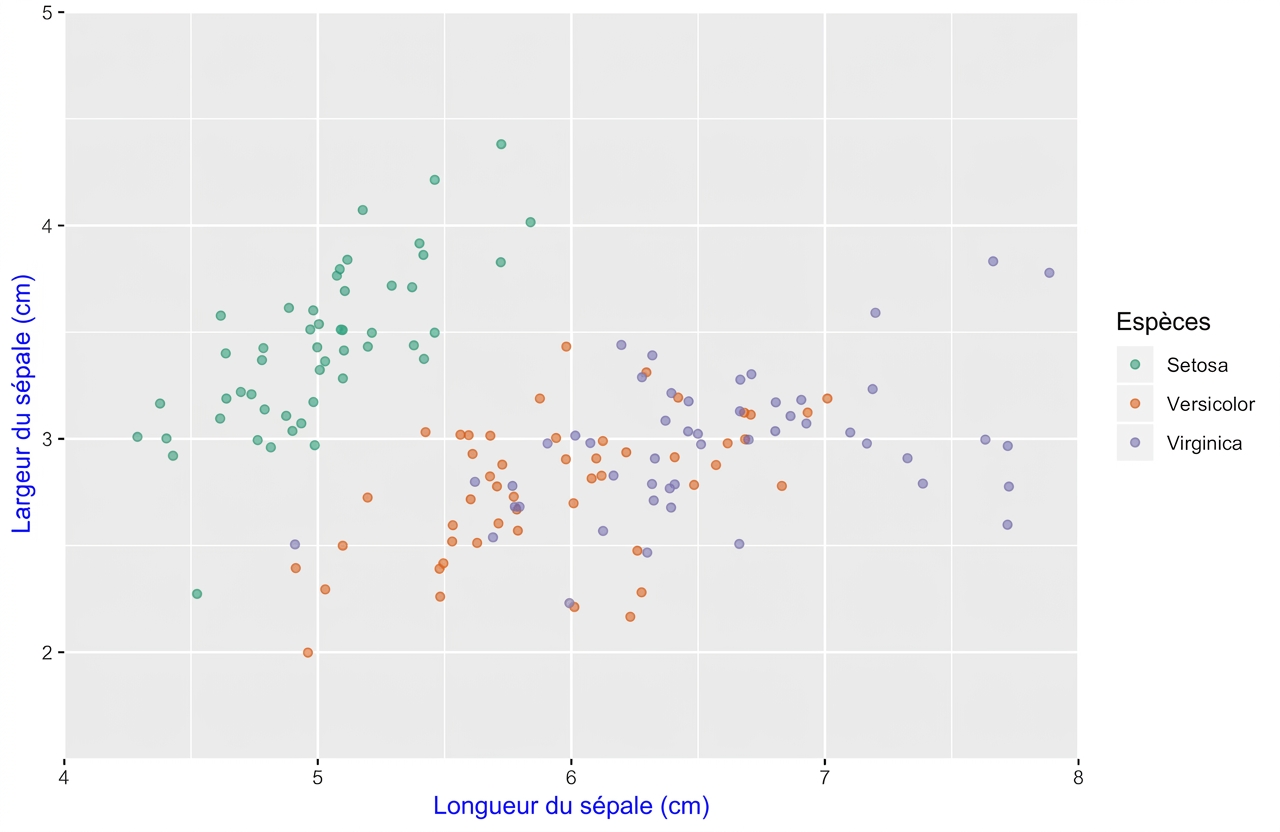
ggplot(iris, aes(x = Sepal.Length, y = Sepal.Width, color = Species)) + 
  geom_jitter(alpha = 0.6) +
  theme(axis.title = element_text(color = "blue"))
Introduction à la visualisation de données avec ggplot2

Un graphique de départ…

ggplot(iris, aes(x = Sepal.Length, y = Sepal.Width, color = Species)) + 
  geom_jitter(alpha = 0.6)

Introduction à la visualisation de données avec ggplot2

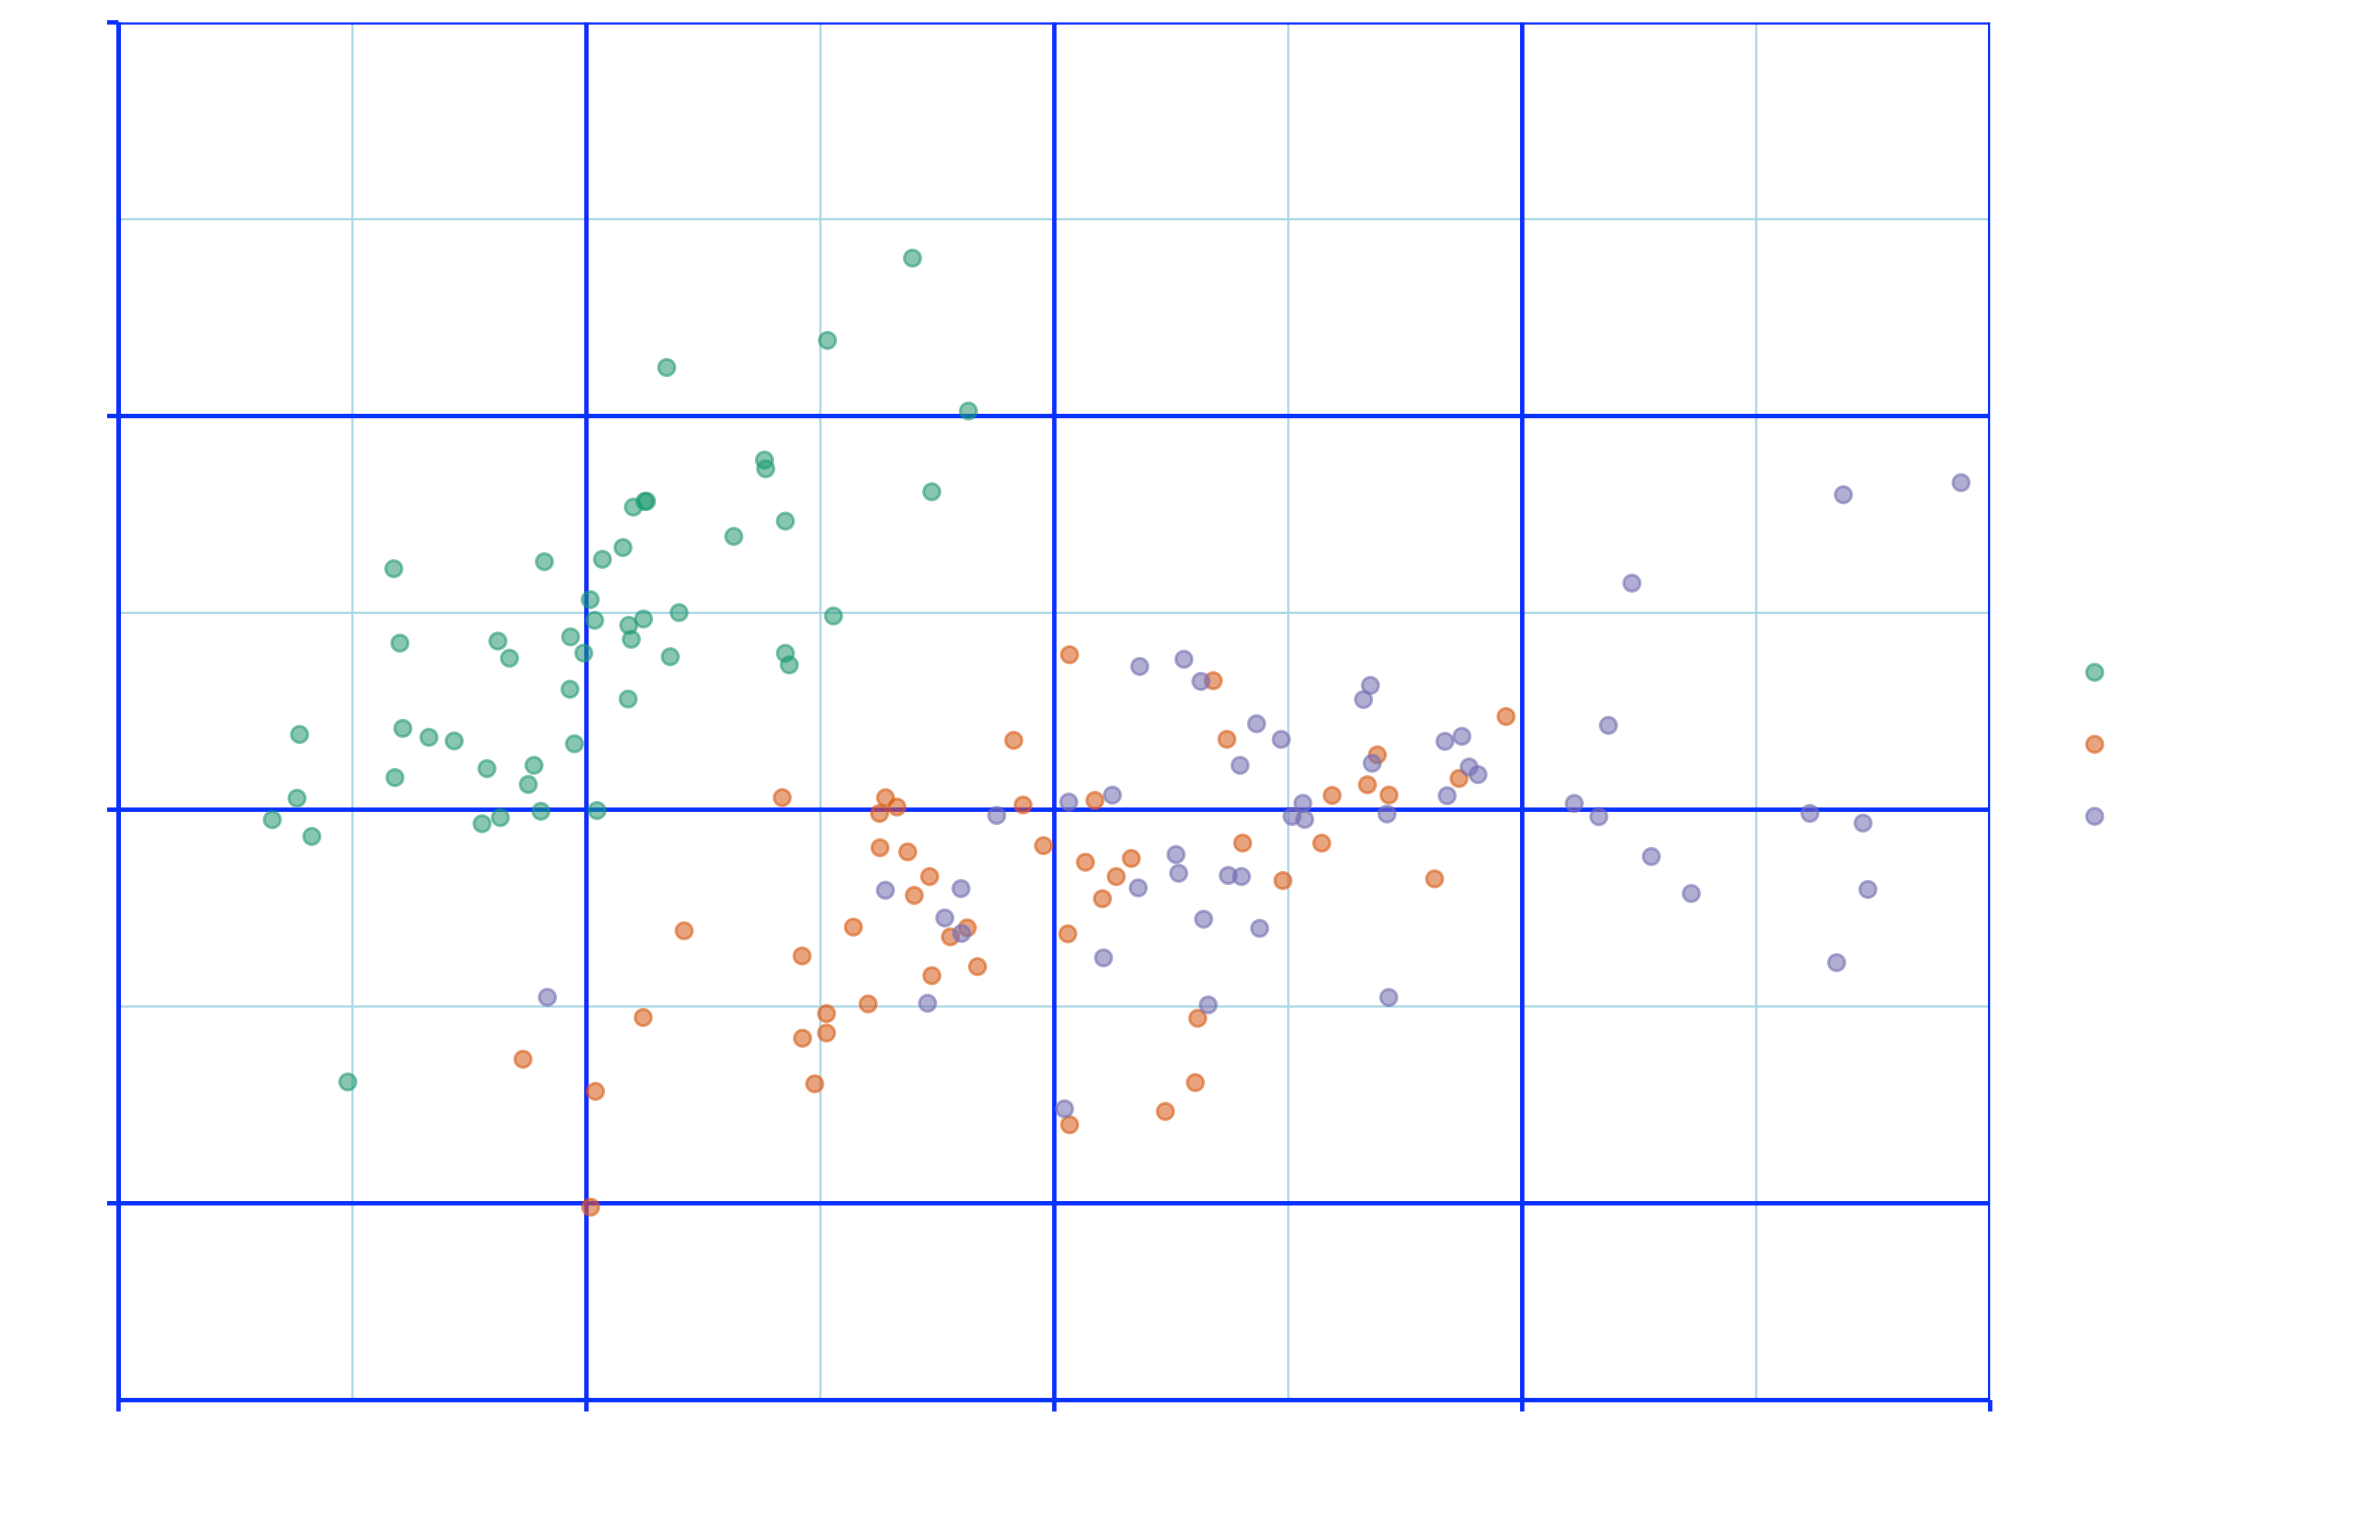
Éléments de ligne

theme(
line,
  axis.ticks,
    axis.ticks.x, 
      axis.ticks.x.top,
      axis.ticks.x.bottom,
    axis.ticks.y,
      axis.ticks.y.left, 
      axis.ticks.y.right,
    axis.line,
      axis.line.x, 
        axis.line.x.top,
        axis.line.x.bottom, 
      axis.line.y,
        axis.line.y.left, 
        axis.line.y.right, 
  panel.grid,
    panel.grid.major, 
      panel.grid.major.x, 
      panel.grid.major.y, 
    panel.grid.minor,
      panel.grid.minor.x,
      panel.grid.minor.y)
Introduction à la visualisation de données avec ggplot2

Un graphique de départ…

ggplot(iris, aes(x = Sepal.Length, y = Sepal.Width, color = Species)) + 
  geom_jitter(alpha = 0.6)

Introduction à la visualisation de données avec ggplot2

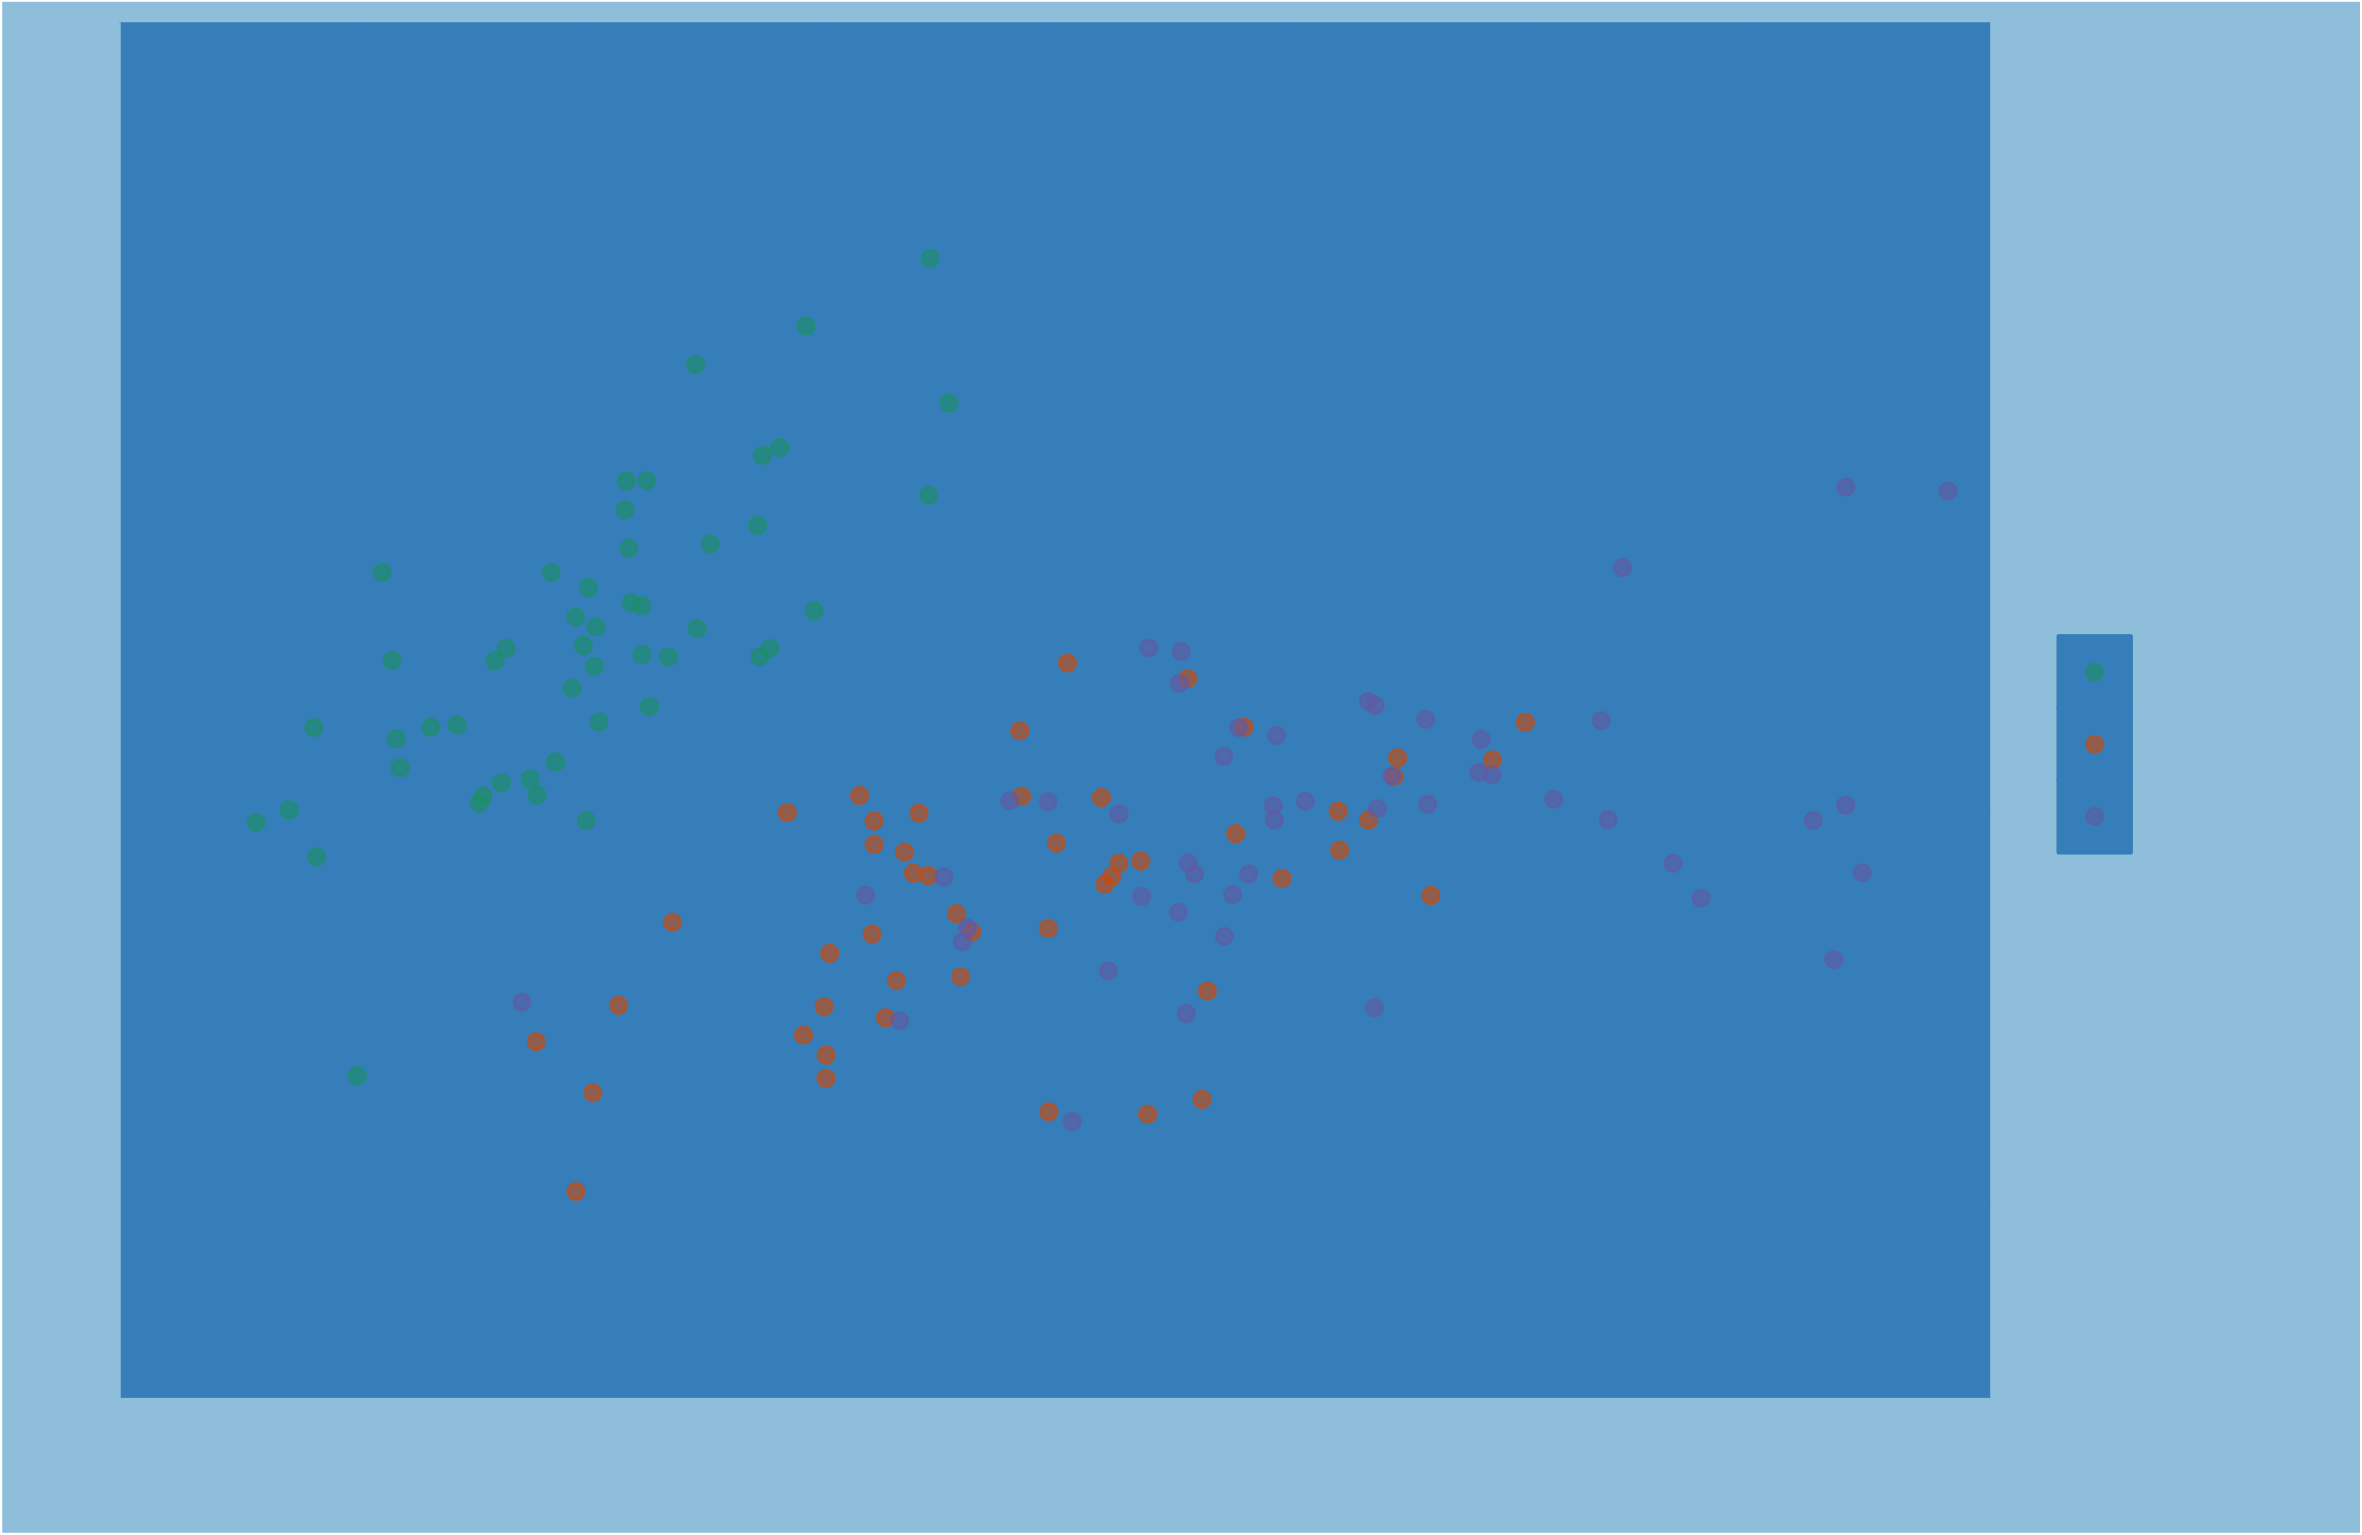
Éléments rectangulaires

theme(
rect,
  legend.background, 
  legend.key,
  legend.box.background, 
  panel.background,
  panel.border,
  plot.background, 
  strip.background, 
    strip.background.x, 
    strip.background.y)
Introduction à la visualisation de données avec ggplot2

La dénomination hiérarchique reflète l'héritage

p. ex. Texte

text
  axis.title 
    axis.title.x
      axis.title.x.top
      axis.title.x.bottom 
    axis.title.y
      axis.title.y.left
      axis.title.y.right 

p. ex. Lignes

line
  axis.ticks
    axis.ticks.x 
      axis.ticks.x.top
      axis.ticks.x.bottom
    axis.ticks.y
      axis.ticks.y.left,
      axis.ticks.y.right
    axis.line
      axis.line.x 
        axis.line.x.top
        axis.line.x.bottom
      axis.line.y
        axis.line.y.left 
        axis.line.y.right
Introduction à la visualisation de données avec ggplot2

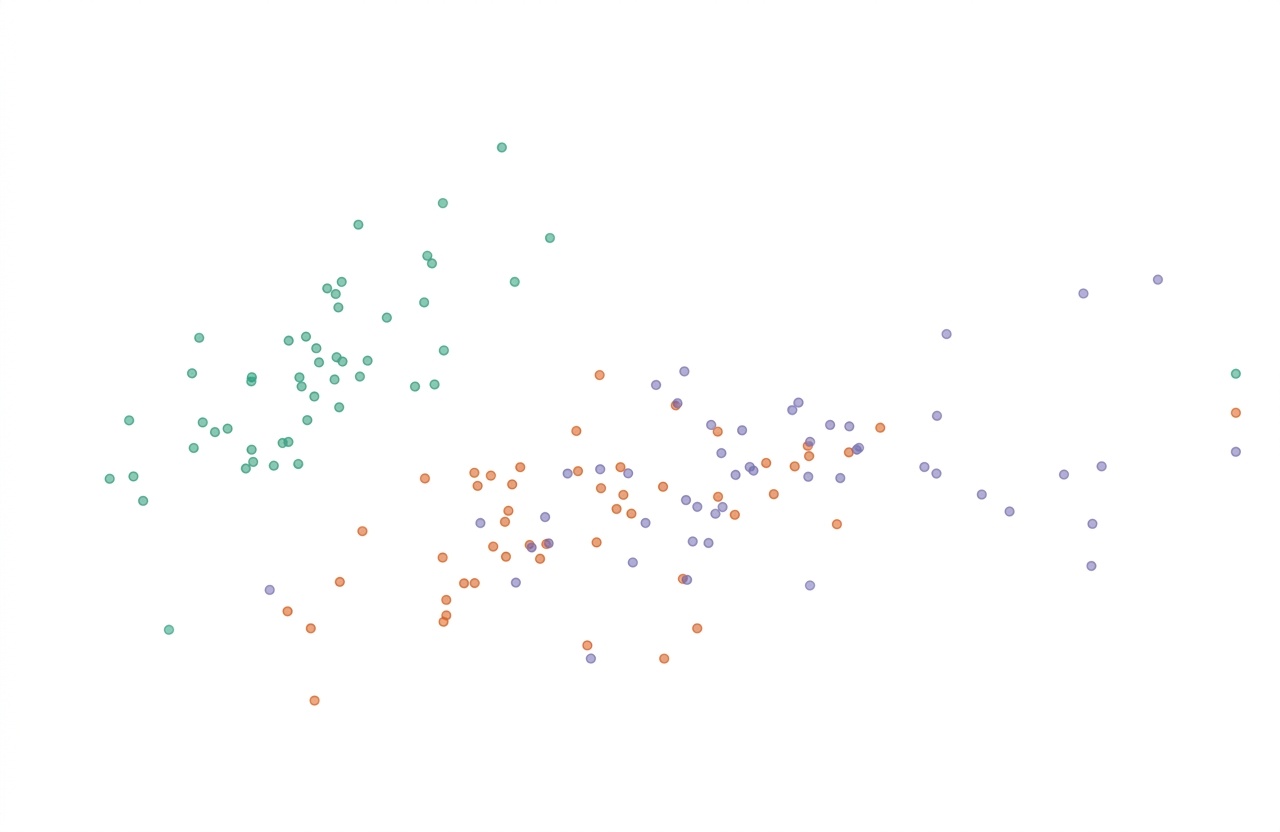
element_blank()

ggplot(iris, aes(x = Sepal.Length, y = Sepal.Width, color = Species)) + 
  geom_jitter(alpha = 0.6) + 
  theme(line = element_blank(),
        rect = element_blank(),
        text = element_blank())
Introduction à la visualisation de données avec ggplot2

Passons à la pratique !

Introduction à la visualisation de données avec ggplot2

Preparing Video For Download...