Le théorème central limite
Introduction aux statistiques

George Boorman
Curriculum Manager, DataCamp
Lancer un dé cinq fois

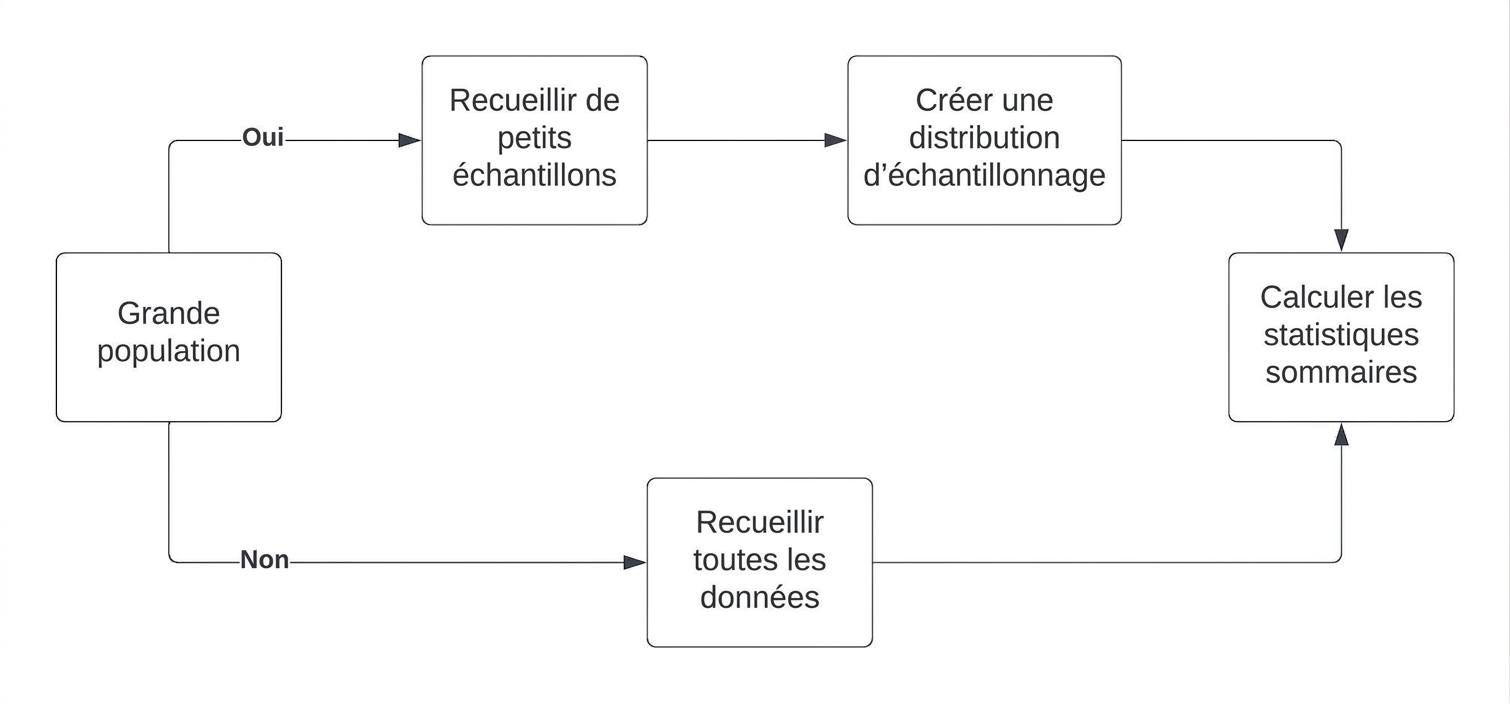
Distributions d'échantillonnage
Distribution d'échantillonnage de la moyenne d'échantillon
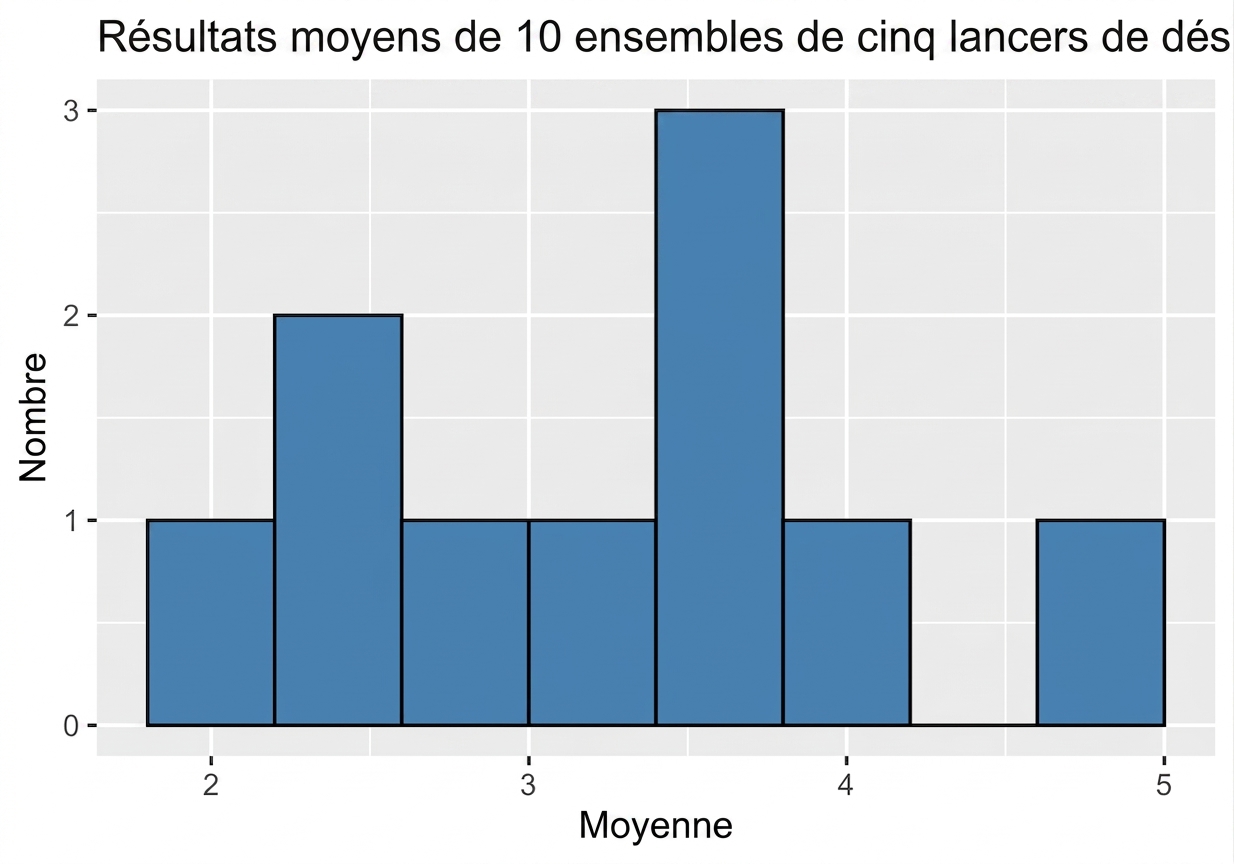
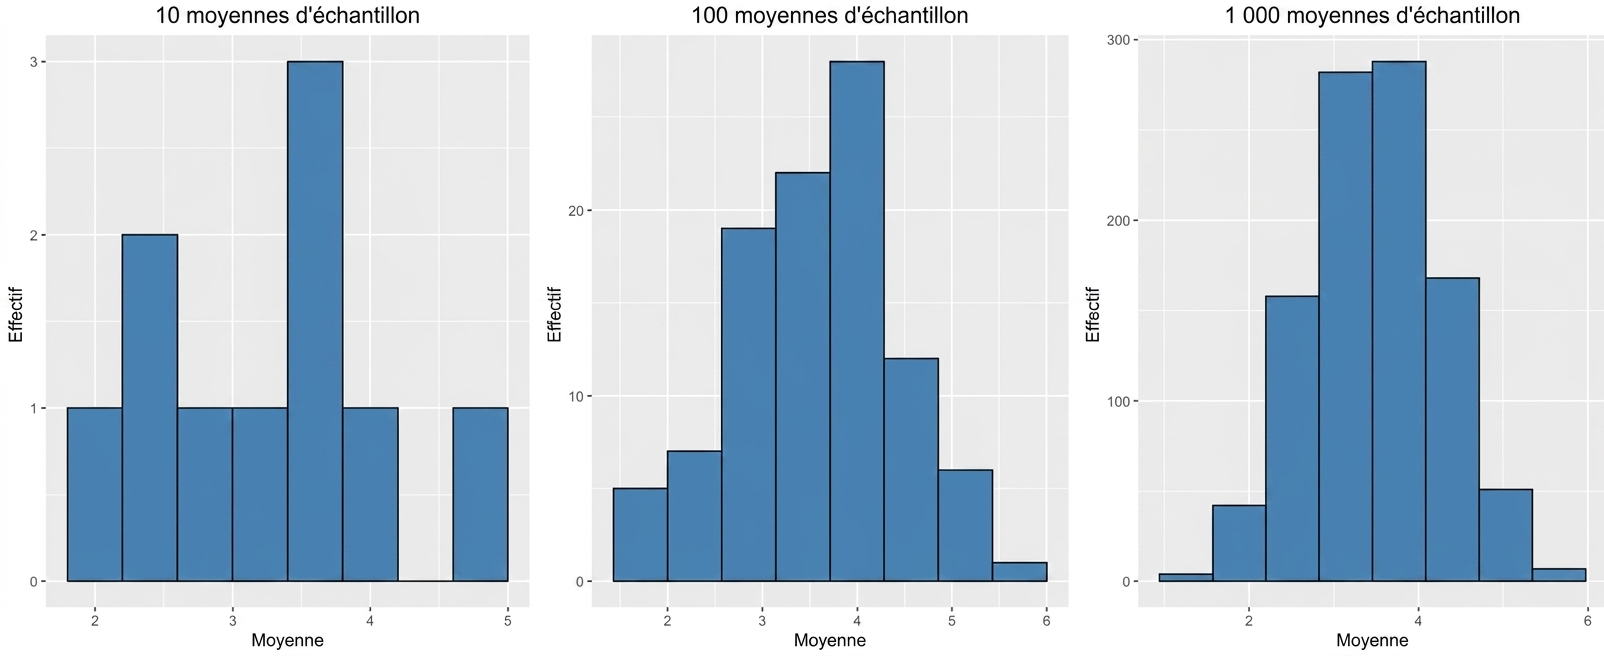
100 moyennes d'échantillon
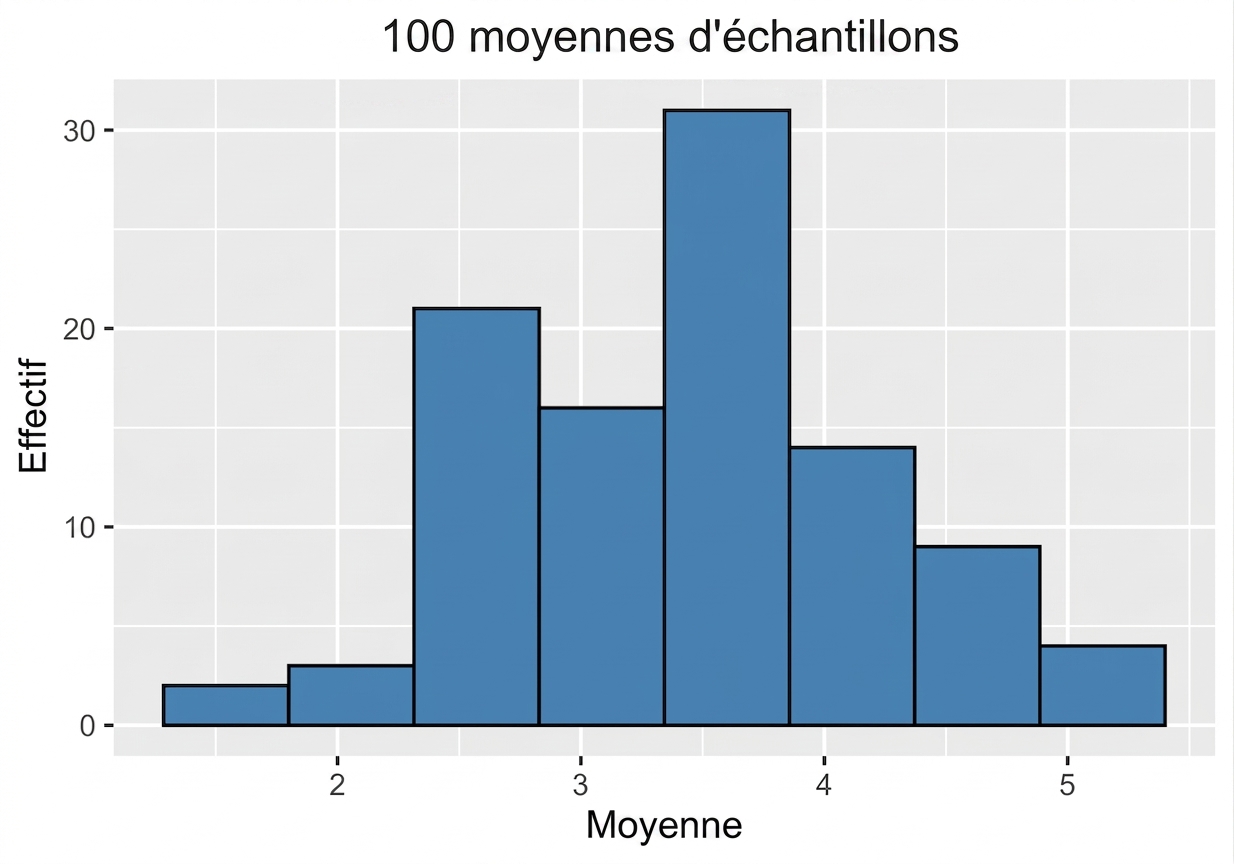
1000 moyennes d'échantillon
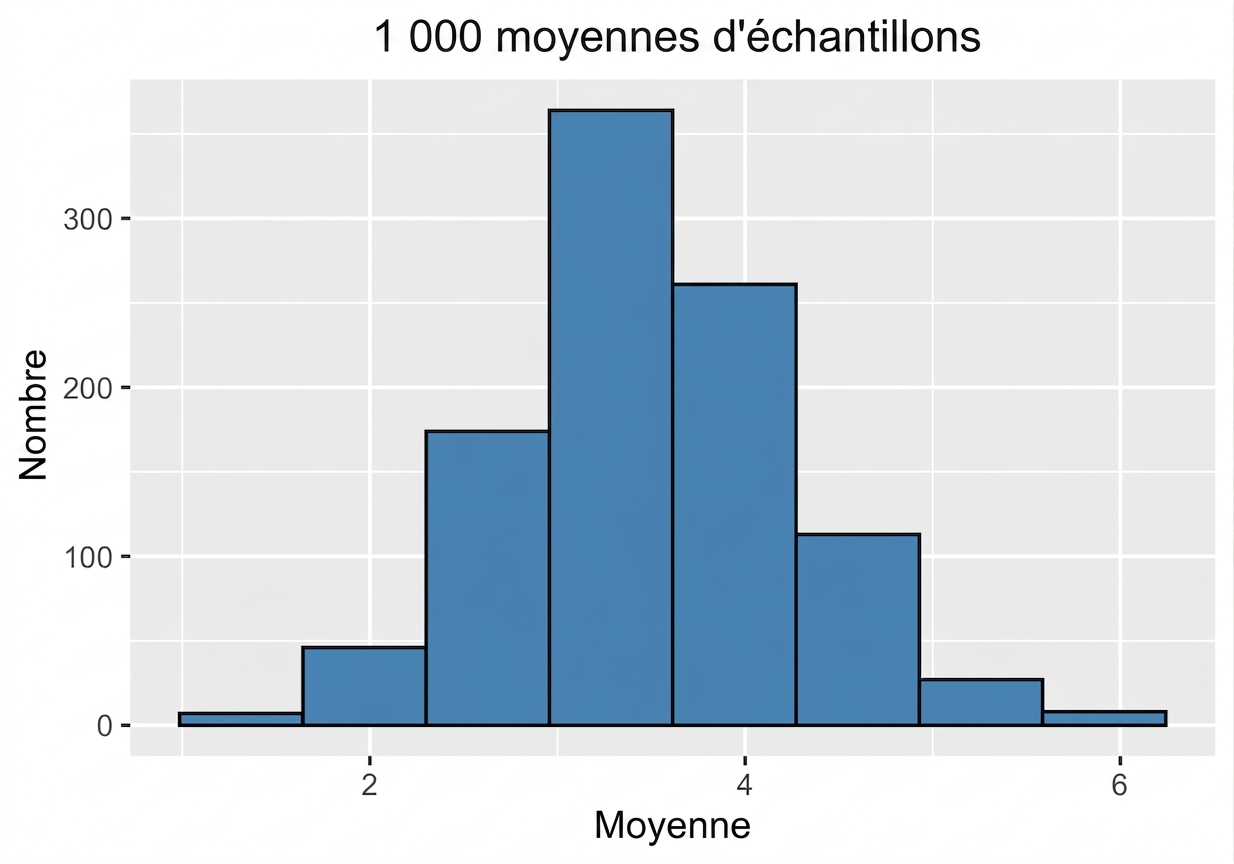
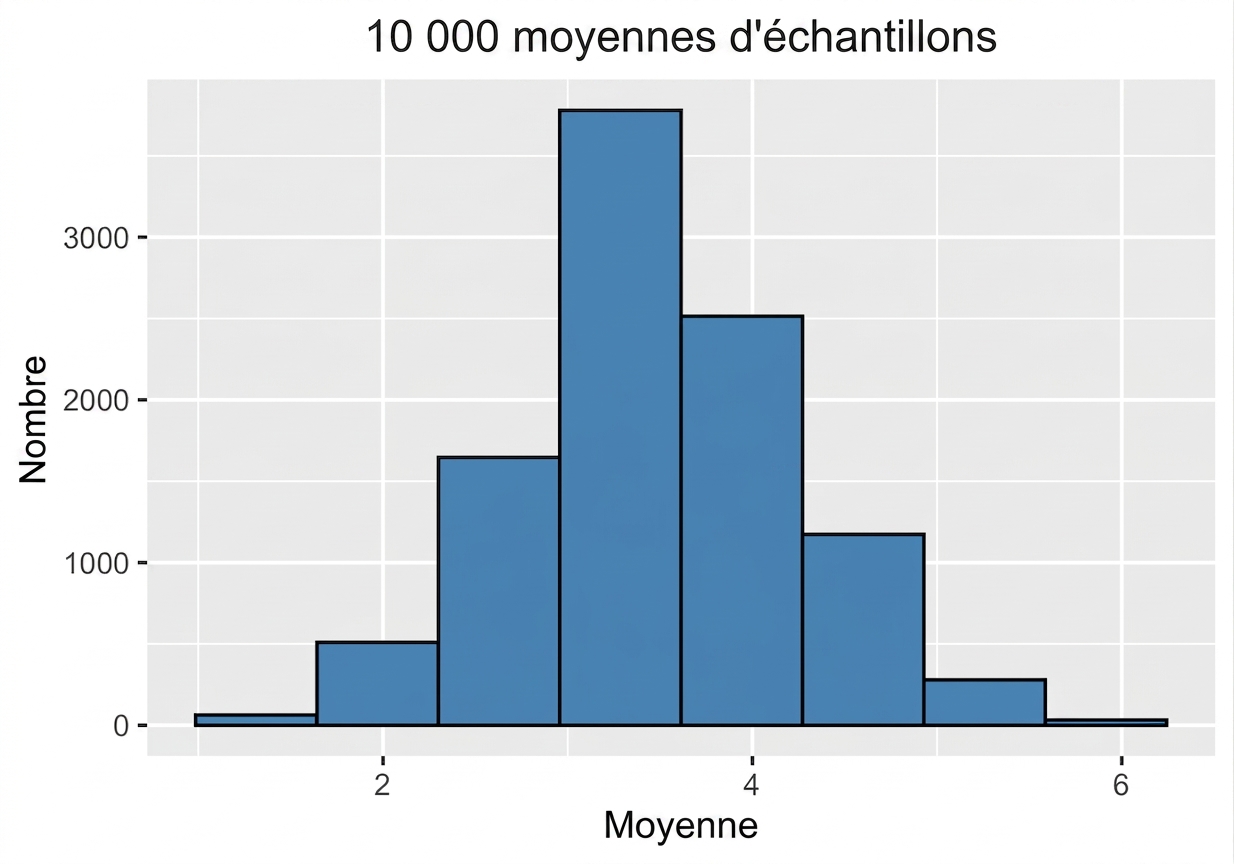
10000 moyennes d'échantillon
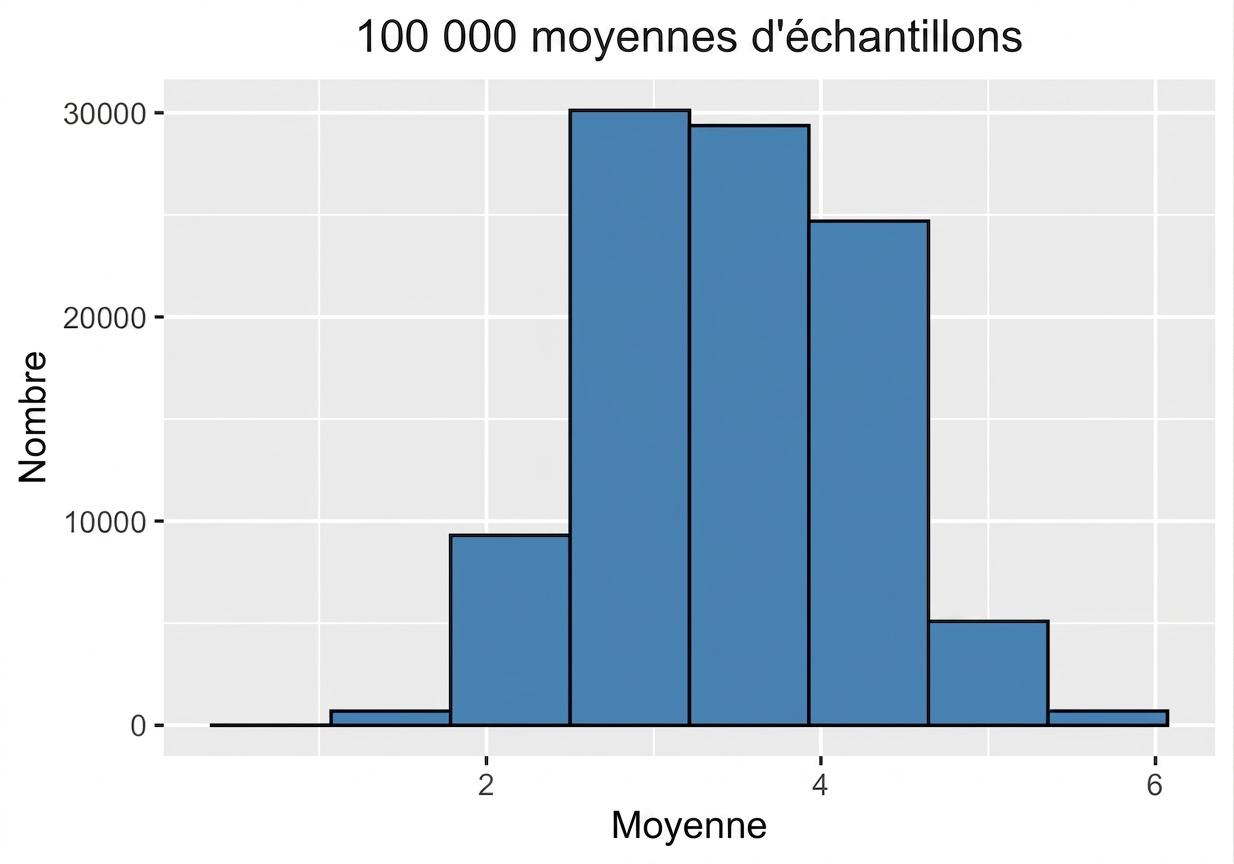
100000 moyennes d'échantillon
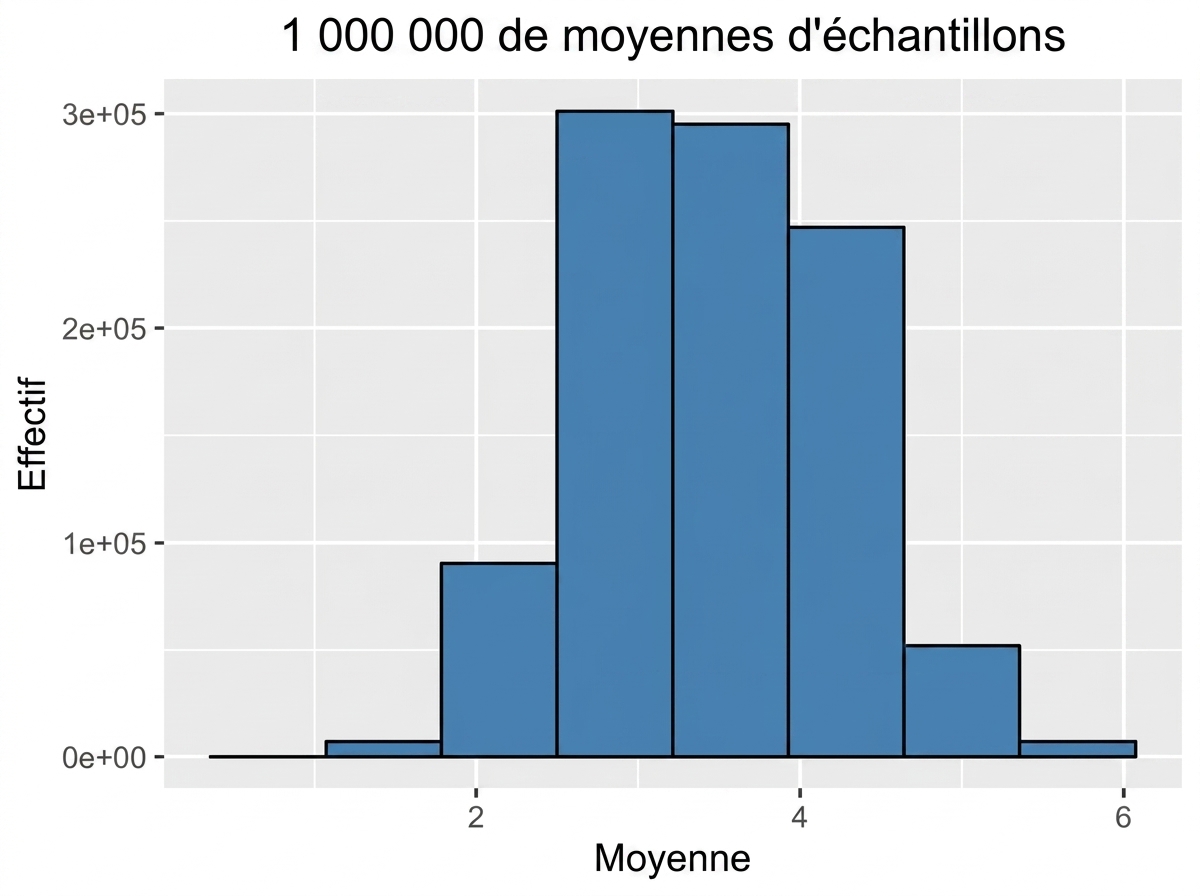
Un million de moyennes d'échantillon
Théorème central limite
La distribution d'échantillonnage d'une statistique se rapproche d'une normale à mesure que la taille de l'échantillon augmente.
* Les échantillons doivent être aléatoires et indépendants
Écart type et TCL
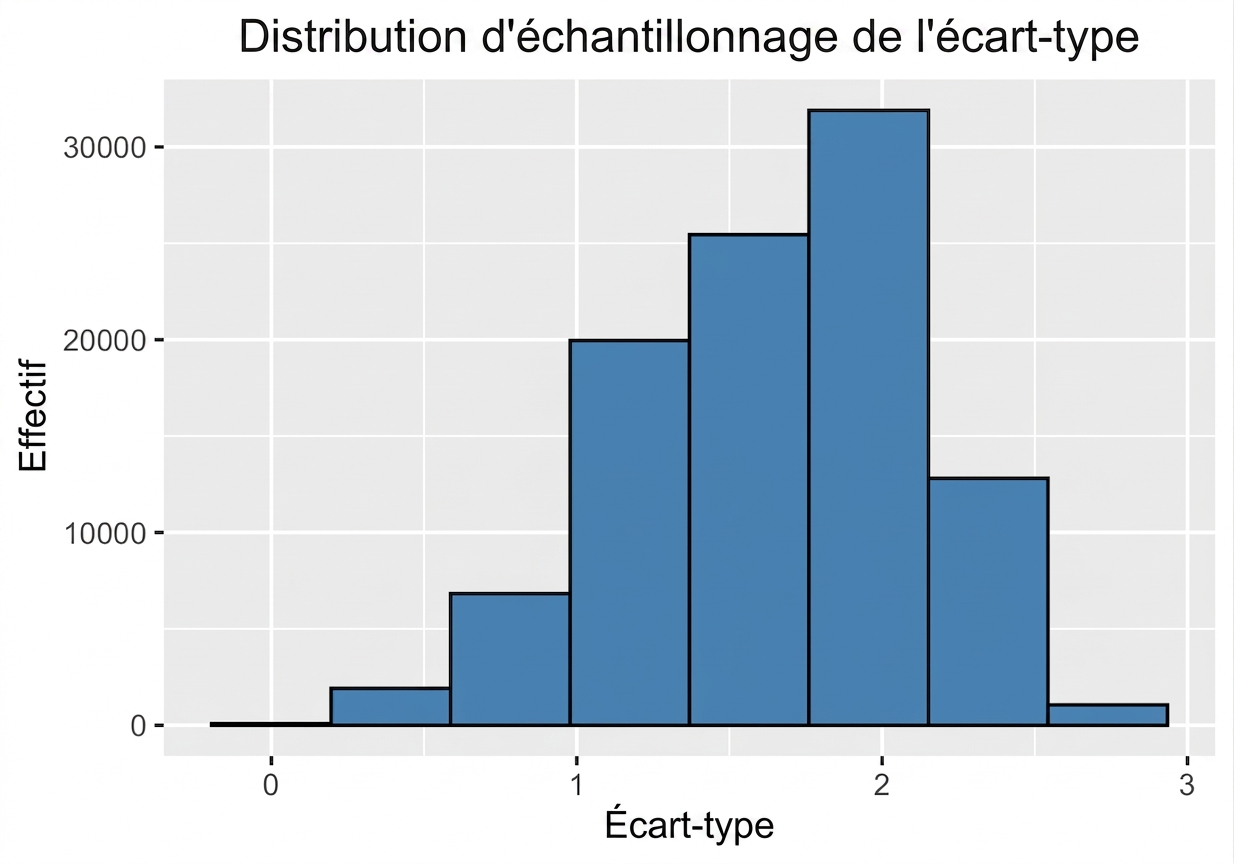
Distribution d'échantillonnage de la proportion
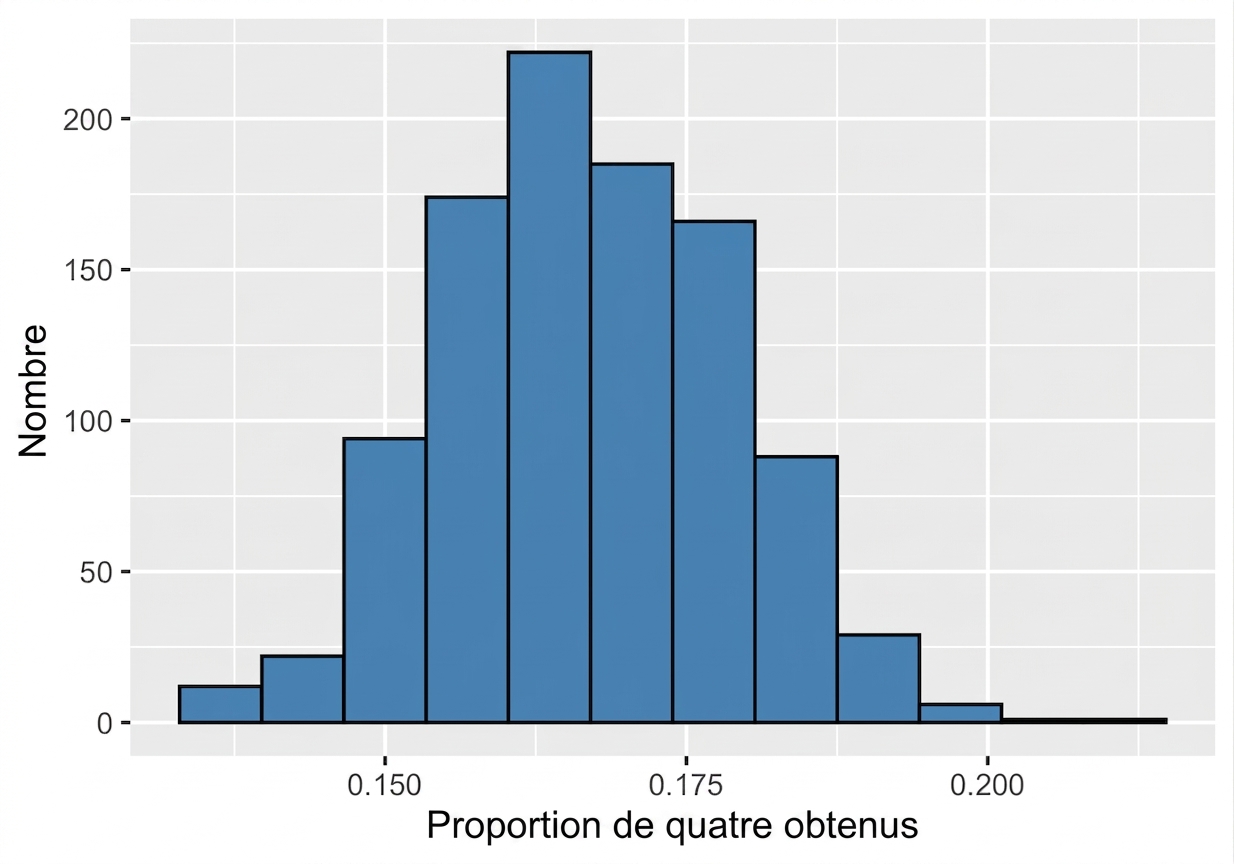
Moyenne de la distribution d'échantillonnage
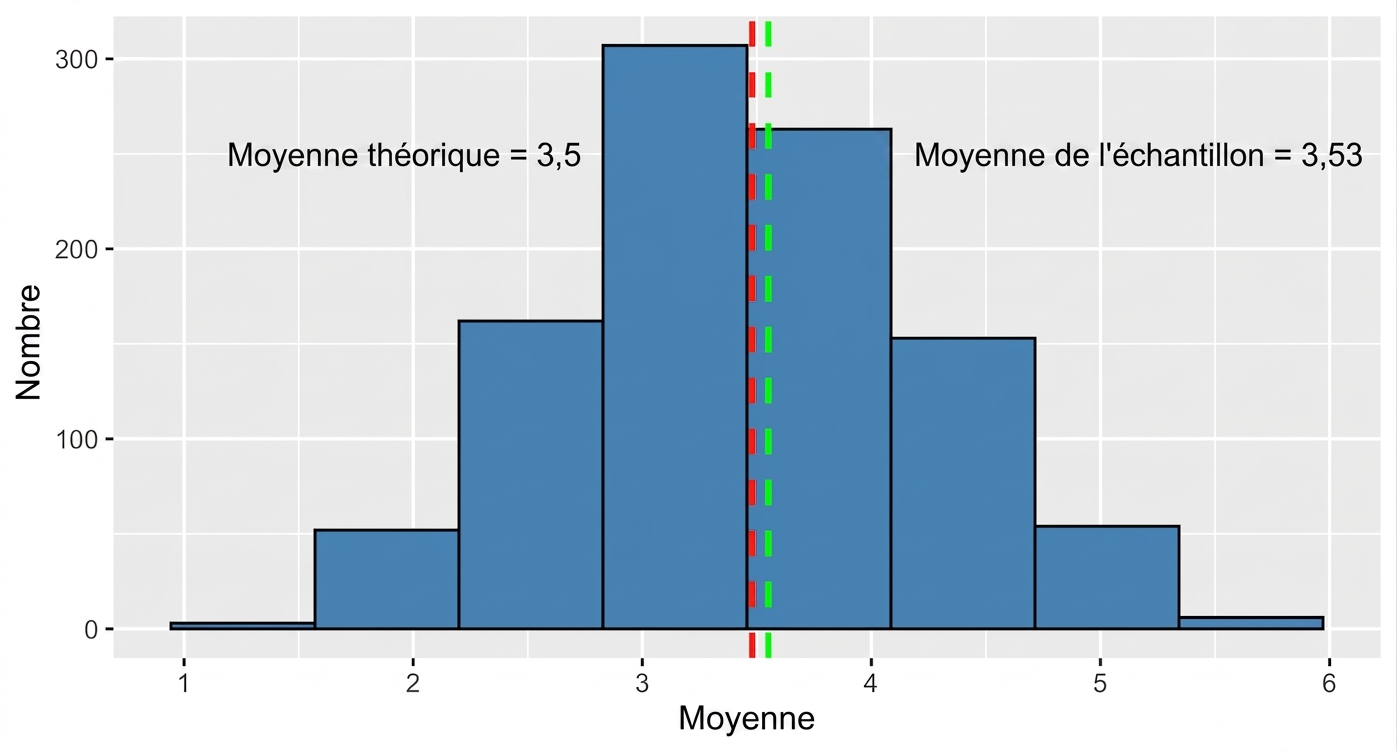
Avantages du théorème central limite