Interpréter les résultats d'un test d'hypothèse

Introduction aux statistiques

George Boorman

Curriculum Manager, DataCamp

Espérance de vie : Chicago vs Bangkok

  • Hypothèse nulle :

    • Aucune différence d'espérance de vie entre les résidents de Chicago et ceux de Bangkok
  • Hypothèse alternative :

    • Les résidents de Chicago ont une espérance de vie plus élevée que ceux de Bangkok

Chicago chicago_skyline_at_night.jpg

Bangkok bangkok_skyline_at_dusk.jpg

Introduction aux statistiques

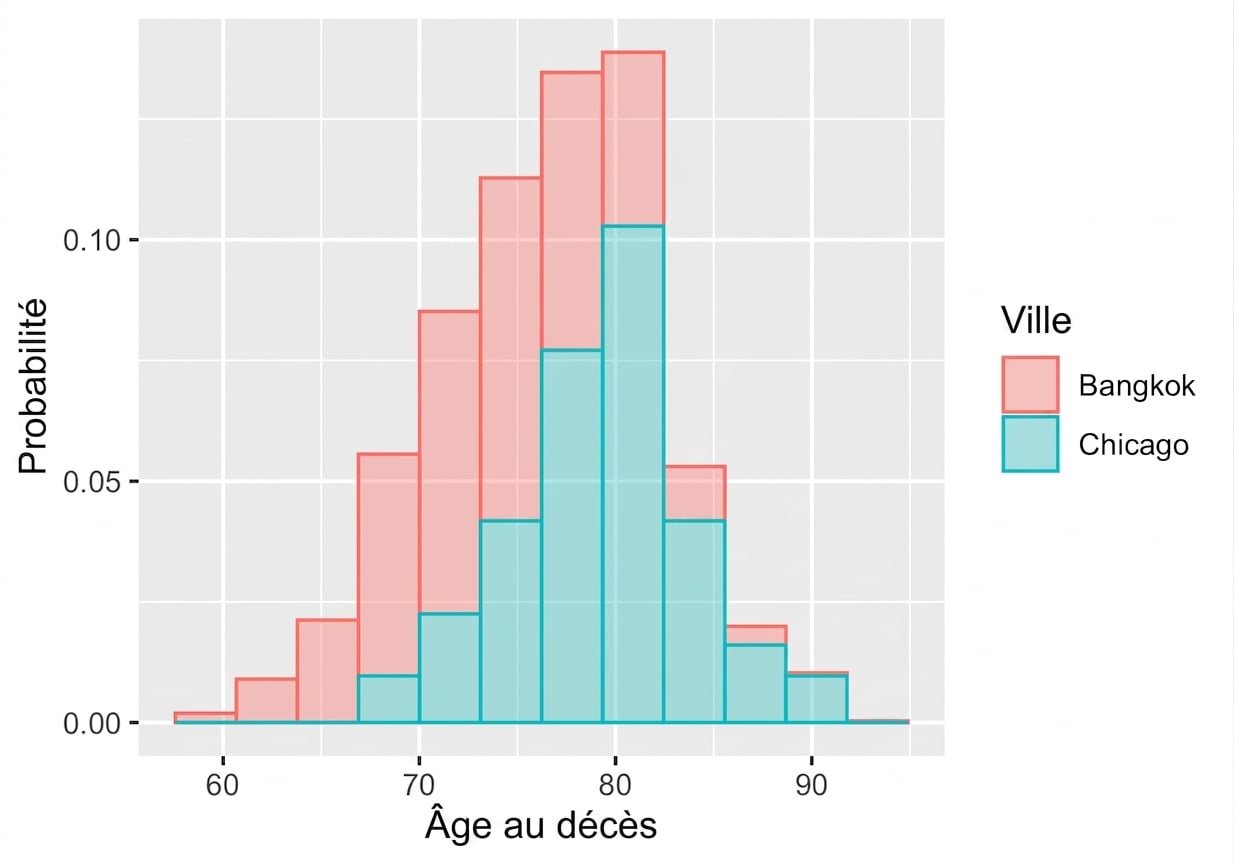
Distribution d'échantillonnage

sampling_histogram_of_life_expectancy_in_Chicago_and_Bangkok.png

Introduction aux statistiques

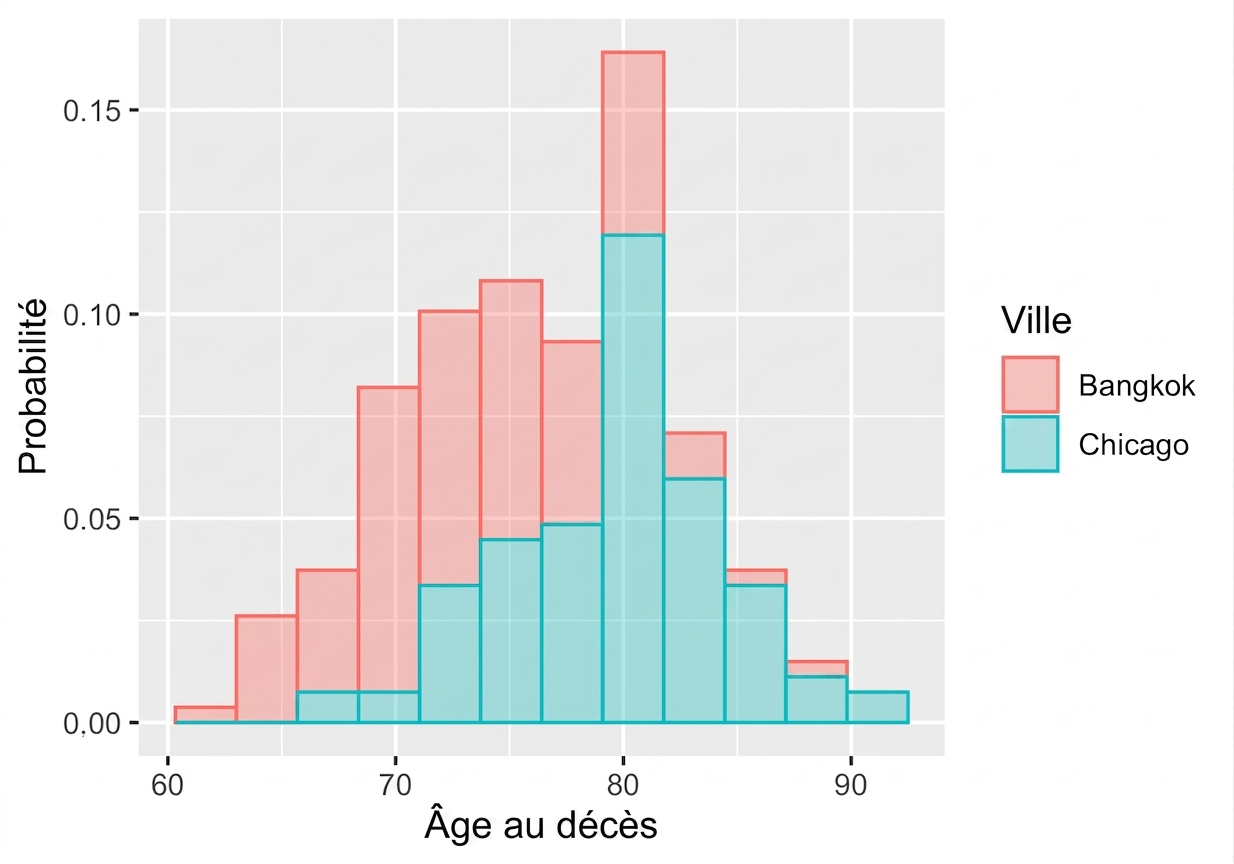
Échantillons différents

second_sample_histogram_of_life_expectancy_in_Chicago_and_Bangkok.png

Introduction aux statistiques

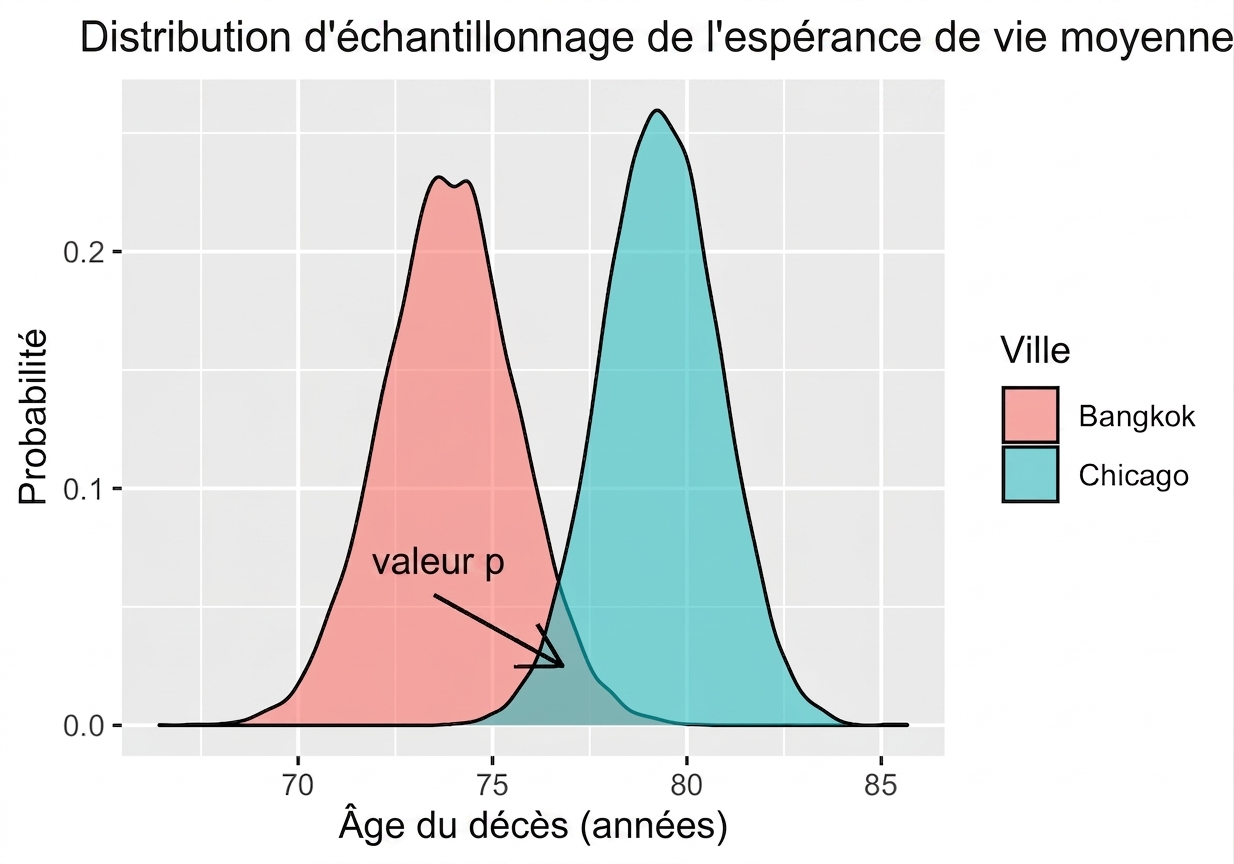
Distribution d'échantillonnage de l'espérance de vie moyenne
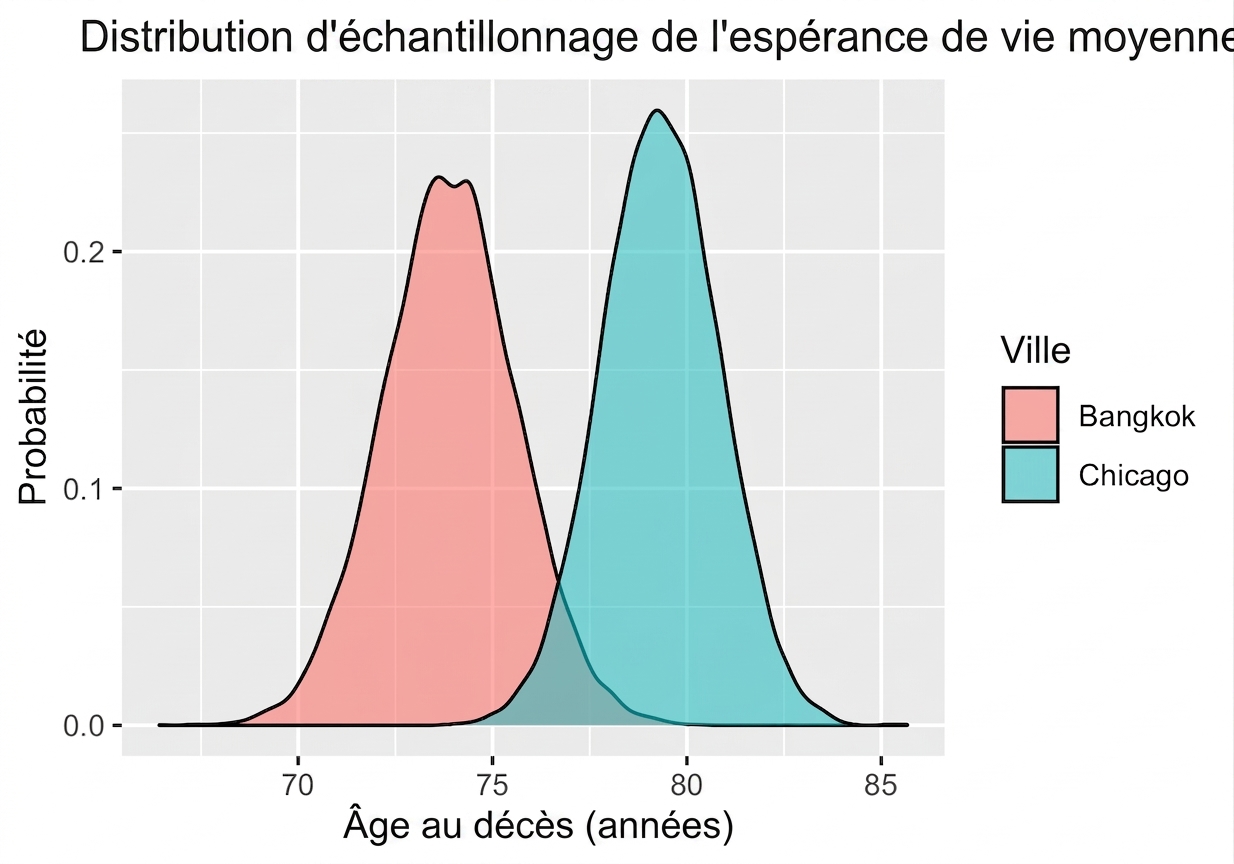
sampling_distribution_of_mean_life_expectancy_per_city_following_two_bell_curve_shapes.png

Introduction aux statistiques

Valeur p

  • $p$
    • Probabilité d'obtenir ce résultat si l'hypothèse nulle est vraie
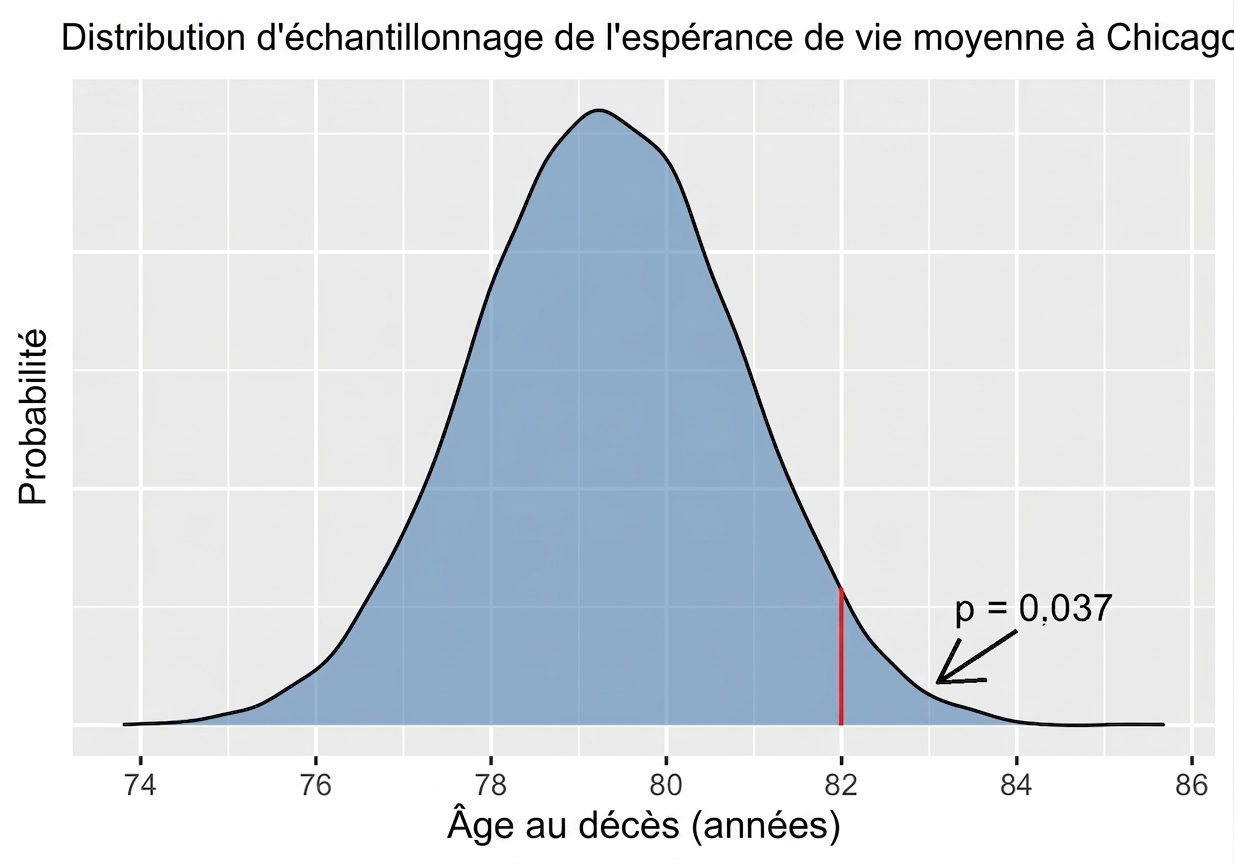
chicacgo_sample_means_distribution_annotated_with_p_value_for_mean_of_eighty_two.png

Introduction aux statistiques

Valeur p

bangkok_and_chicago_sample_mean_distributions_with_p_value_annotated_as_the_overlap_between_the_two.png

Introduction aux statistiques

Seuil de signification ($\alpha$)

  • Pour réduire le risque de tirer une mauvaise conclusion :

    • Fixer un seuil de probabilité pour rejeter l'hypothèse nulle
  • Appelé $\alpha$ ou seuil de signification

  • Décidé avant la collecte des données pour limiter les biais :

    • Sinon, on pourrait choisir un autre $\alpha$ selon ses intérêts
  • Un seuil courant est 0,05

    • 5 % de risque de conclure à tort que les résidents de Chicago vivent plus longtemps que ceux de Bangkok
  • Si $p\leq\alpha$, rejeter l'hypothèse nulle

  • Ces résultats sont dits statistiquement significatifs

Introduction aux statistiques

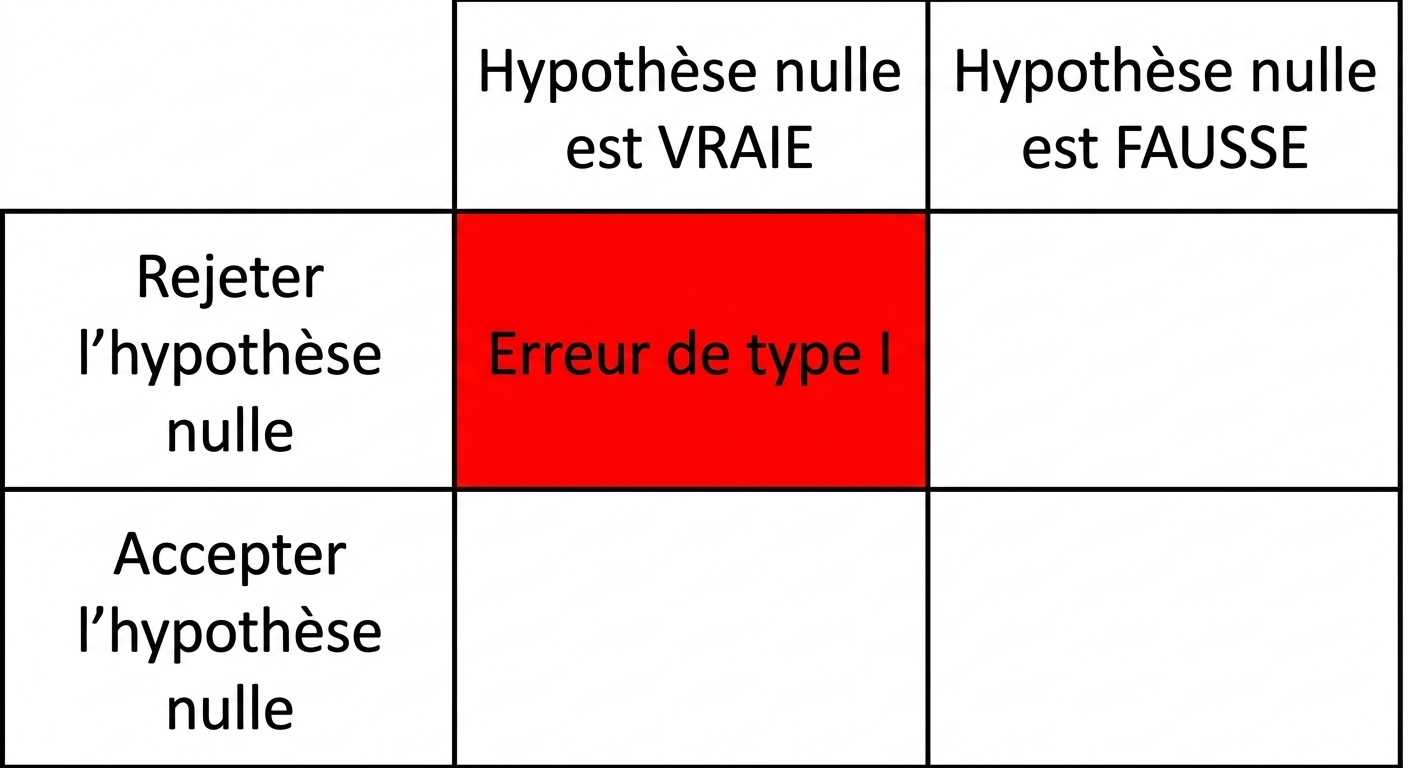
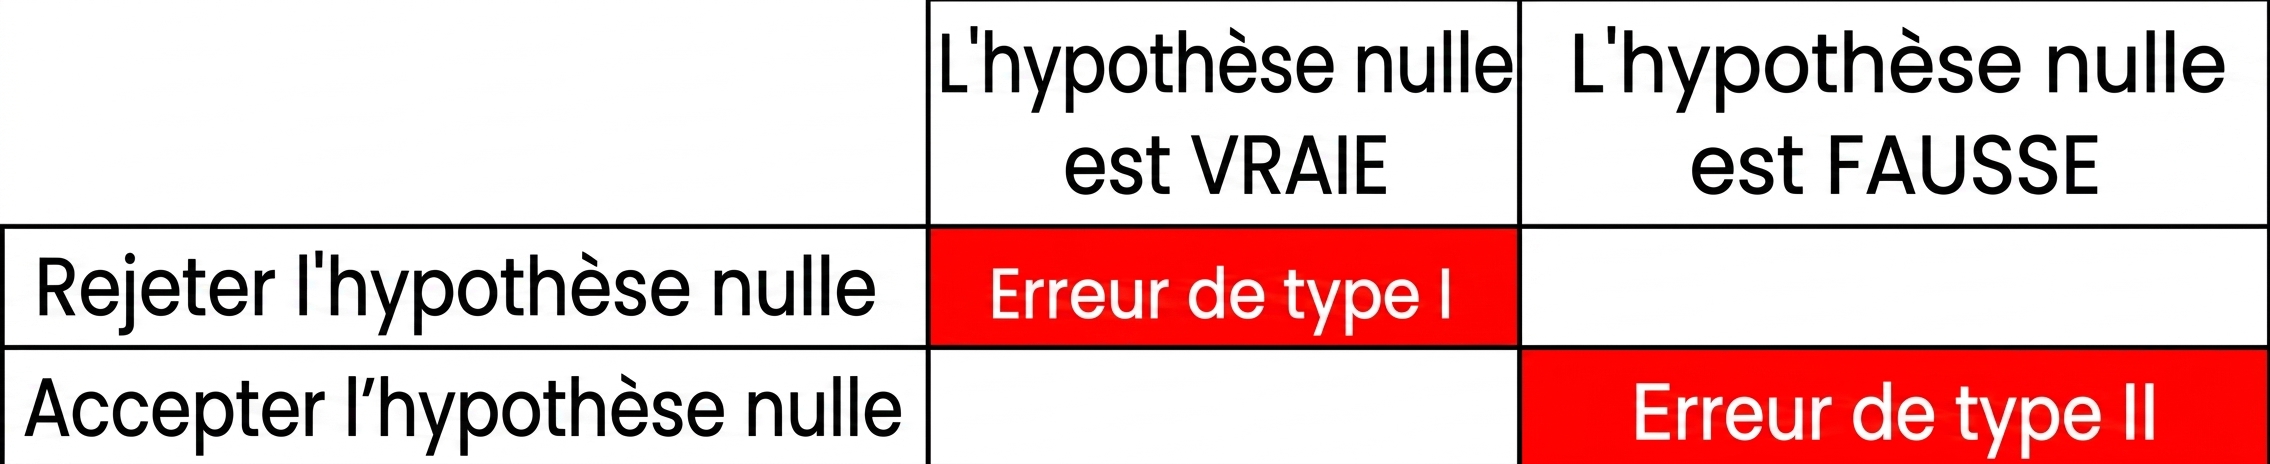
Erreurs de type I/II

falsely_reject_the_null_hypothesis.png

Introduction aux statistiques

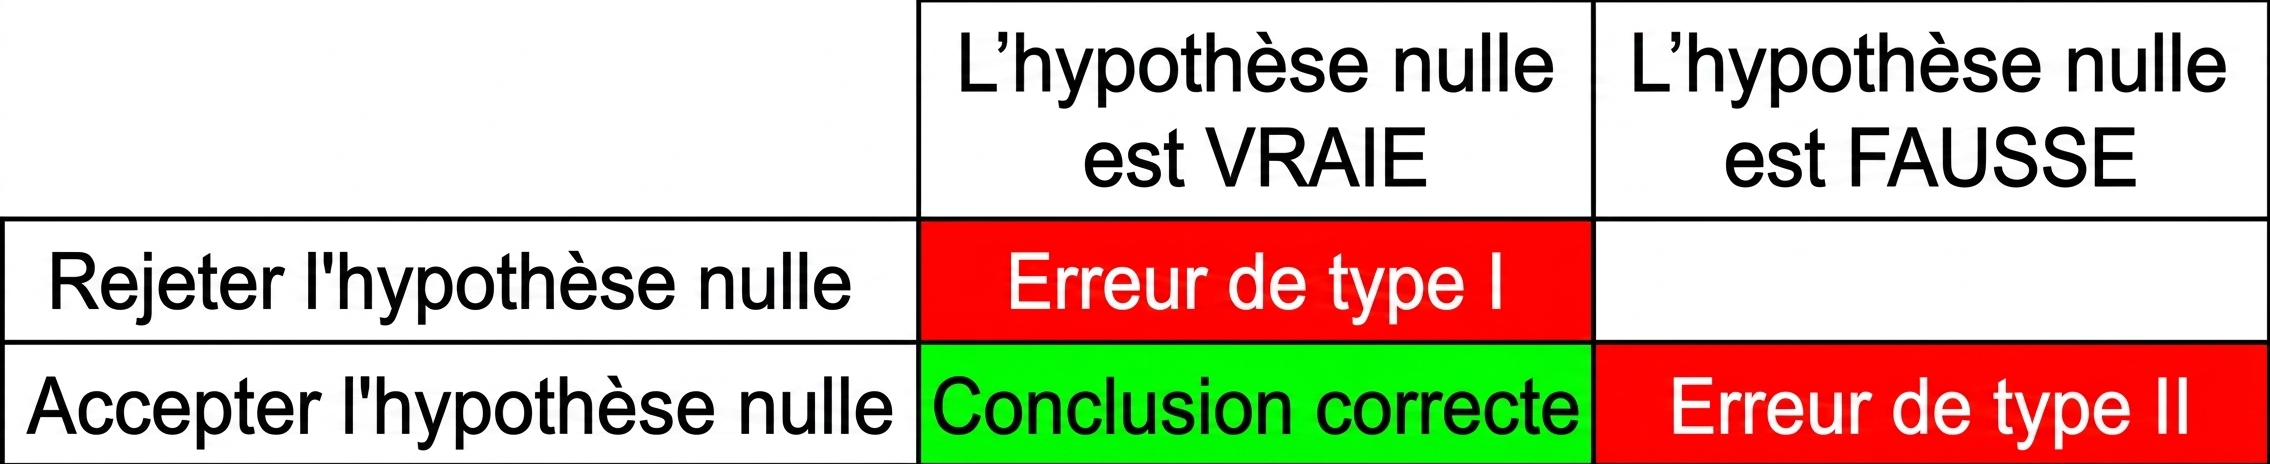
Erreurs de type I/II

falsely_accept_the_null_hypothesis.png

Introduction aux statistiques

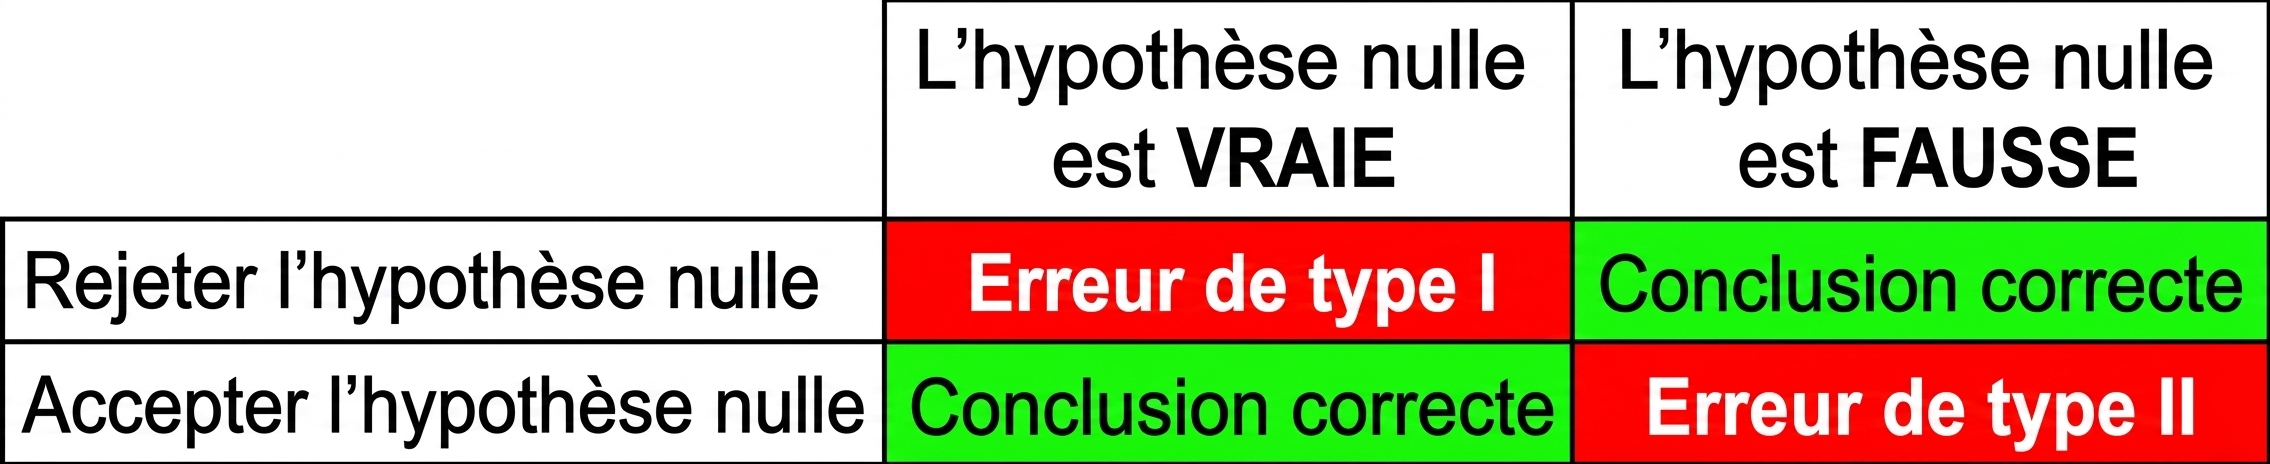
Erreurs de type I/II

correctly_accept_the_null_hypothesis.png

Introduction aux statistiques

Erreurs de type I/II

correctly_reject_the_null_hypothesis.png

Introduction aux statistiques

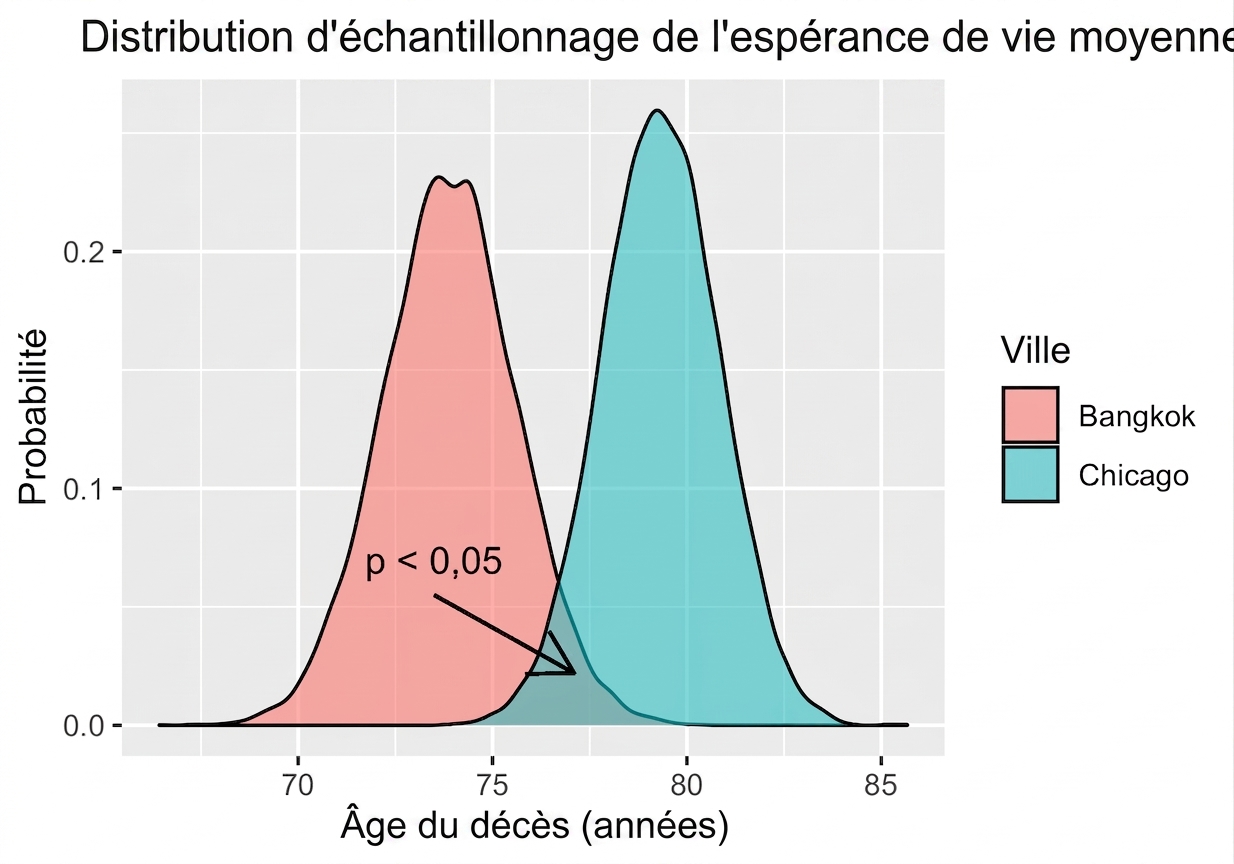
Tirer une conclusion

sampling_distribution_of_mean_life_expectancy_per_city_following_two_bell_curve_shapes_with_overlap_annotated.png

Introduction aux statistiques

Passons à la pratique !

Introduction aux statistiques

Preparing Video For Download...