การปรับแต่ง

Python ระดับกลาง

Hugo Bowne-Anderson

Data Scientist at DataCamp

การแสดงภาพข้อมูล

  • มีตัวเลือกมากมาย

    • ประเภทกราฟที่หลากหลาย

    • ปรับแต่งได้หลายรูปแบบ

  • การเลือกขึ้นอยู่กับ

    • ข้อมูล

    • เรื่องที่ต้องการสื่อ

Python ระดับกลาง

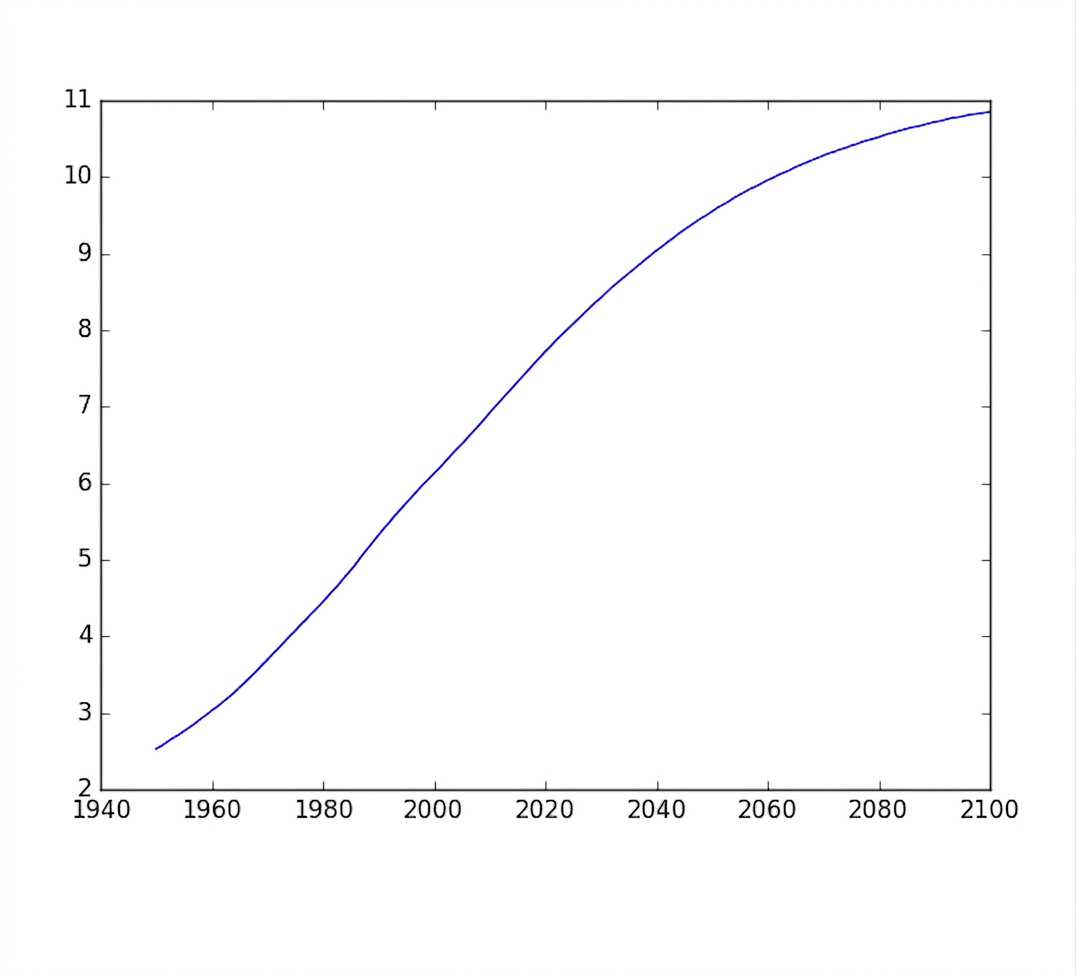
กราฟเบื้องต้น

population.py

import matplotlib.pyplot as plt
year = [1950, 1951, 1952, ..., 2100]
pop = [2.538, 2.57, 2.62, ..., 10.85]

plt.plot(year, pop)

plt.show()

ch1_3_slides.012.png

Python ระดับกลาง

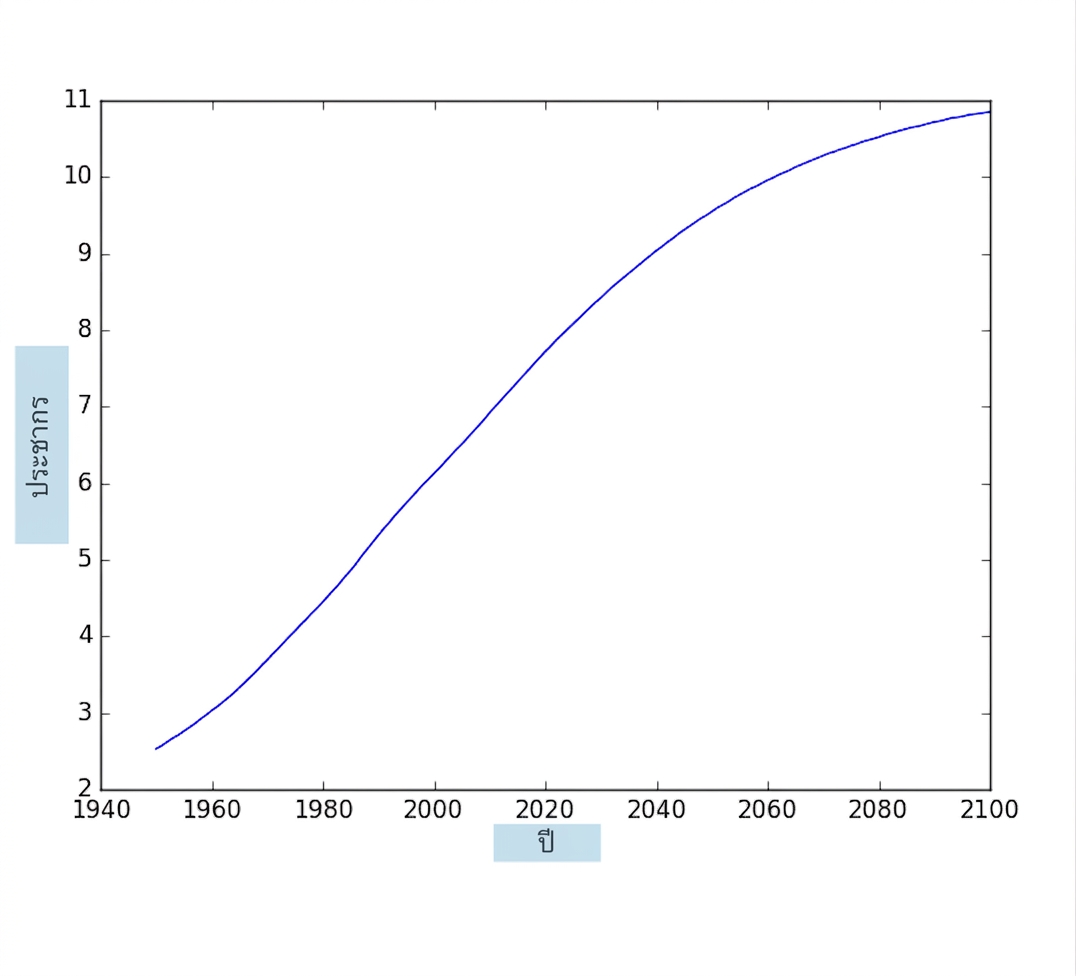
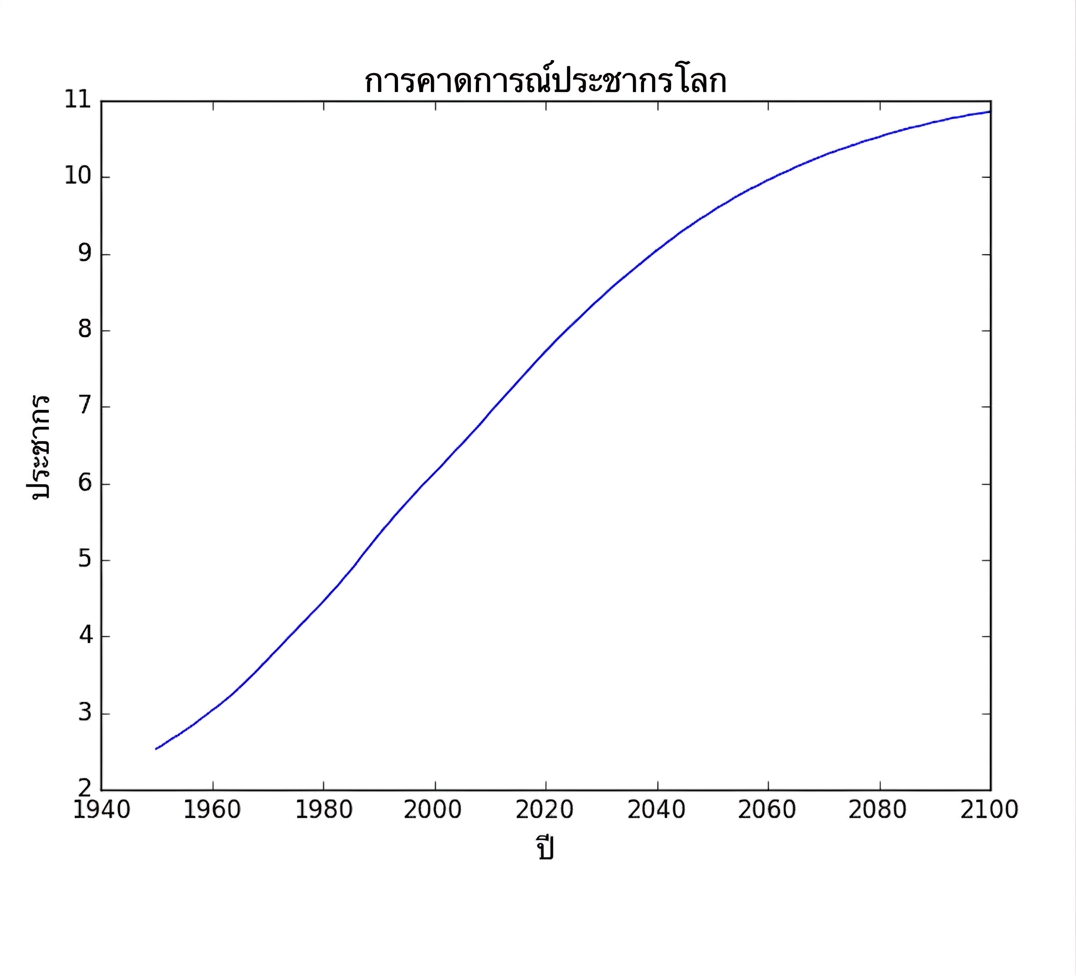
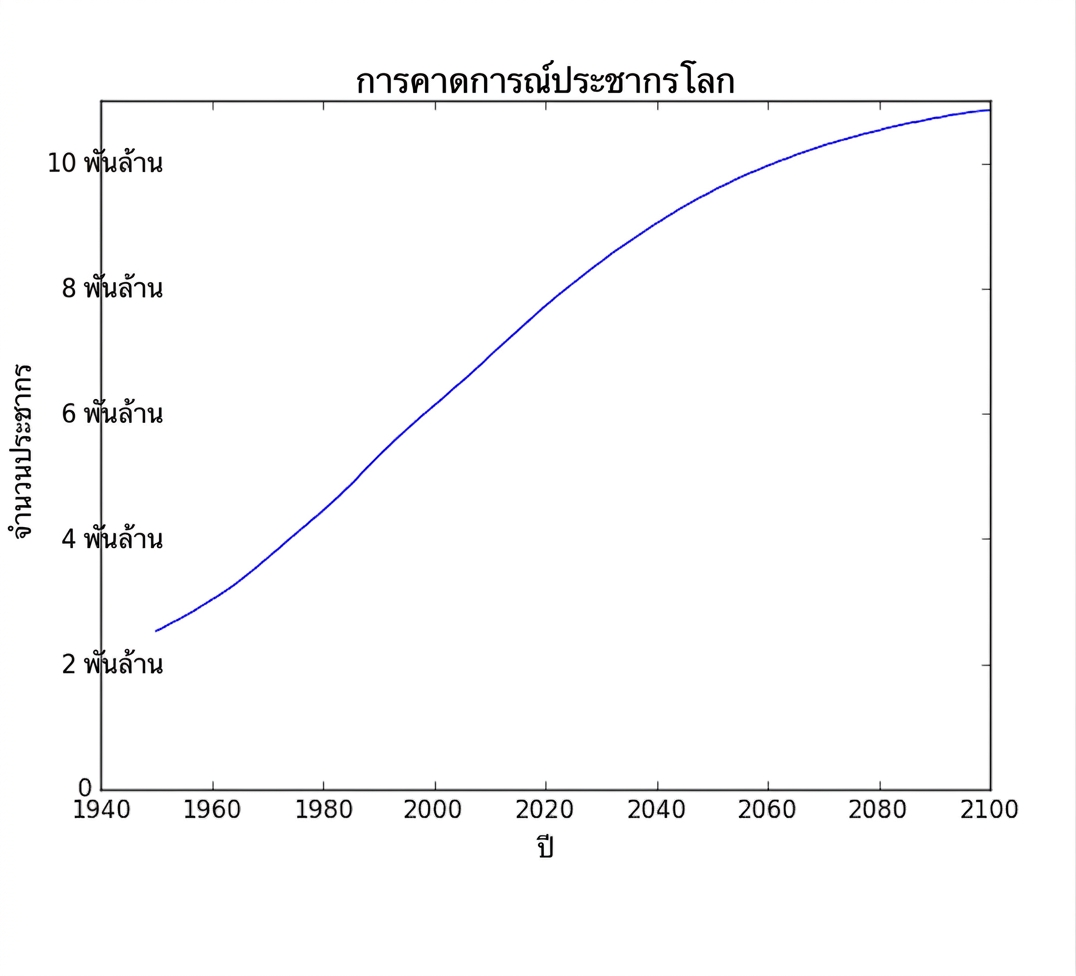
ป้ายกำกับแกน

population.py

import matplotlib.pyplot as plt
year = [1950, 1951, 1952, ..., 2100] 
pop = [2.538, 2.57, 2.62, ..., 10.85]

plt.plot(year, pop)

plt.xlabel('Year') plt.ylabel('Population')
plt.show()

ch1_3_slides.012.png

Python ระดับกลาง

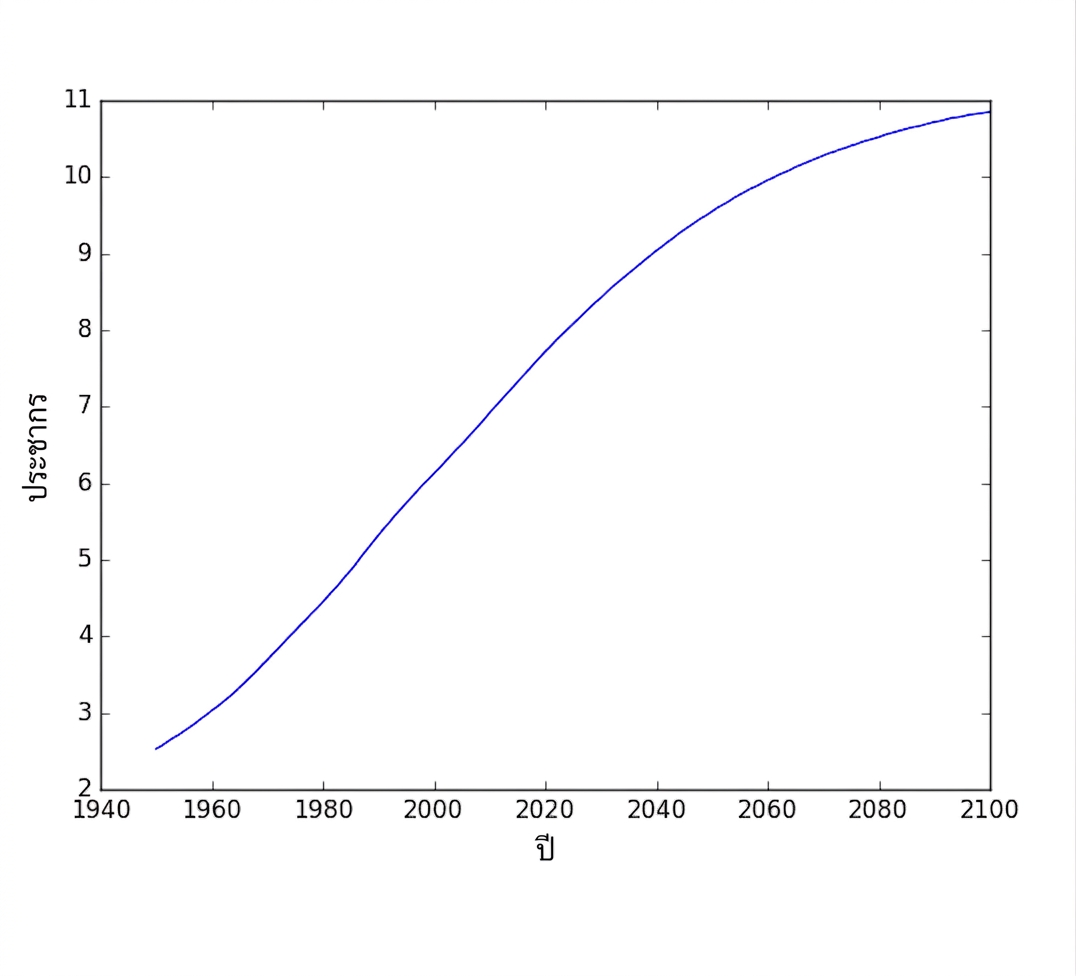
ป้ายกำกับแกน

population.py

import matplotlib.pyplot as plt
year = [1950, 1951, 1952, ..., 2100] 
pop = [2.538, 2.57, 2.62, ..., 10.85]

plt.plot(year, pop)

plt.xlabel('Year') plt.ylabel('Population')
plt.show()

ch1_3_slides.014.png

Python ระดับกลาง

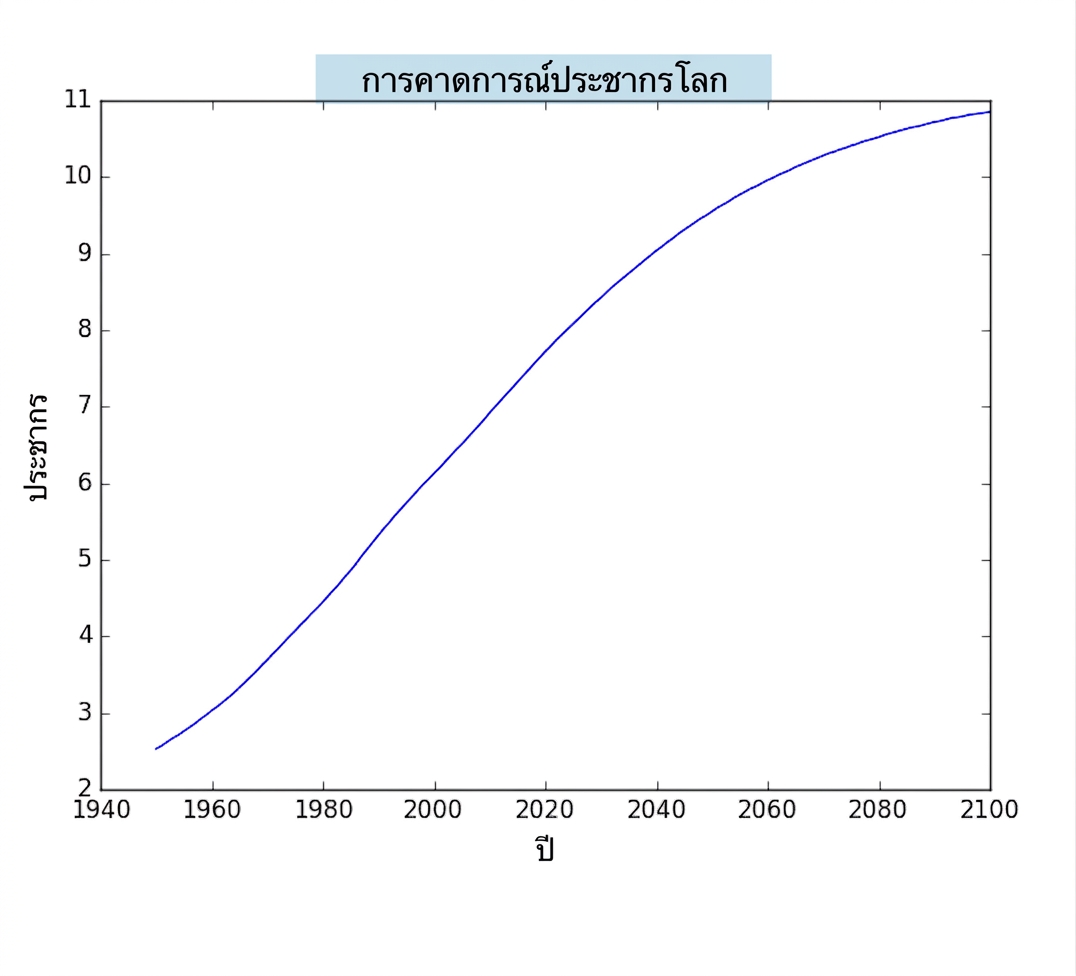
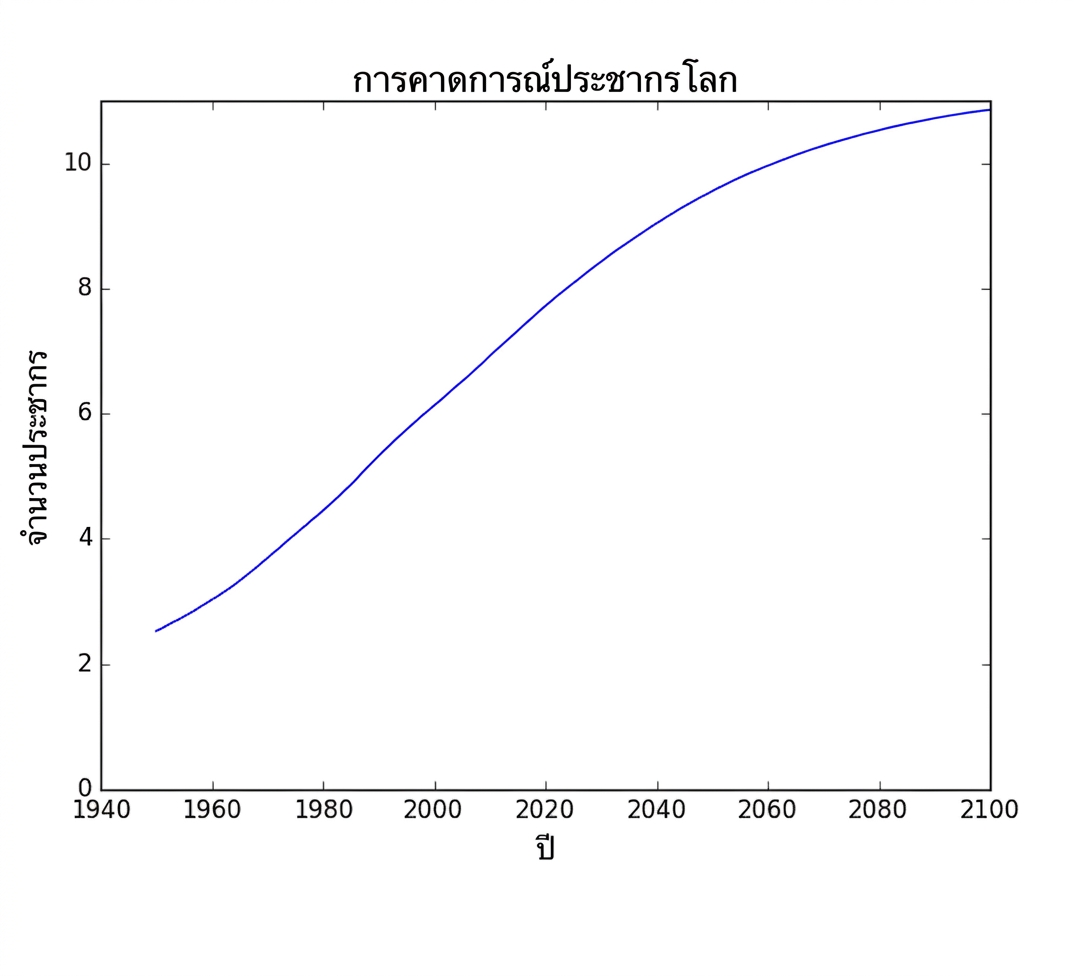
ชื่อกราฟ

population.py

import matplotlib.pyplot as plt
year = [1950, 1951, 1952, ..., 2100] 
pop = [2.538, 2.57, 2.62, ..., 10.85]

plt.plot(year, pop)

plt.xlabel('Year') plt.ylabel('Population')
plt.title('World Population Projections')
plt.show()

ch1_3_slides.015.png

Python ระดับกลาง

ชื่อกราฟ

population.py

import matplotlib.pyplot as plt
year = [1950, 1951, 1952, ..., 2100] 
pop = [2.538, 2.57, 2.62, ..., 10.85]

plt.plot(year, pop)

plt.xlabel('Year') plt.ylabel('Population')
plt.title('World Population Projections')
plt.show()

ch1_3_slides.017.png

Python ระดับกลาง

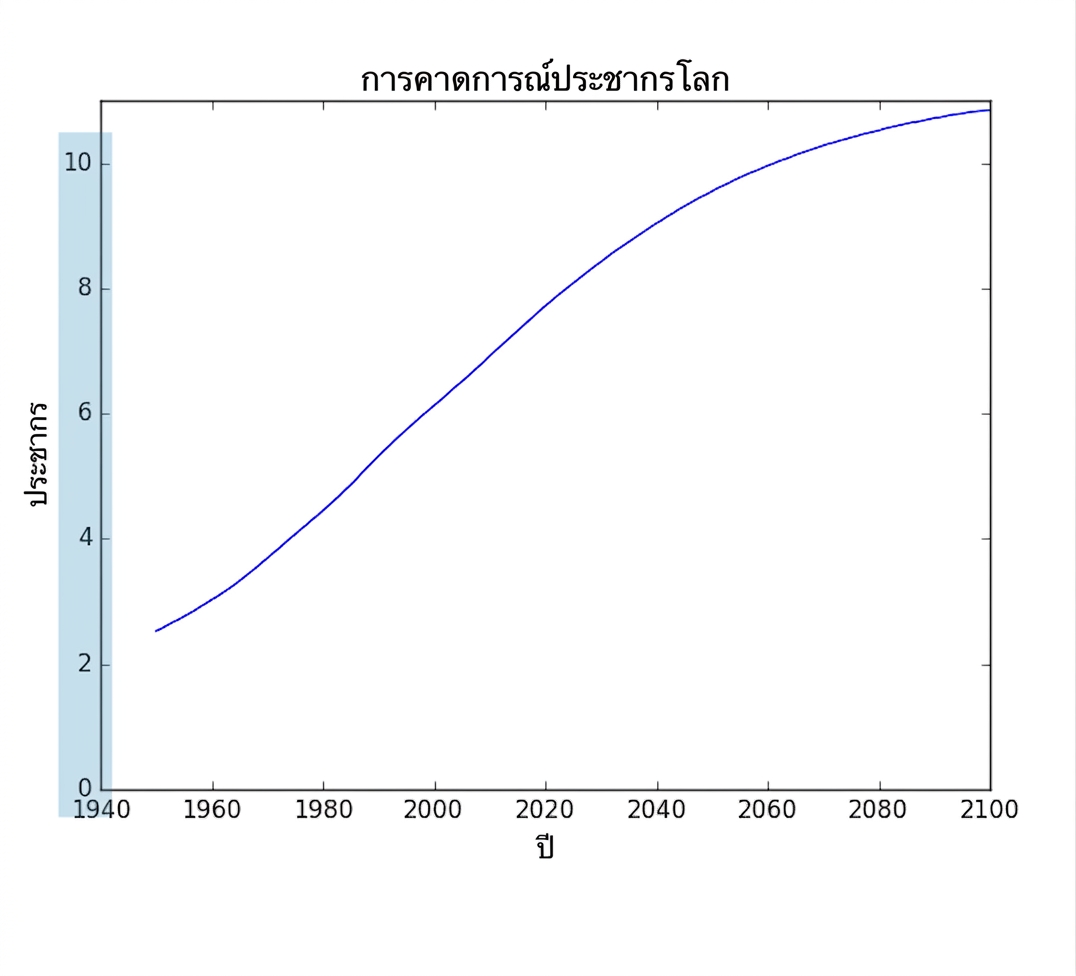
ขีดแกน

population.py

import matplotlib.pyplot as plt
year = [1950, 1951, 1952, ..., 2100] 
pop = [2.538, 2.57, 2.62, ..., 10.85]

plt.plot(year, pop)

plt.xlabel('Year') plt.ylabel('Population')
plt.title('World Population Projections')
plt.yticks([0, 2, 4, 6, 8, 10])
plt.show()

ch1_3_slides.019.png

Python ระดับกลาง

ขีดแกน

population.py

import matplotlib.pyplot as plt
year = [1950, 1951, 1952, ..., 2100] 
pop = [2.538, 2.57, 2.62, ..., 10.85]

plt.plot(year, pop)

plt.xlabel('Year') plt.ylabel('Population')
plt.title('World Population Projections')
plt.yticks([0, 2, 4, 6, 8, 10])
plt.show()

ch1_3_slides.020.png

Python ระดับกลาง

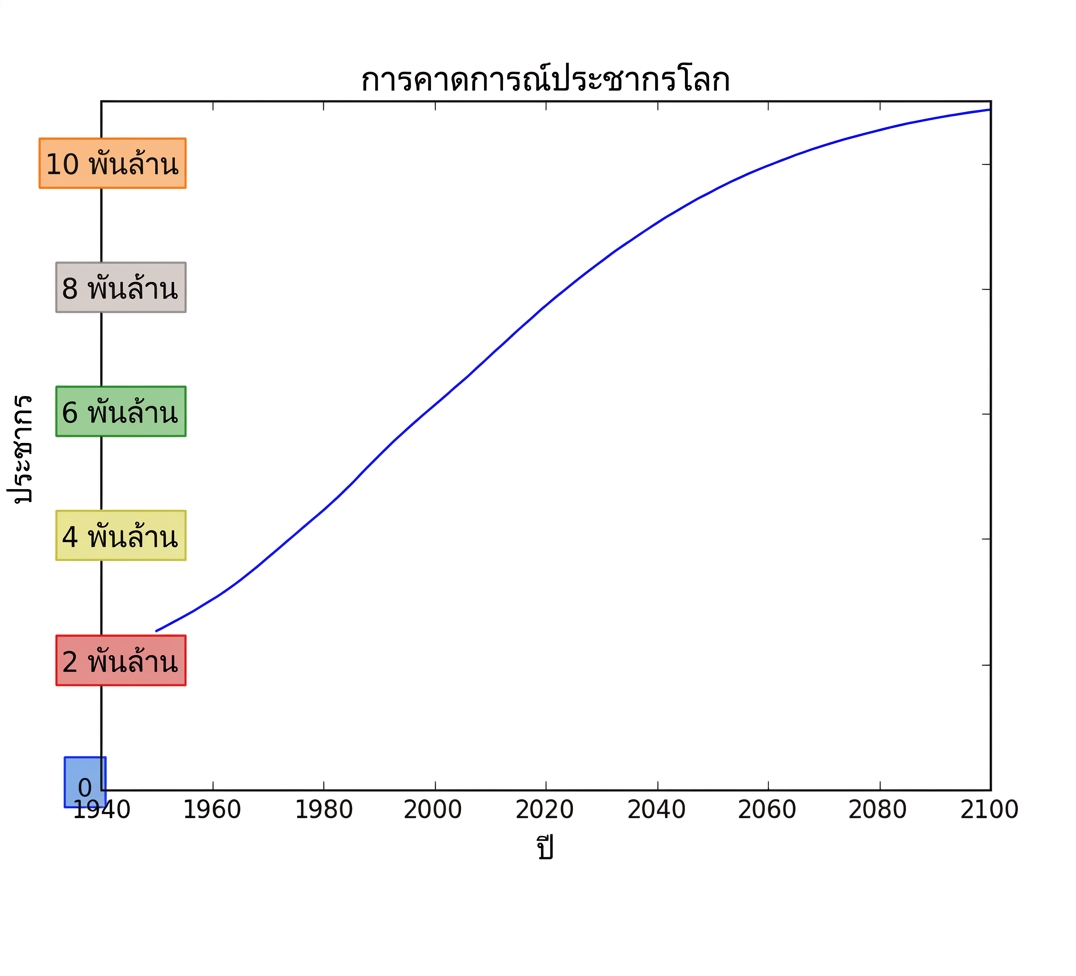
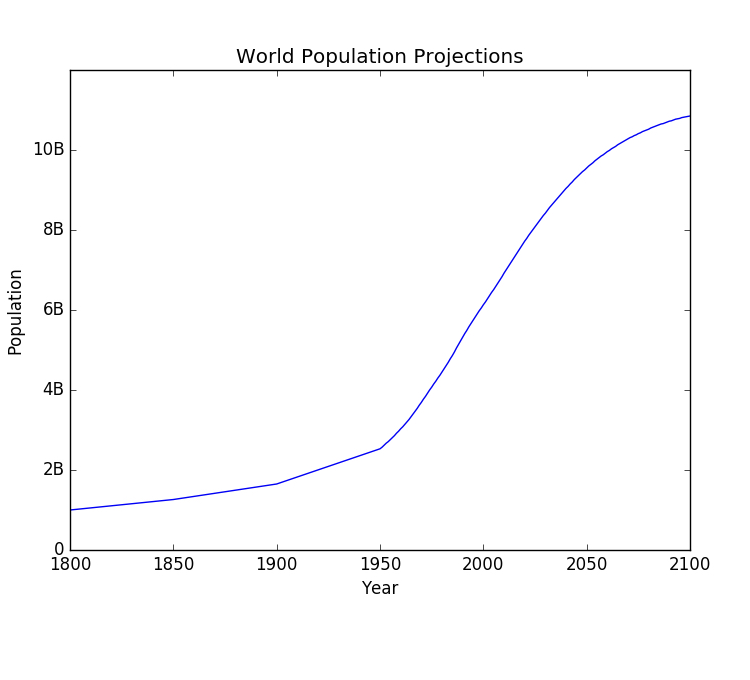
ขีดแกน (2)

population.py

import matplotlib.pyplot as plt
year = [1950, 1951, 1952, ..., 2100] 
pop = [2.538, 2.57, 2.62, ..., 10.85]

plt.plot(year, pop)

plt.xlabel('Year') plt.ylabel('Population')
plt.title('World Population Projections')
plt.yticks([0, 2, 4, 6, 8, 10],
['0', '2B', '4B', '6B', '8B', '10B'])
plt.show()

ch1_3_slides.021.png

Python ระดับกลาง

ขีดแกน (2)

population.py

import matplotlib.pyplot as plt
year = [1950, 1951, 1952, ..., 2100] 
pop = [2.538, 2.57, 2.62, ..., 10.85]

plt.plot(year, pop)

plt.xlabel('Year') plt.ylabel('Population')
plt.title('World Population Projections')
plt.yticks([0, 2, 4, 6, 8, 10],
['0', '2B', '4B', '6B', '8B', '10B'])
plt.show()

ch1_3_slides.027.png

Python ระดับกลาง

เพิ่มข้อมูลในอดีต

population.py

import matplotlib.pyplot as plt
year = [1950, 1951, 1952, ..., 2100] 
pop = [2.538, 2.57, 2.62, ..., 10.85]

# Add more data year = [1800, 1850, 1900] + year pop = [1.0, 1.262, 1.650] + pop
plt.plot(year, pop)
plt.xlabel('Year') plt.ylabel('Population')
plt.title('World Population Projections')
plt.yticks([0, 2, 4, 6, 8, 10],
['0', '2B', '4B', '6B', '8B', '10B'])
plt.show()

ch1_3_slides.028.png

Python ระดับกลาง

เพิ่มข้อมูลในอดีต

population.py

import matplotlib.pyplot as plt
year = [1950, 1951, 1952, ..., 2100] 
pop = [2.538, 2.57, 2.62, ..., 10.85]

# Add more data year = [1800, 1850, 1900] + year pop = [1.0, 1.262, 1.650] + pop
plt.plot(year, pop)
plt.xlabel('Year') plt.ylabel('Population')
plt.title('World Population Projections')
plt.yticks([0, 2, 4, 6, 8, 10],
['0', '2B', '4B', '6B', '8B', '10B'])
plt.show()

ch1_3_slides.030.png

Python ระดับกลาง

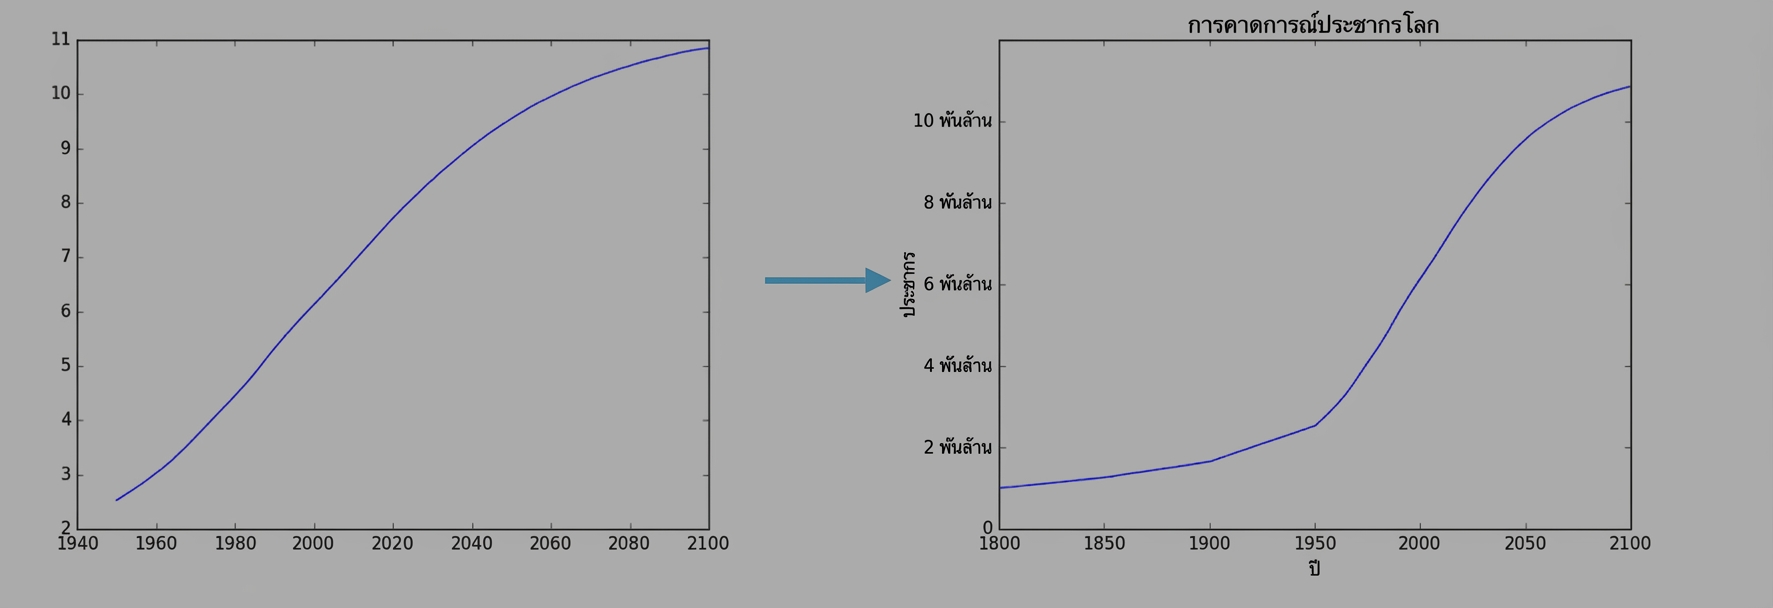
ก่อนและหลัง

ch1_3_slides.031.png

Python ระดับกลาง

มาฝึกกันเถอะ!

Python ระดับกลาง

Preparing Video For Download...