กราฟพื้นฐานด้วย Matplotlib
Python ระดับกลาง

Hugo Bowne-Anderson
Data Scientist at DataCamp
กราฟพื้นฐานด้วย Matplotlib
- การแสดงภาพข้อมูล

- โครงสร้างข้อมูล

- โครงสร้างควบคุม

- กรณีศึกษา

การแสดงภาพข้อมูล
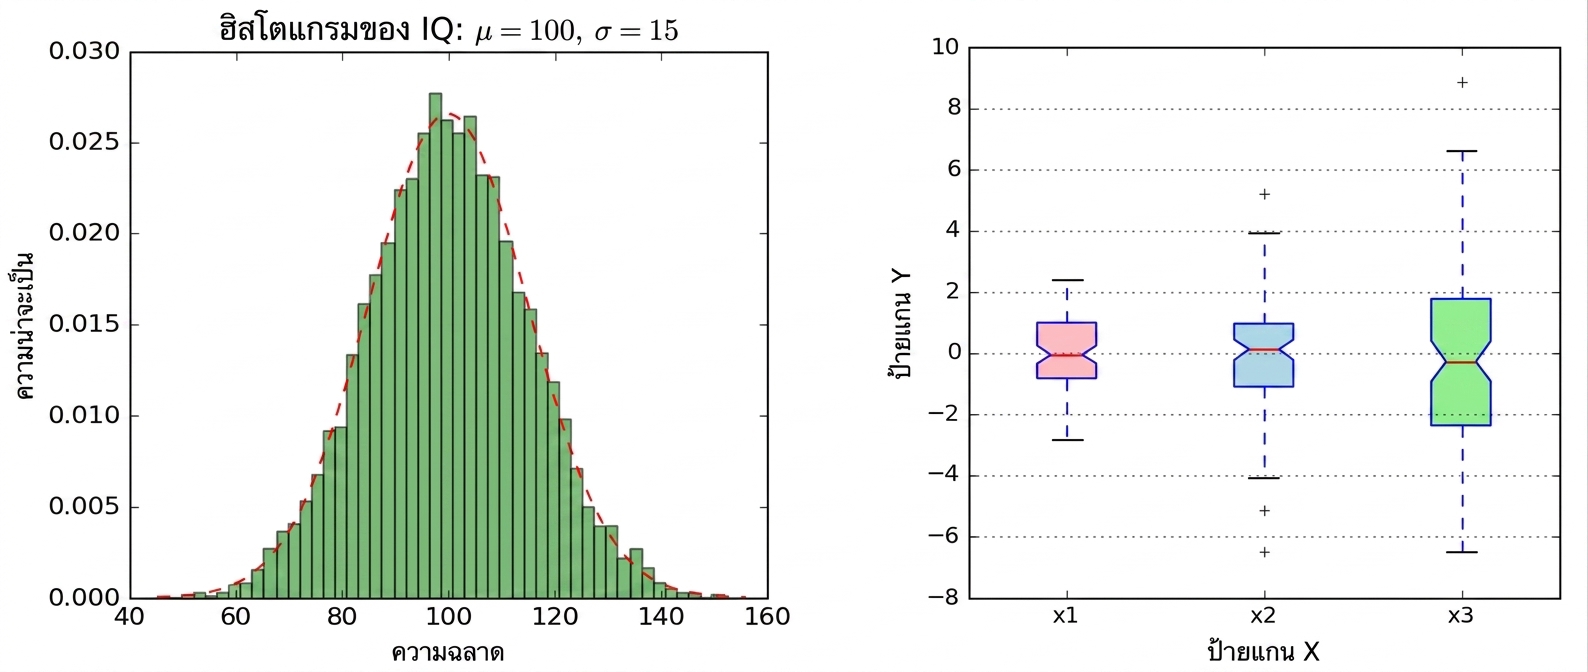
สำคัญมากในการวิเคราะห์ข้อมูล
- สำรวจข้อมูล
- นำเสนอข้อค้นพบ
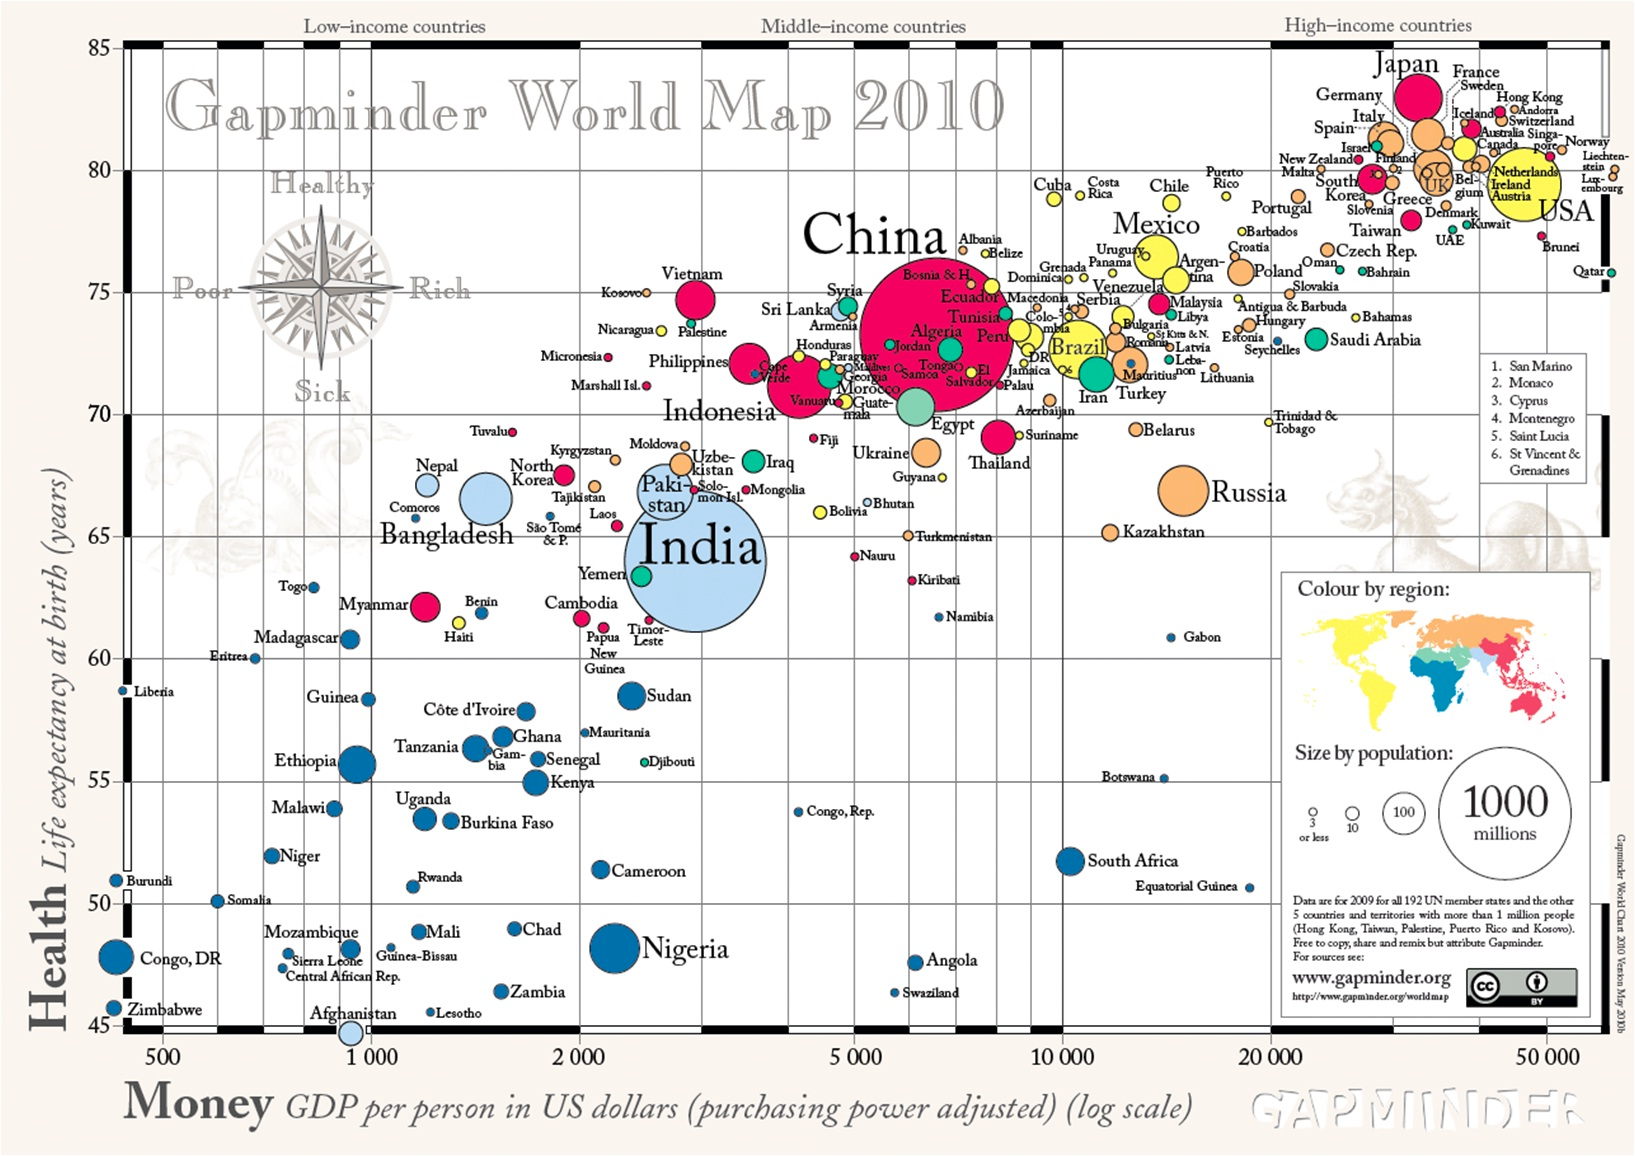
1 ที่มา: GapMinder, Wealth and Health of Nations
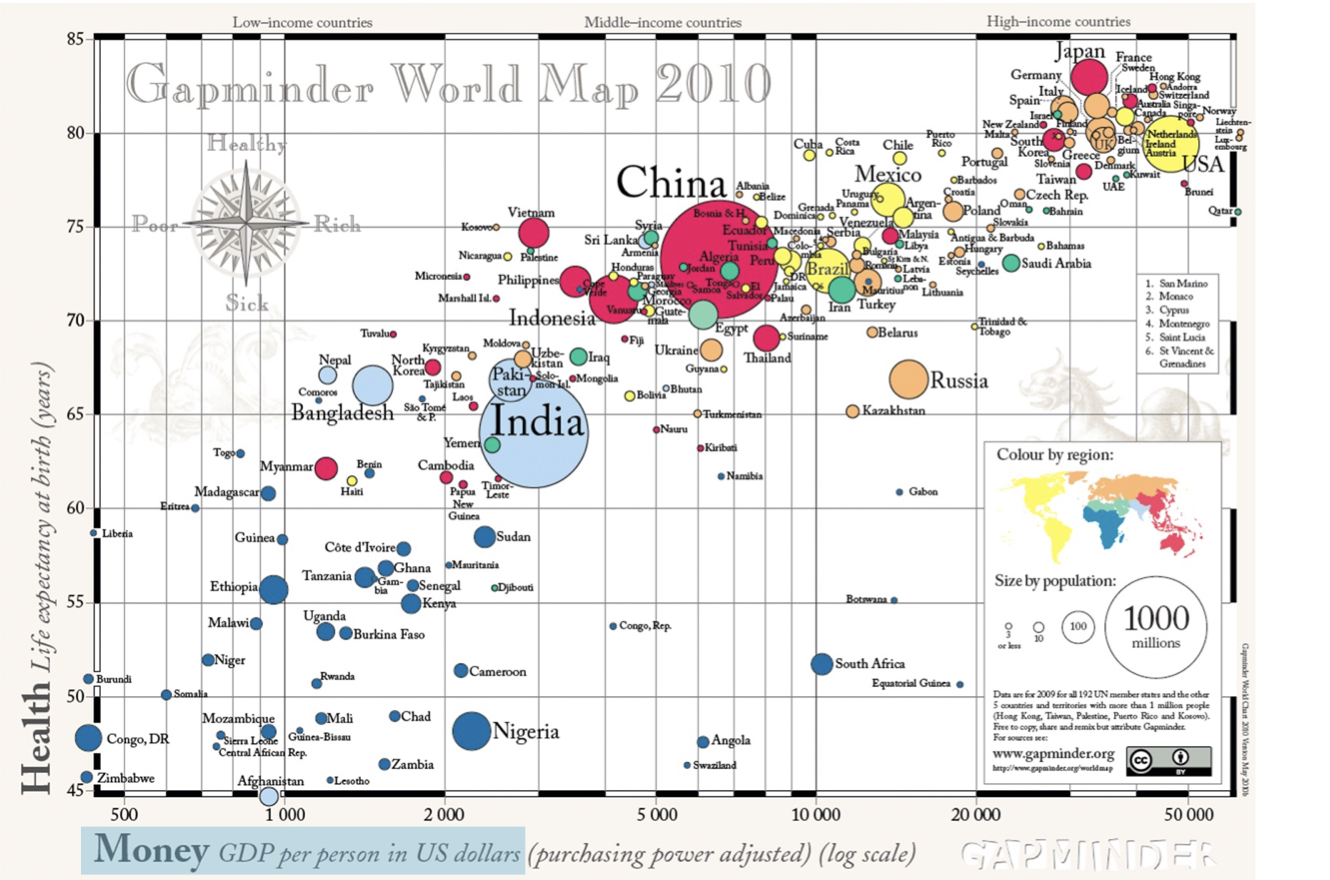
1 ที่มา: GapMinder, Wealth and Health of Nations
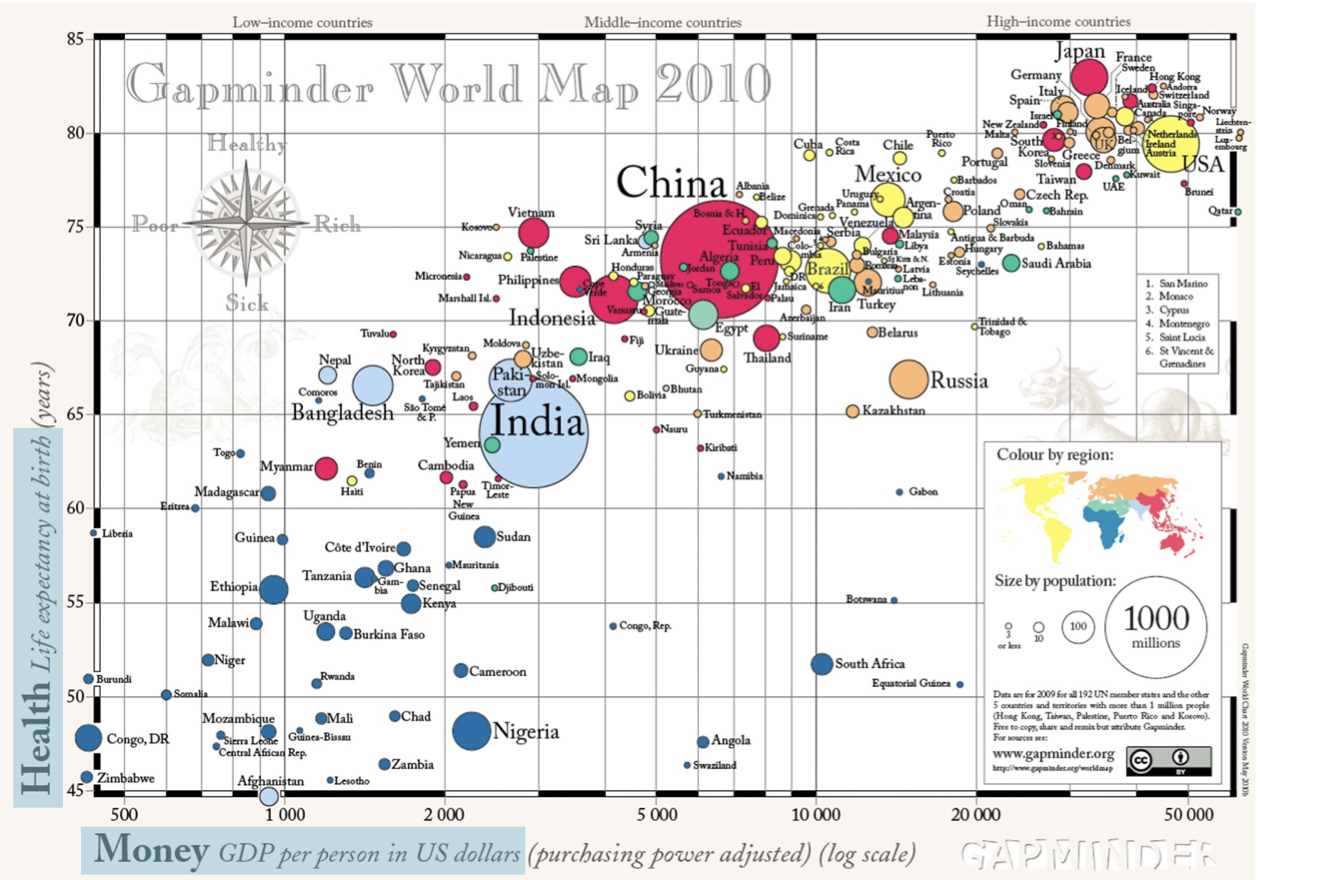
1 ที่มา: GapMinder, Wealth and Health of Nations
Matplotlib
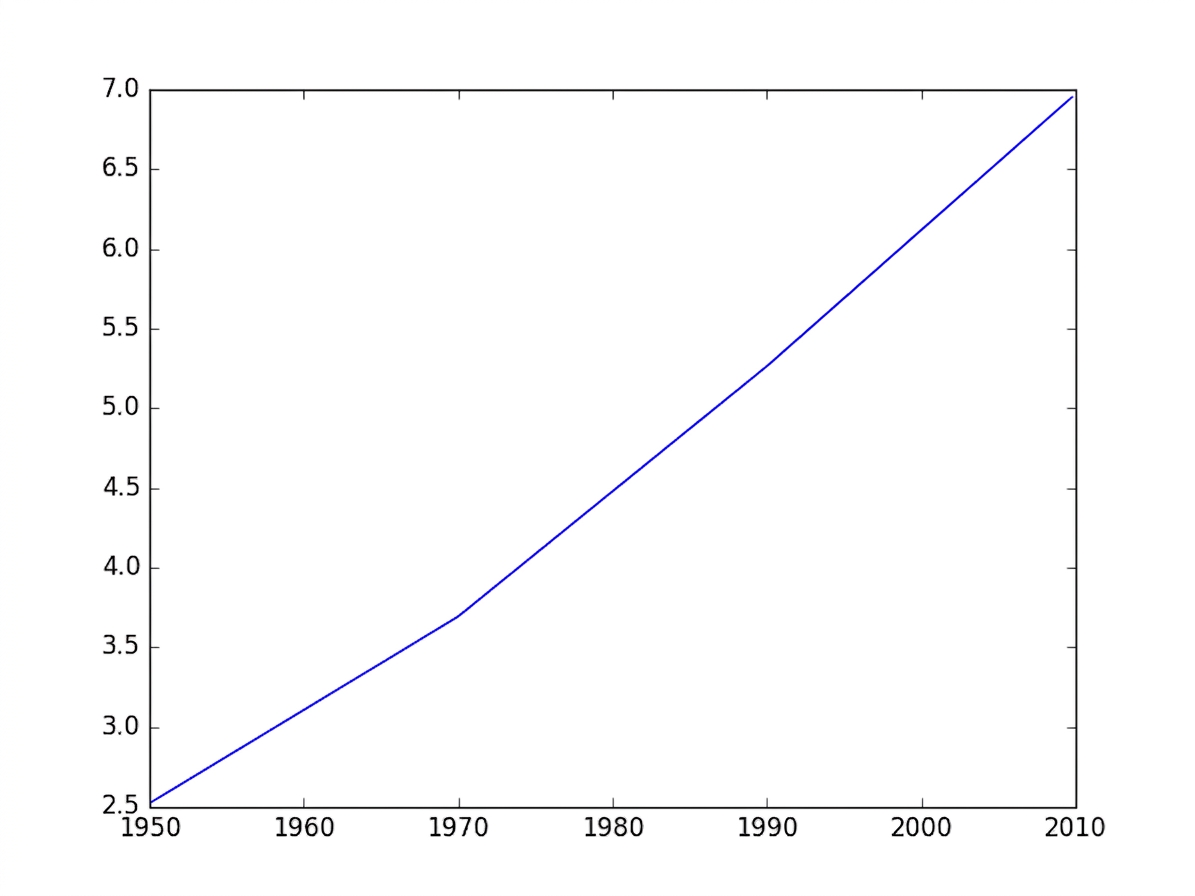
import matplotlib.pyplot as pltyear = [1950, 1970, 1990, 2010]pop = [2.519, 3.692, 5.263, 6.972]plt.plot(year, pop)plt.show()
Matplotlib
Matplotlib

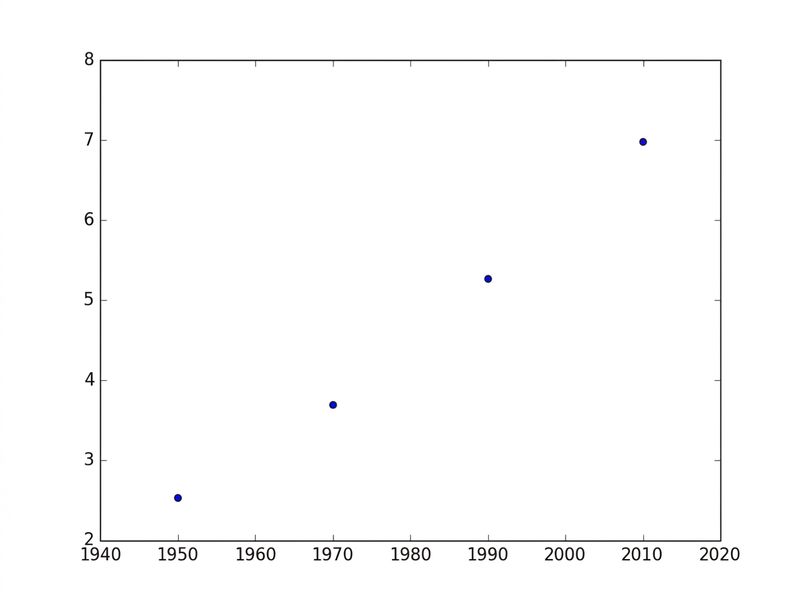
Scatter plot
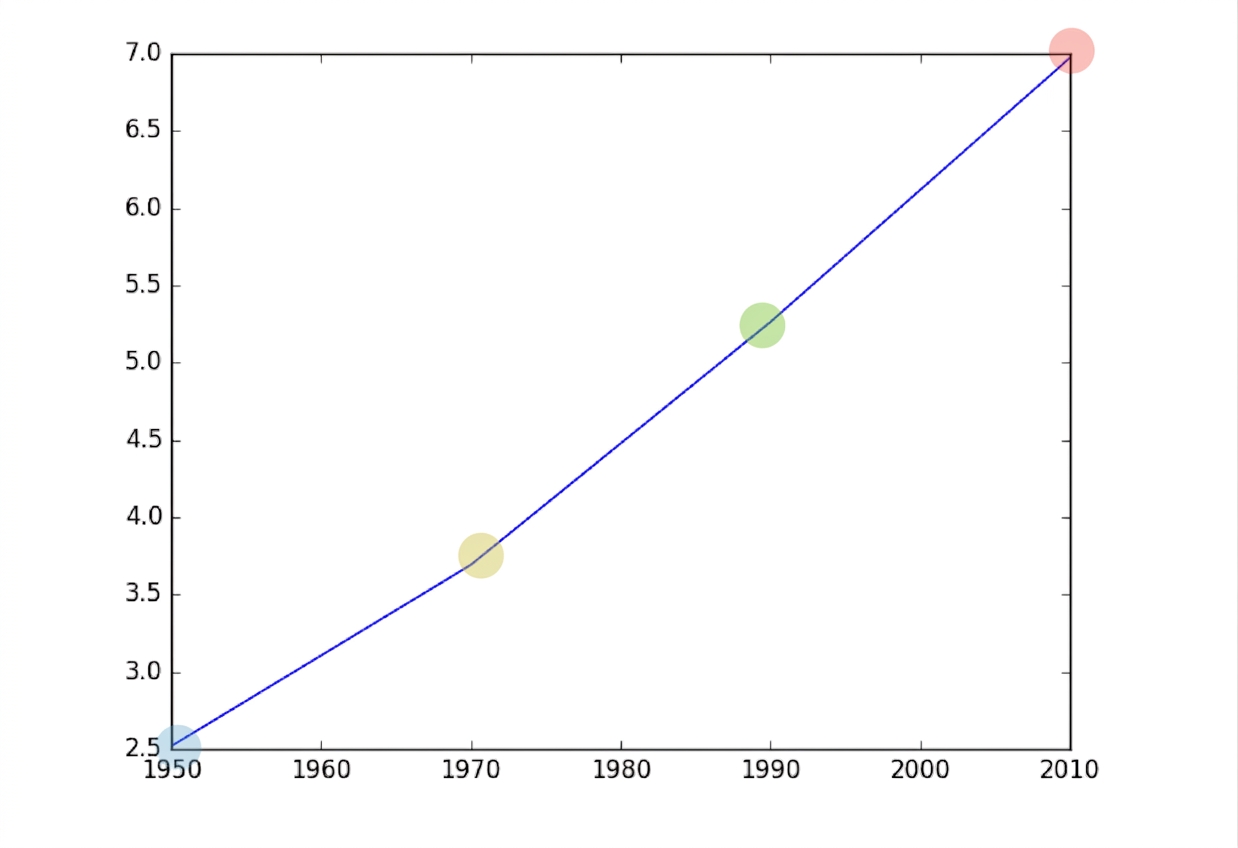
import matplotlib.pyplot as plt
year = [1950, 1970, 1990, 2010]
pop = [2.519, 3.692, 5.263, 6.972]
plt.scatter(year, pop)
plt.show()