การแจกแจงแบบไม่ต่อเนื่อง
สถิติเบื้องต้นด้วย Python

Maggie Matsui
Content Developer, DataCamp
การโยนลูกเต๋า
การโยนลูกเต๋า
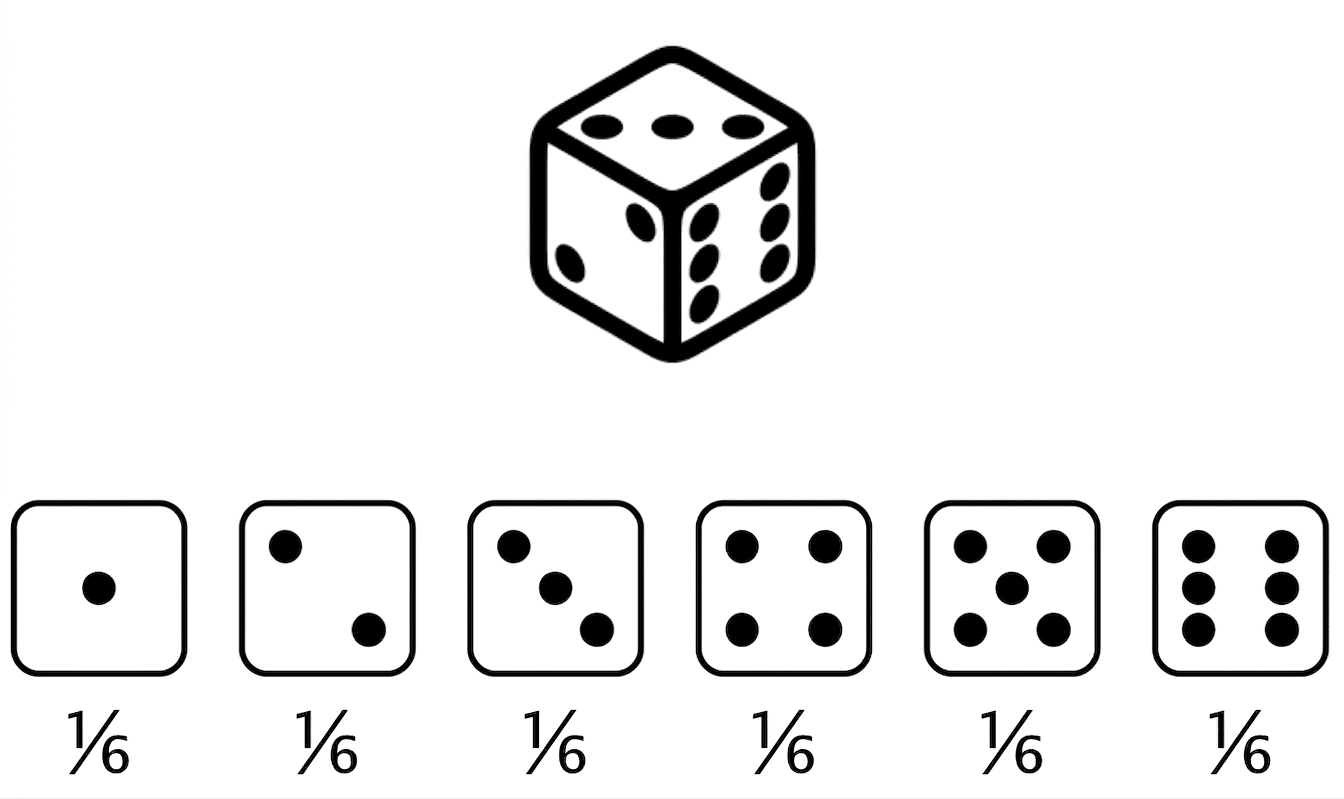
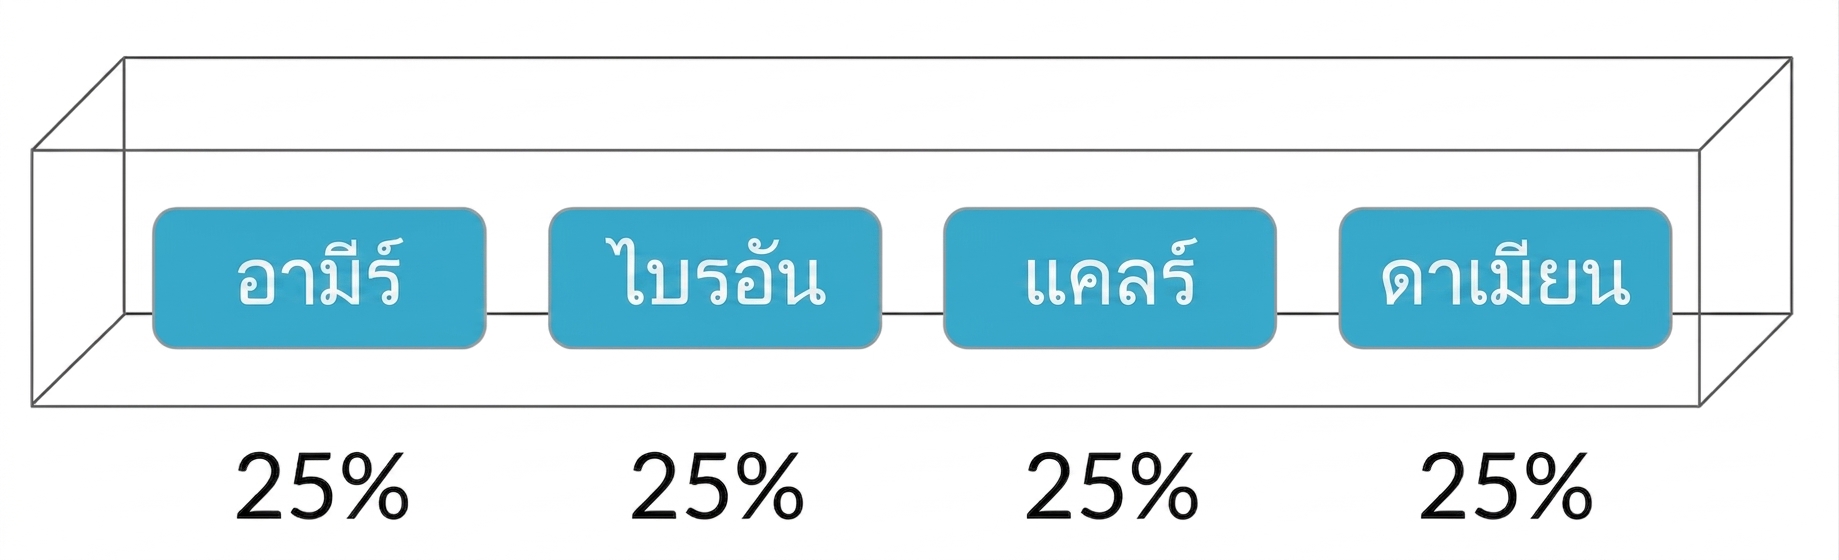
การเลือกพนักงานขาย
การแจกแจงความน่าจะเป็น
อธิบายความน่าจะเป็นของแต่ละผลลัพธ์ที่เป็นไปได้ในสถานการณ์นั้น
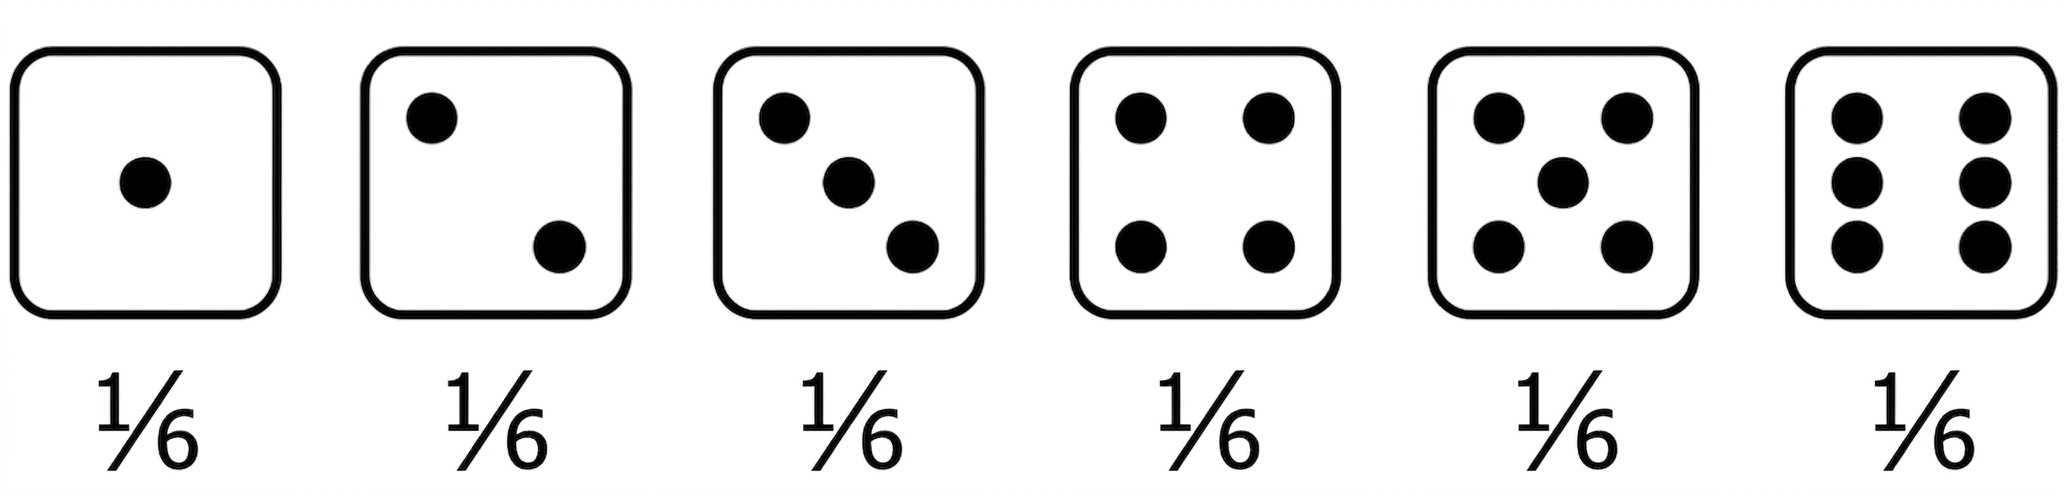
ค่าที่คาดหวัง: ค่าเฉลี่ยของการแจกแจงความน่าจะเป็น
ค่าที่คาดหวังของการโยนลูกเต๋าสมดุล = $(1 \times \frac{1}{6}) + (2 \times \frac{1}{6}) +(3 \times \frac{1}{6}) +(4 \times \frac{1}{6}) +(5 \times \frac{1}{6}) +(6 \times \frac{1}{6}) = 3.5$
การแสดงผลการแจกแจงความน่าจะเป็น
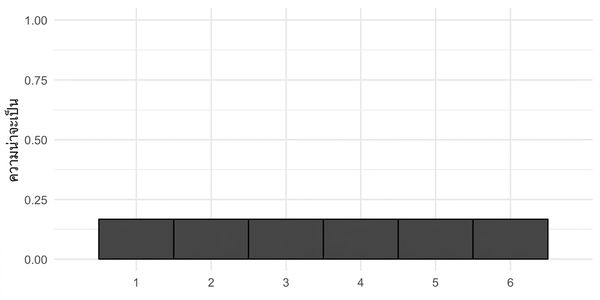
ความน่าจะเป็น = พื้นที่
$$P(\text{die roll}) \le 2 = ~?$$
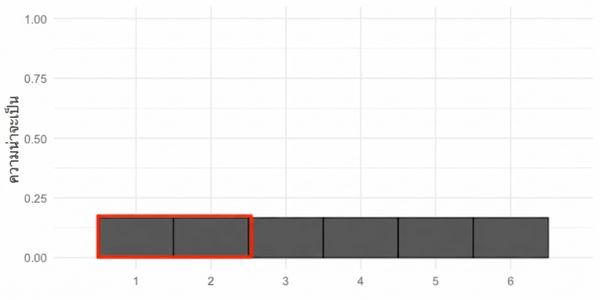
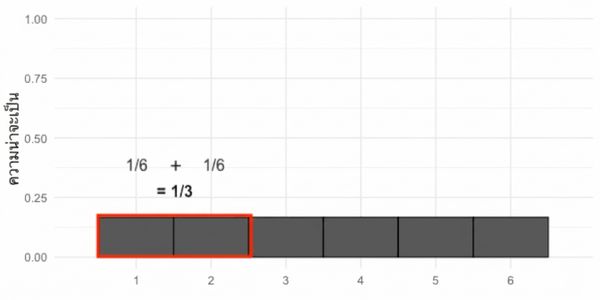
ความน่าจะเป็น = พื้นที่
$$P(\text{die roll}) \le 2 = 1/3$$
ลูกเต๋าไม่สมดุล
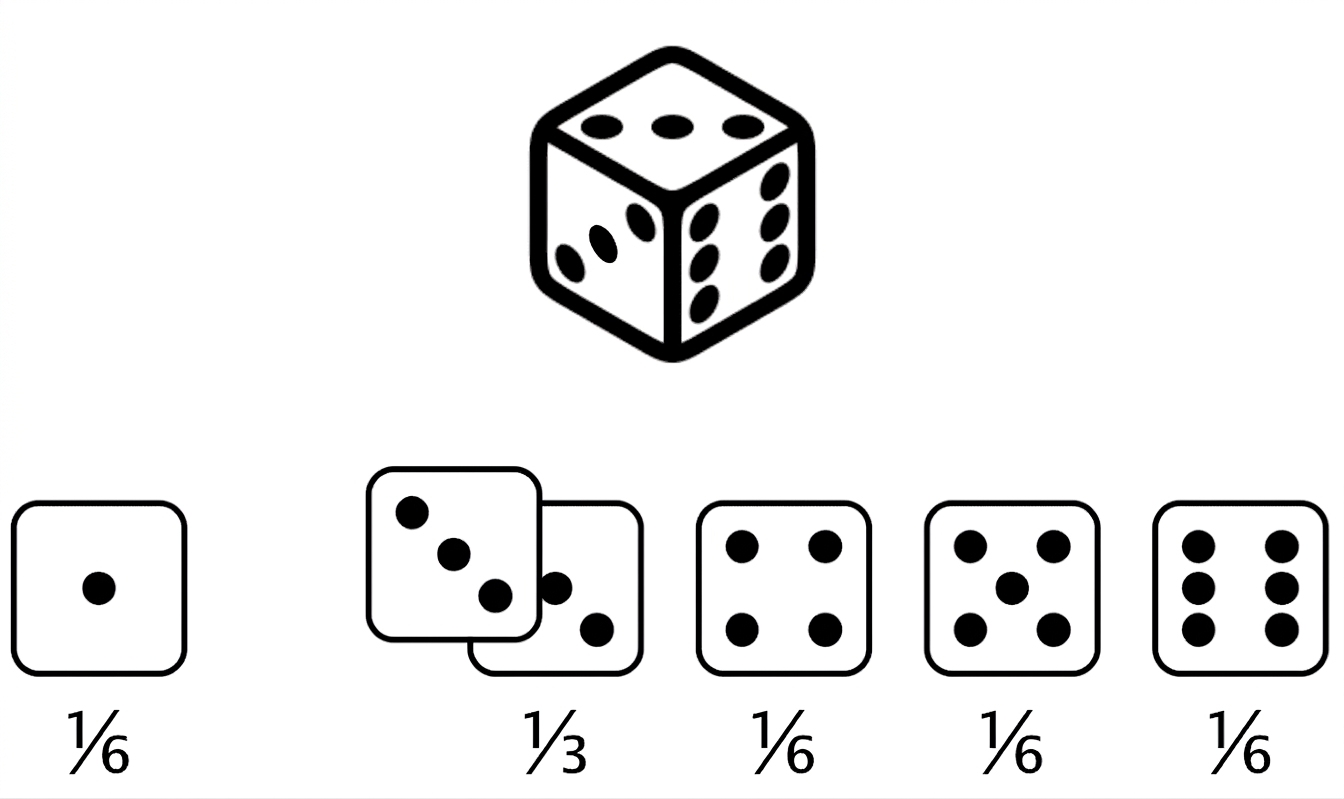
ค่าที่คาดหวังของการโยนลูกเต๋าไม่สมดุล = $(1 \times \frac{1}{6}) +(2 \times 0) +(3 \times \frac{1}{3}) +(4 \times \frac{1}{6}) +(5 \times \frac{1}{6}) +(6 \times \frac{1}{6}) = 3.67$
การแสดงผลความน่าจะเป็นที่ไม่สม่ำเสมอ
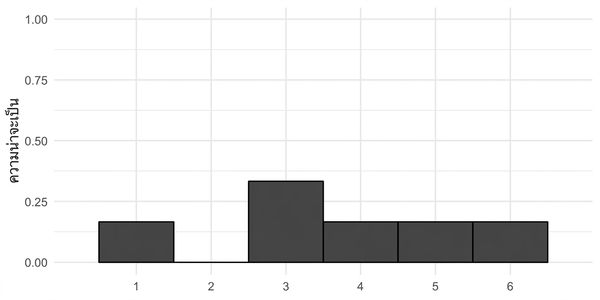
การบวกพื้นที่
$$P(\text{uneven die roll}) \le 2 = ~?$$
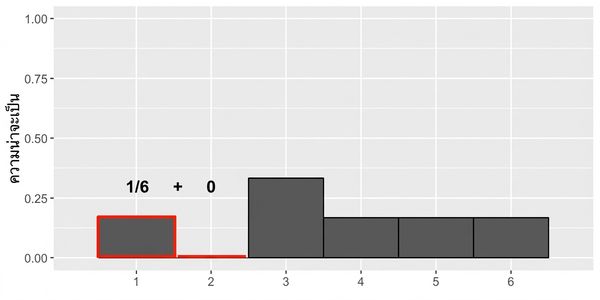
การบวกพื้นที่
$$P(\text{uneven die roll}) \le 2 = 1/6$$
การแจกแจงความน่าจะเป็นแบบไม่ต่อเนื่อง
อธิบายความน่าจะเป็นสำหรับผลลัพธ์แบบไม่ต่อเนื่อง
ลูกเต๋าสมดุล
การแจกแจงสม่ำเสมอแบบไม่ต่อเนื่อง
ลูกเต๋าไม่สมดุล
การแสดงผลตัวอย่าง
rolls_10['number'].hist(bins=np.linspace(1,7,7))
plt.show()
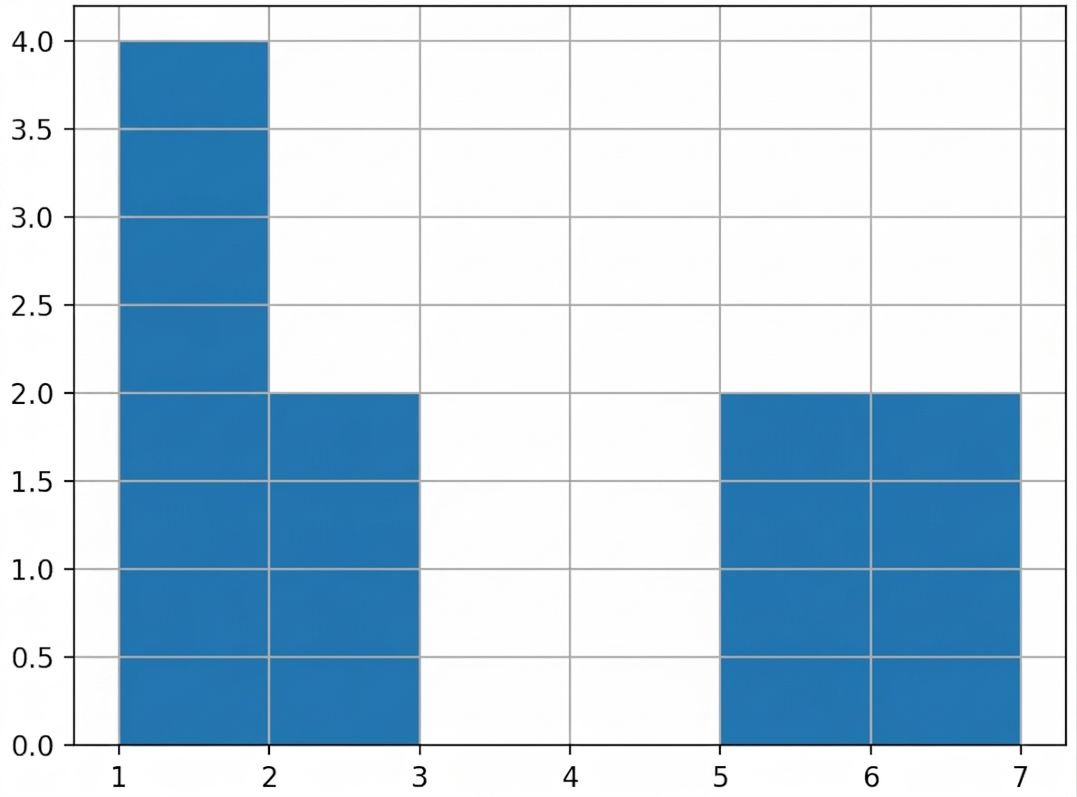
การแจกแจงของตัวอย่าง vs. การแจกแจงเชิงทฤษฎี
ตัวอย่างการโยน 10 ครั้ง
np.mean(rolls_10['number']) = 3.0
การแจกแจงความน่าจะเป็นเชิงทฤษฎี
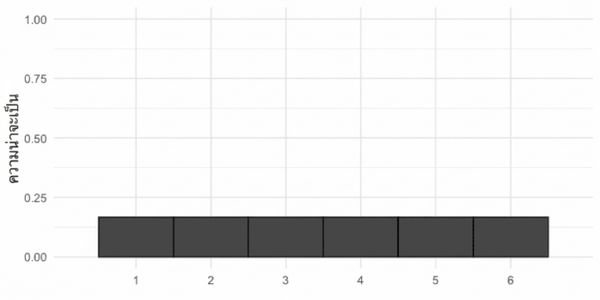
mean(die['number']) = 3.5
ตัวอย่างที่ใหญ่ขึ้น
ตัวอย่างการโยน 100 ครั้ง
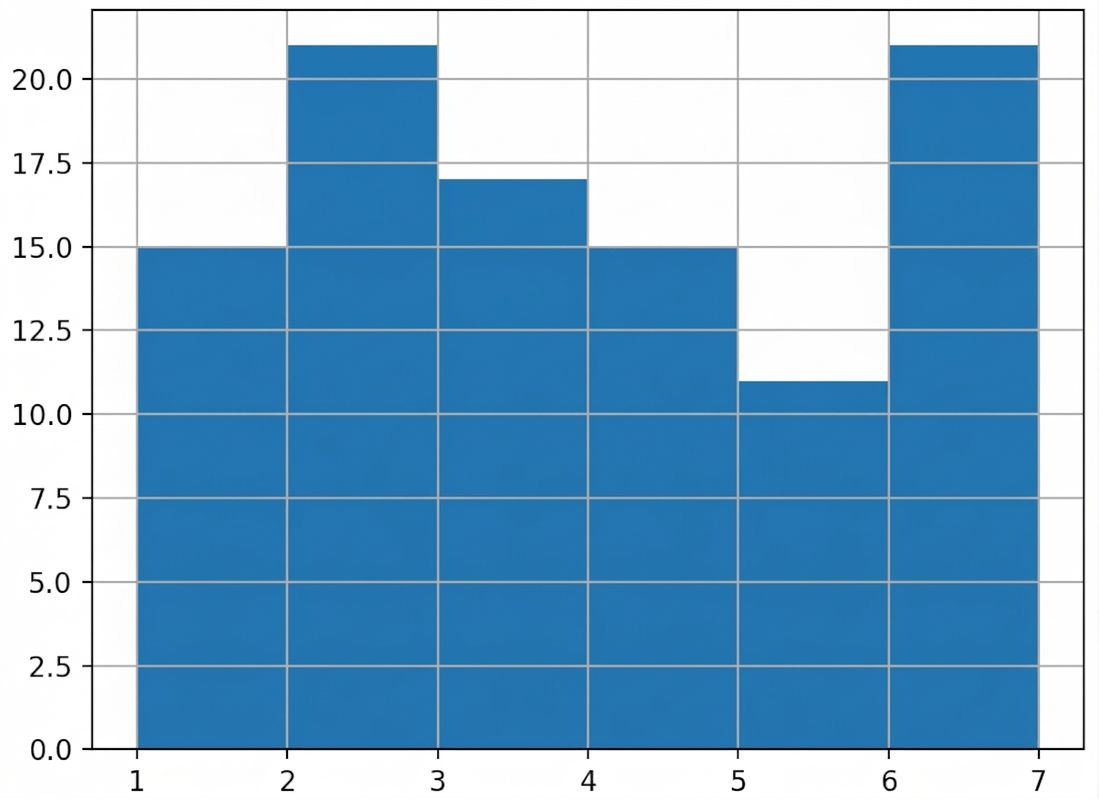
np.mean(rolls_100['number']) = 3.4
การแจกแจงความน่าจะเป็นเชิงทฤษฎี
mean(die['number']) = 3.5
ตัวอย่างที่ใหญ่ขึ้นอีก
ตัวอย่างการโยน 1000 ครั้ง
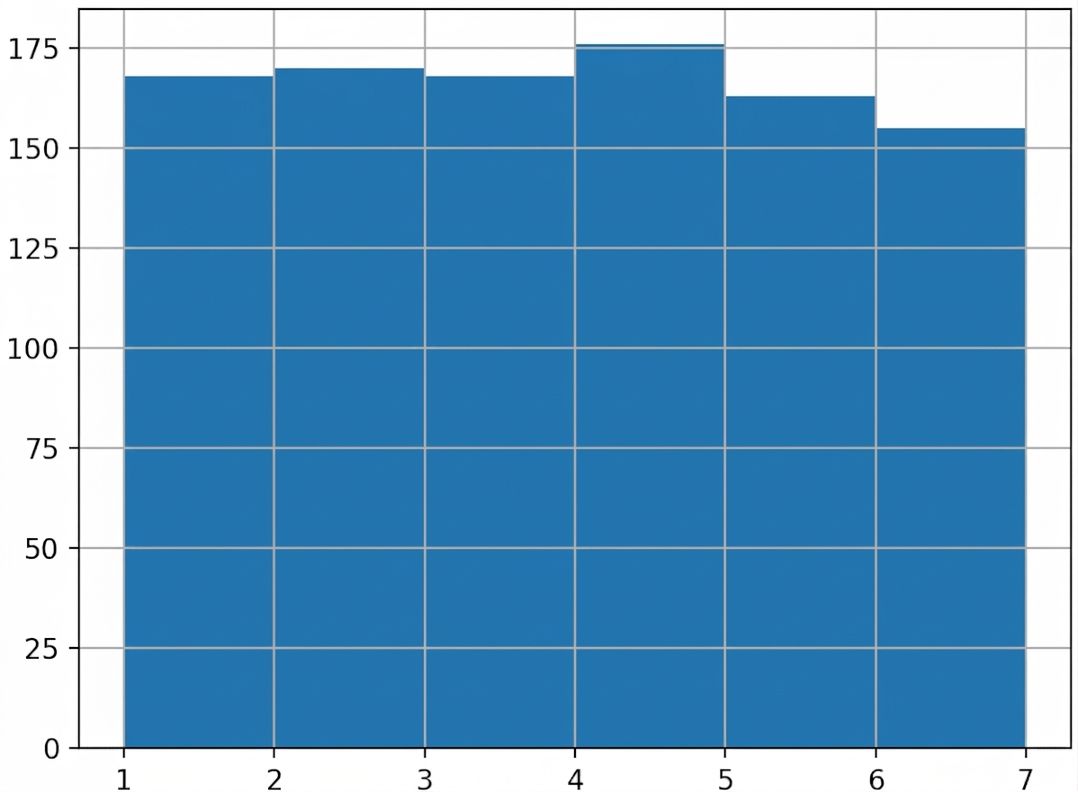
np.mean(rolls_1000['number']) = 3.48
การแจกแจงความน่าจะเป็นเชิงทฤษฎี
mean(die['number']) = 3.5

