Turning data into insights

Working with Microsoft Copilot

Susanth Sutheesh

Copilot Solution Engineer, Microsoft

Why Excel and Visual Reasoning?
 

  • Visual reasoning: turning numbers into a table, chart or summary you can think with
  • Copilot reads your data and works out the analysis
  • It writes the formulas and builds the charts for you


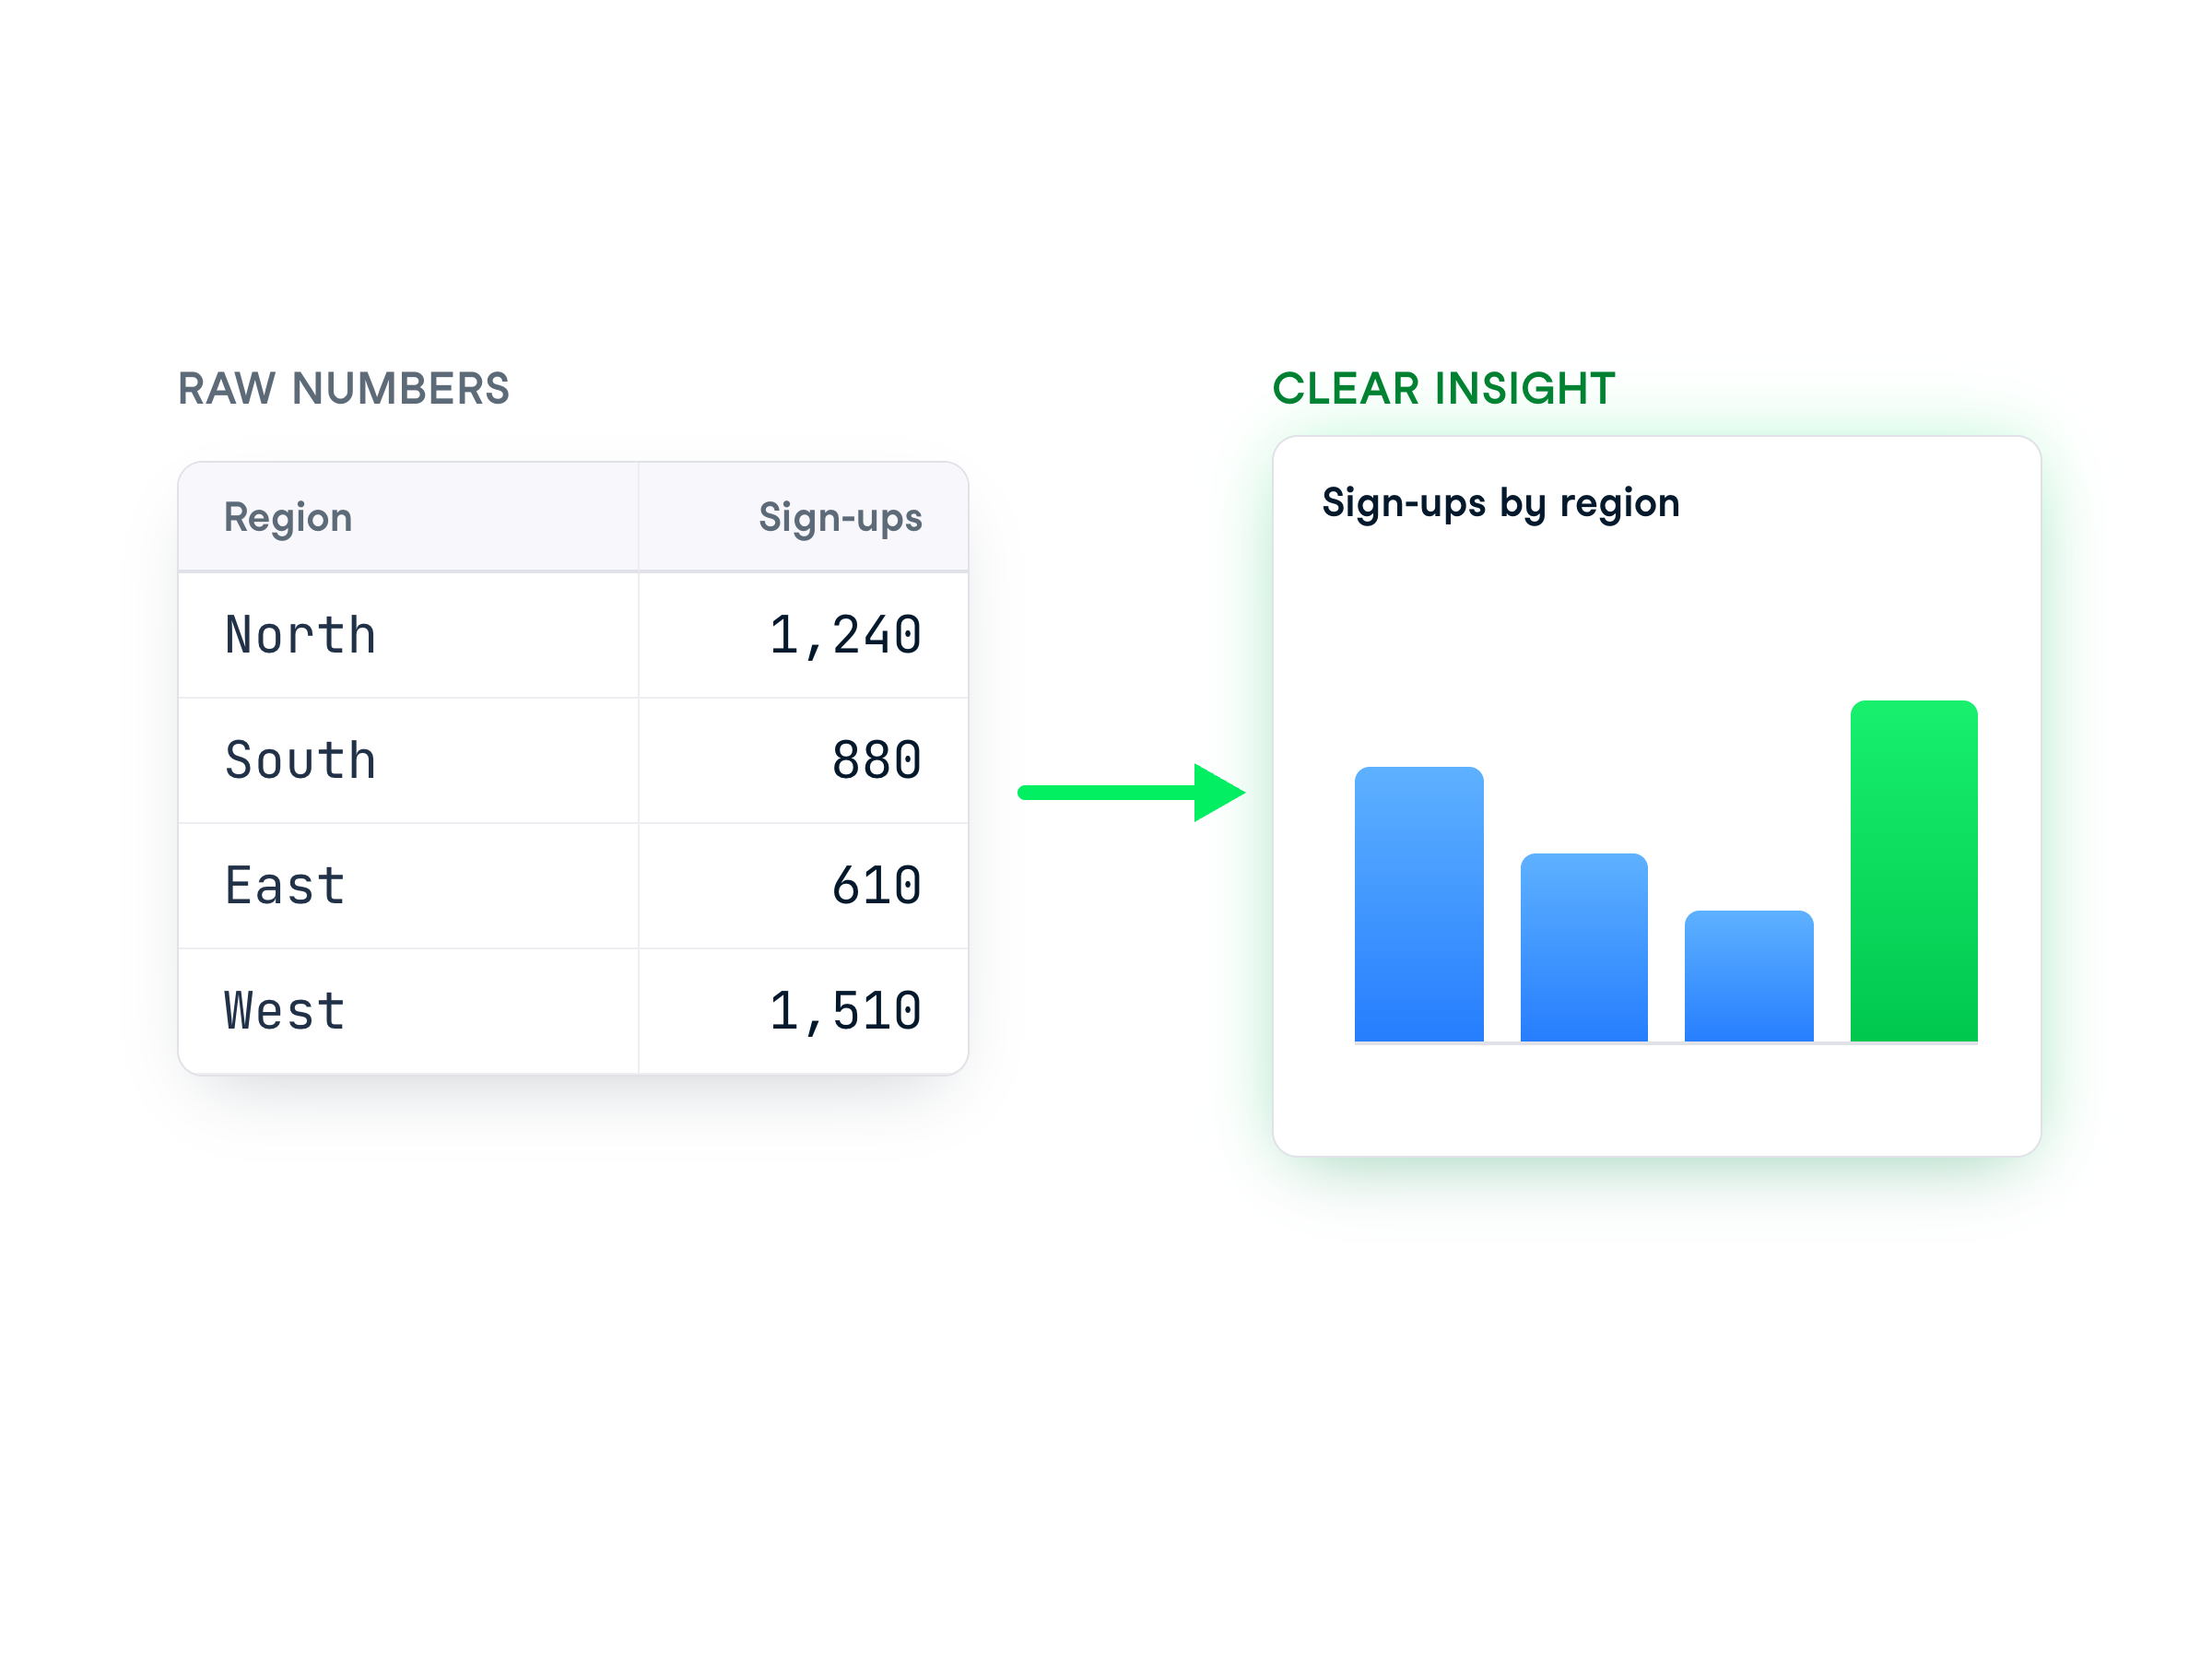
A table of raw regional sign-up numbers turning into a clean bar chart, showing how Copilot converts numbers into a clear visual

Working with Microsoft Copilot

Why Excel and Visual Reasoning?


It can also:

  • Summarize what a sheet actually contains
  • Surface trends, outliers and totals
  • Add a formula column for a calculation you describe
  • Build a chart, then reshape it on request


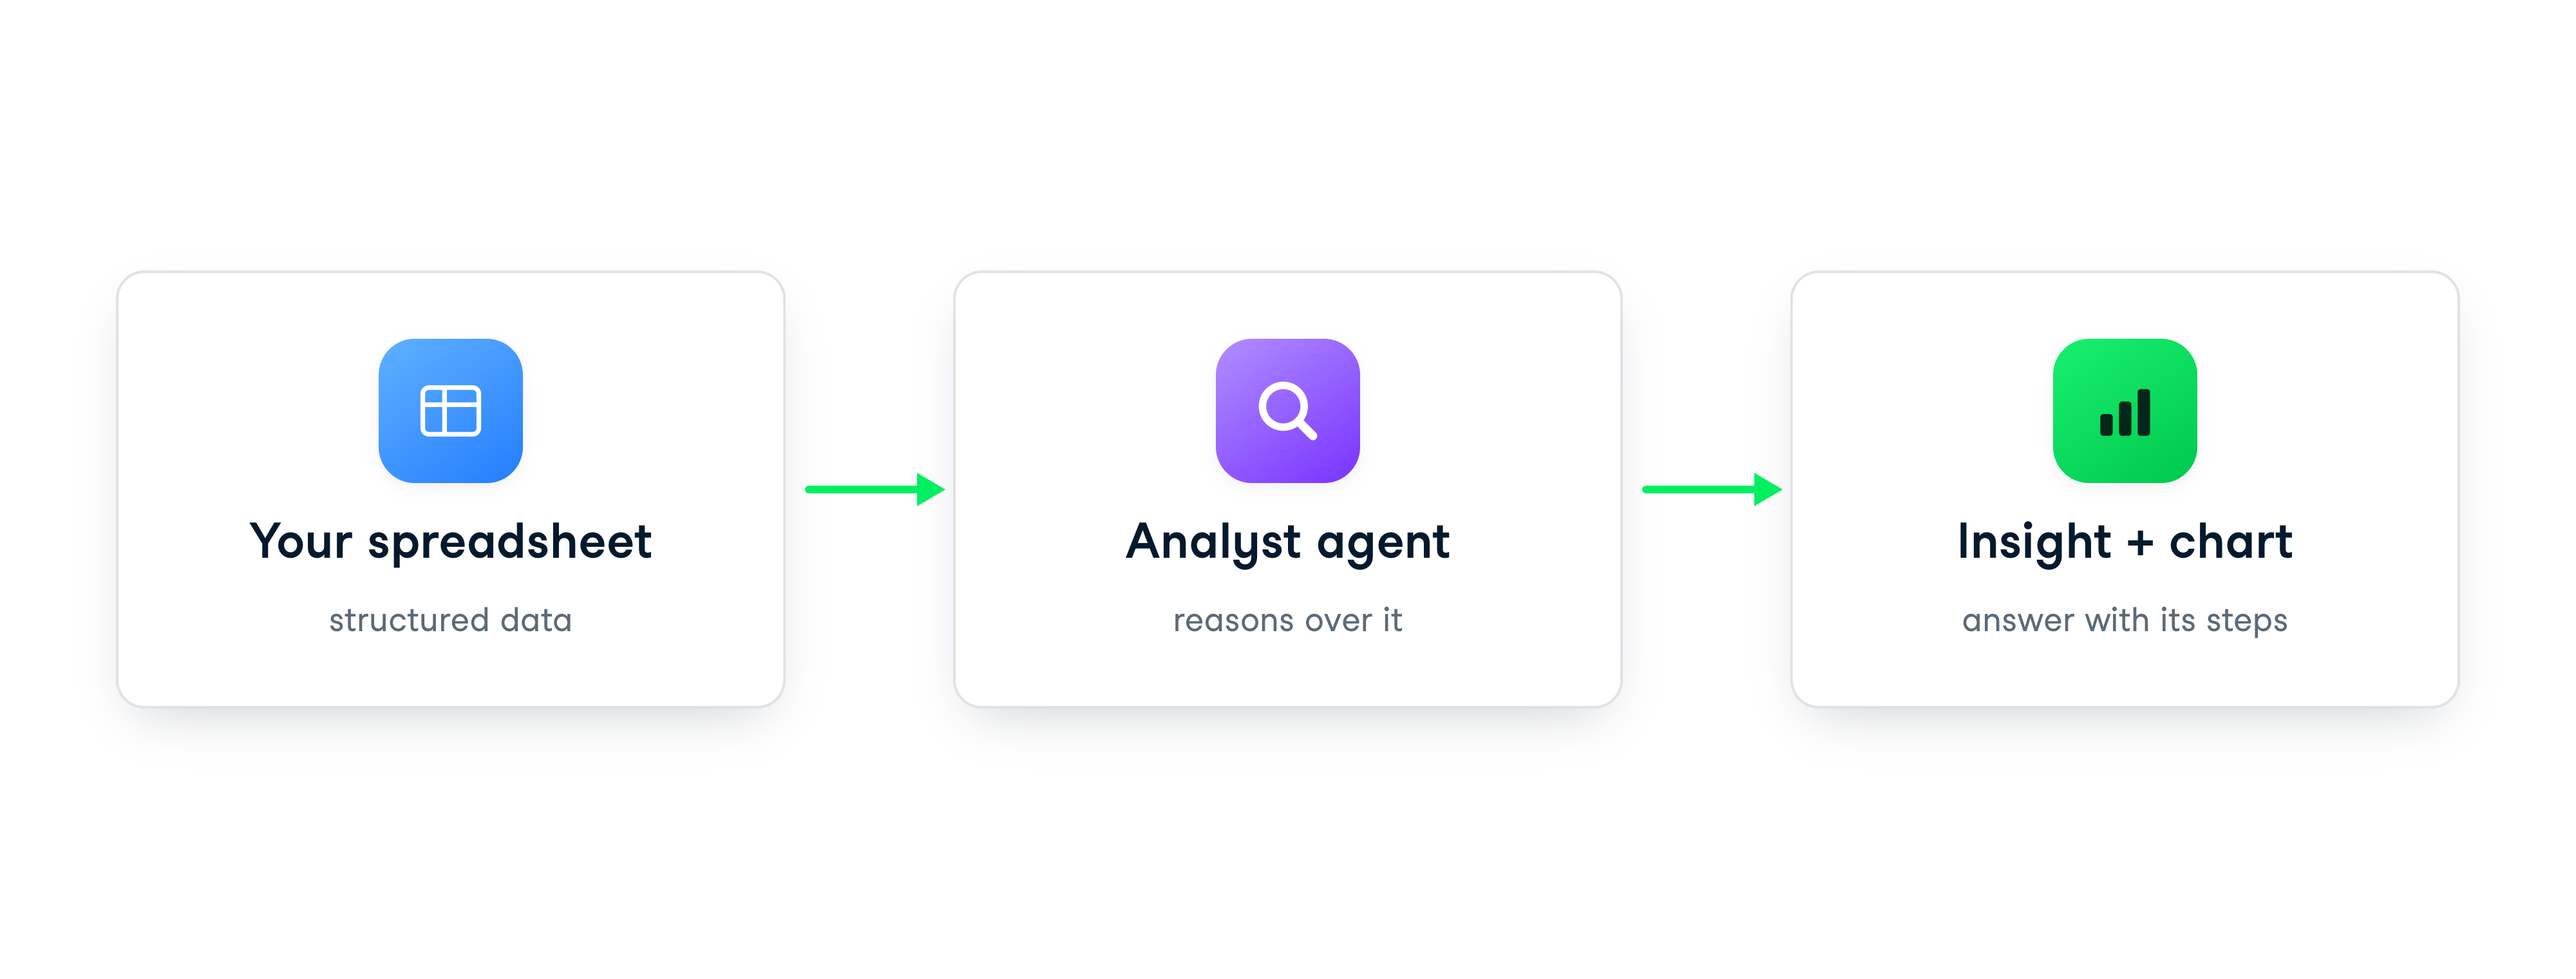
Diagram: your spreadsheet feeds an Analyst agent that returns an insight and a chart

Working with Microsoft Copilot

From data to a summary table

  • Copilot App - attach and ask
  • Excel for the web - use Copilot natively

$$

In the Copilot app, with the file attached

Upload your data, then ask for a summary:

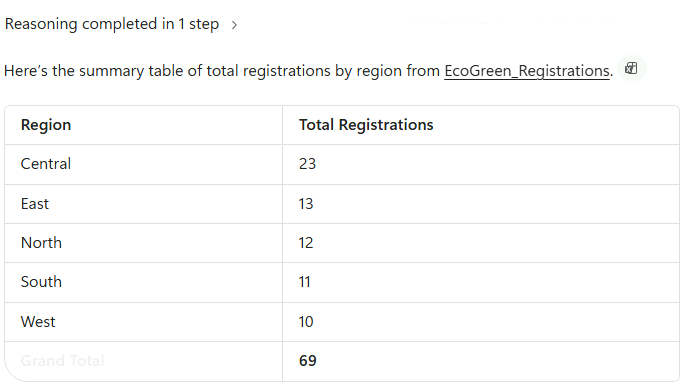
Using the attached file, show total registrations by region as a summary table


Copilot's summary table of registrations by region

Working with Microsoft Copilot

Refining for visuals


Refine the table into a chart:

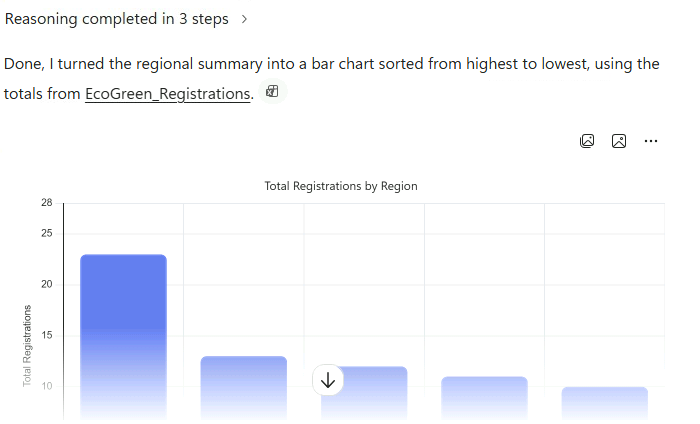
Now show that as a bar chart, sorted from highest to lowest


Copilot's sorted bar chart of registrations by region

Working with Microsoft Copilot

Visual reasoning beyond Excel


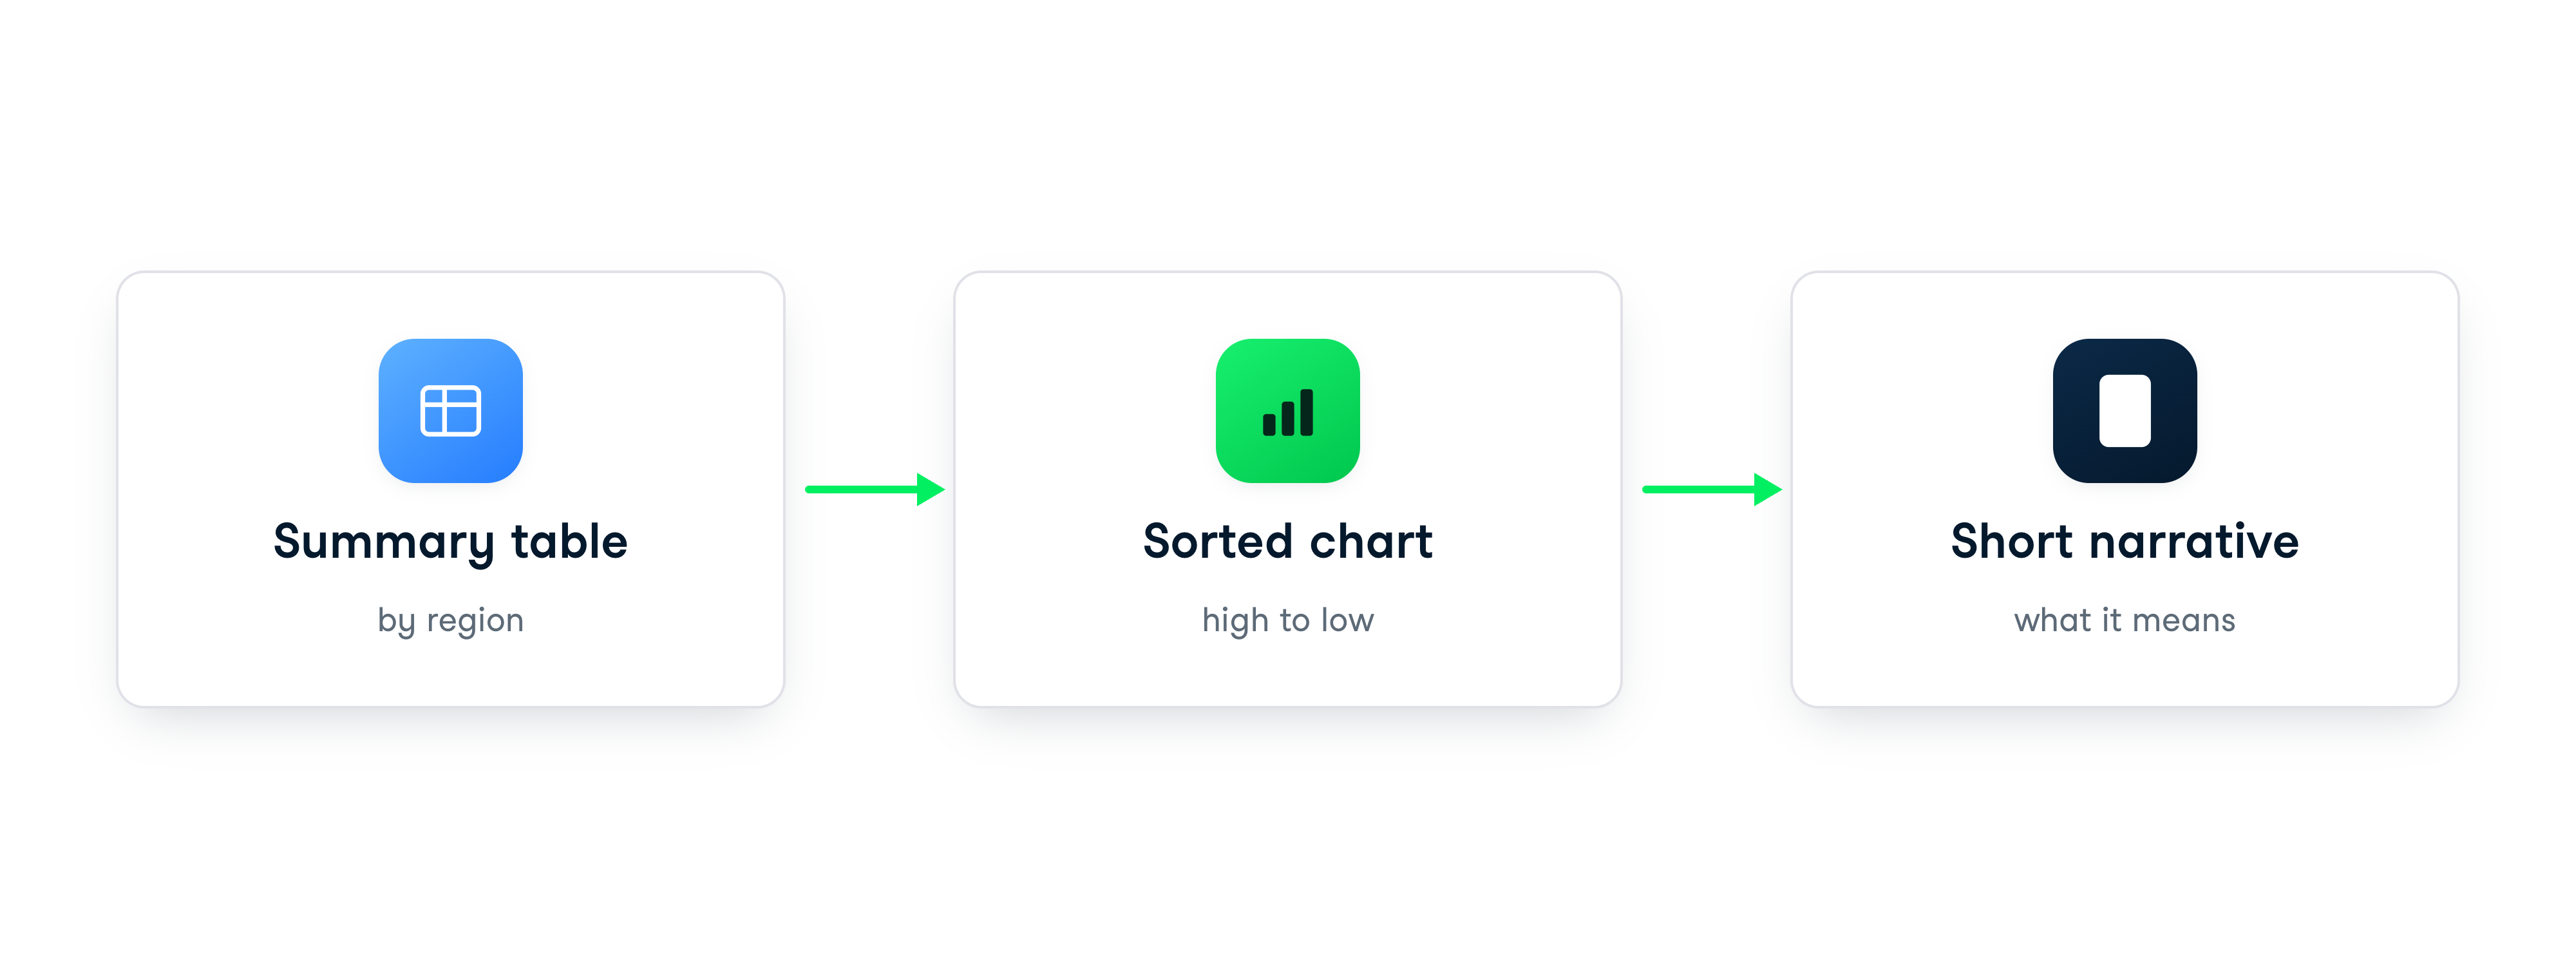
A progression from a summary table to a sorted chart to a short narrative


  • In Word, Copilot turns text into tables
  • In PowerPoint, you can create charts for slides from described data
Working with Microsoft Copilot

Visual reasoning beyond Excel

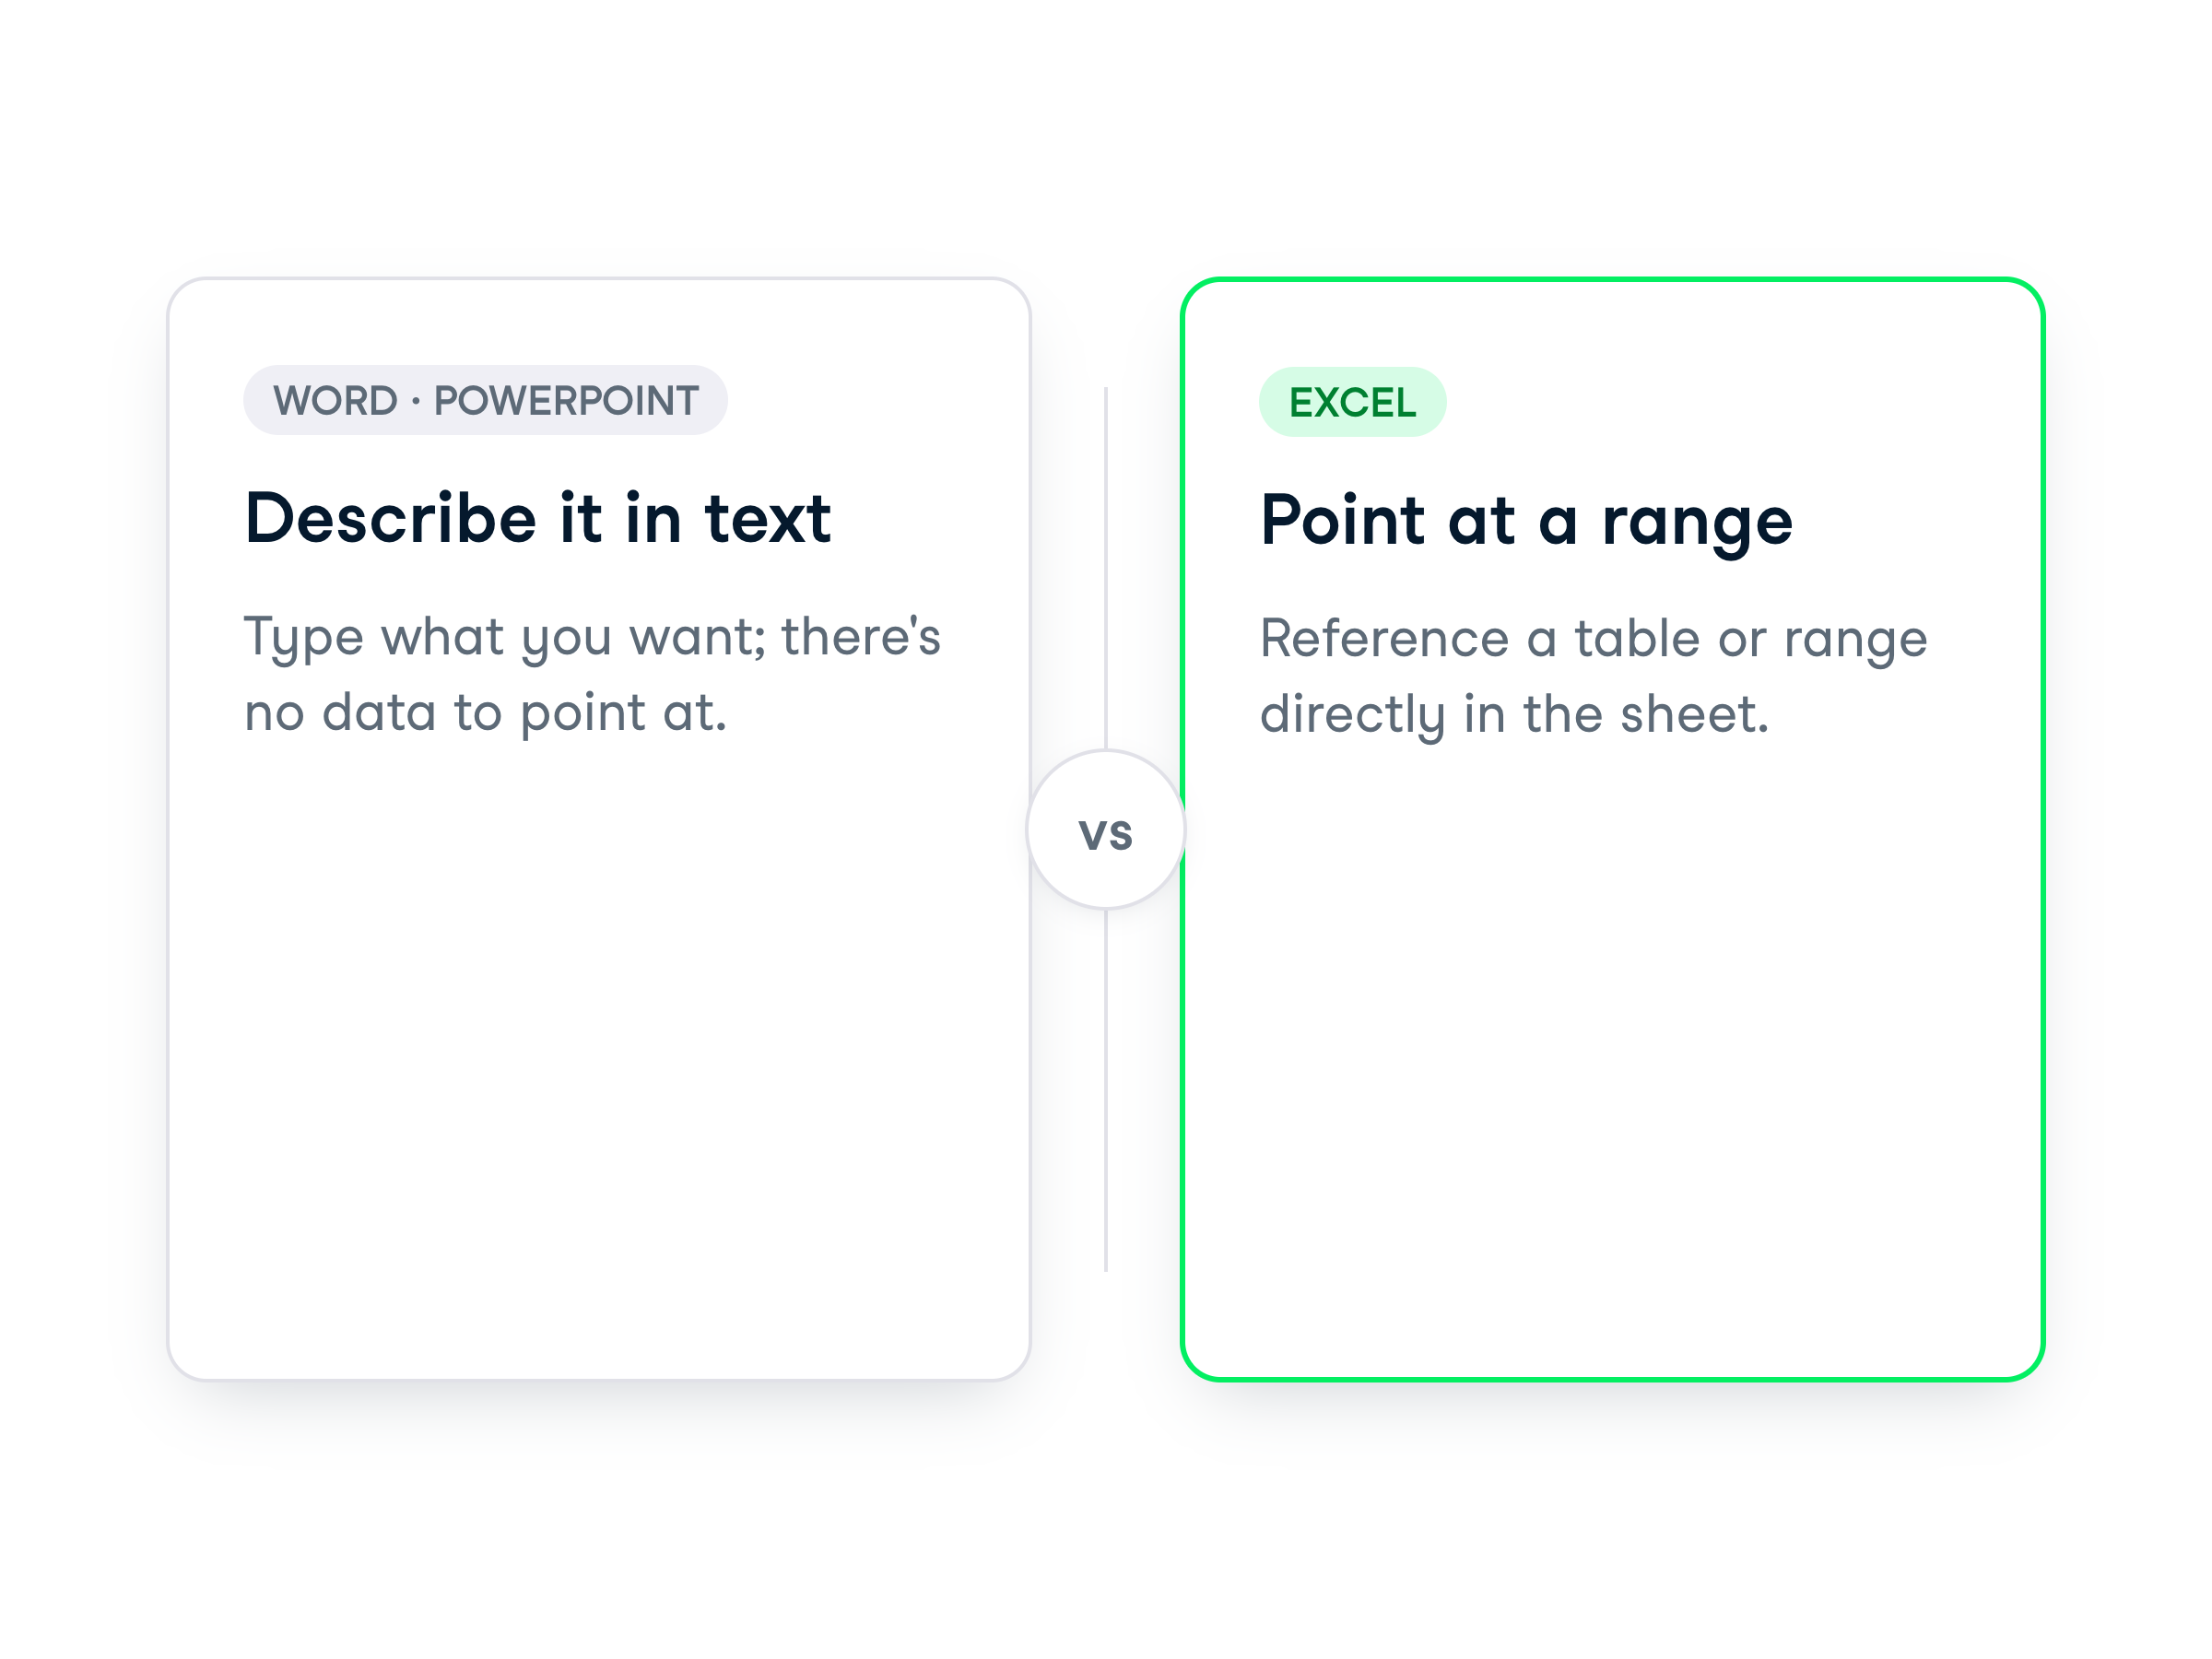
A side-by-side comparison: Word and PowerPoint take text-only instructions, while Excel lets you point Copilot at a table or range

Working with Microsoft Copilot

Best practices in Excel with Copilot

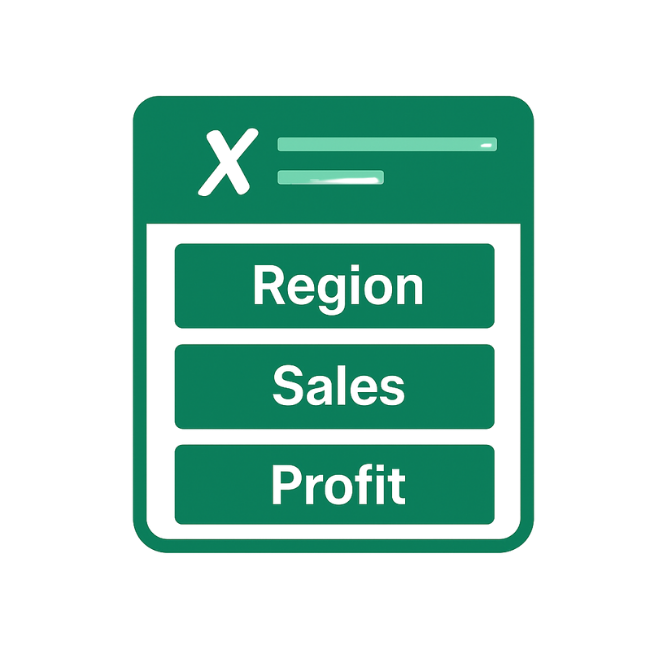
Illustration of a green Excel sheet showing labeled columns for Region, Sales, and Profit, symbolizing clear data organization

$$

  • Always use precise column names when referring to data
  • Clearly specify chart types and axis labels
  • Refine step by step to highlight what matters most
Working with Microsoft Copilot

Let's practice!

Working with Microsoft Copilot

Preparing Video For Download...