Introduction aux DataFrames PySpark
Introduction à PySpark

Benjamin Schmidt
Data Engineer
À propos des DataFrames
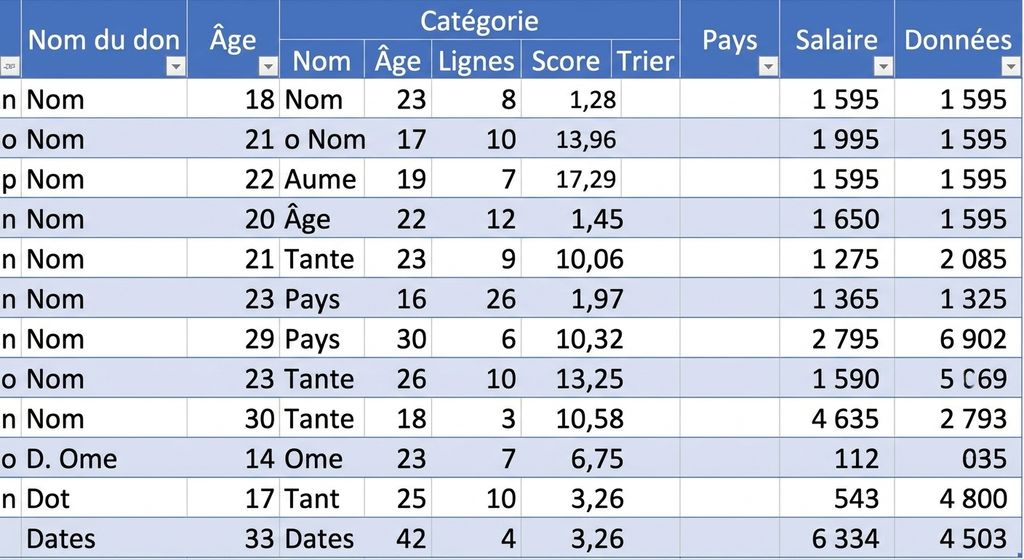
- DataFrames : format tabulaire (lignes/colonnes)
- Prend en charge des opérations de type SQL
- Comparable à un DataFrame Pandas ou à une TABLE SQL
- Données structurées
Créer des DataFrames à partir de filestores
# Create a DataFrame from CSV
census_df = spark.read.csv('path/to/census.csv', header=True, inferSchema=True)
Afficher le DataFrame
# Show the first 5 rows of the DataFrame
census_df.show()
   age  education.num marital.status         occupation income
0   90              9        Widowed                  ?  <=50K
1   82              9        Widowed    Exec-managerial  <=50K
2   66             10        Widowed                  ?  <=50K
3   54              4       Divorced  Machine-op-inspct  <=50K
4   41             10      Separated     Prof-specialty  <=50K
Afficher le schéma du DataFrame
# Show the schema census_df.printSchema()Output: root |-- age: integer (nullable = true) |-- education.num: integer (nullable = true) |-- marital.status: string (nullable = true) |-- occupation: string (nullable = true) |-- income: string (nullable = true)
Analytique de base sur les DataFrames PySpark
# .count() will return the total row numbers in the DataFrame
row_count = census_df.count()
print(f'Number of rows: {row_count}')
# groupby() allows the use of sql-like aggregations
census_df.groupBy('gender').agg({'salary_usd': 'avg'}).show()
Autres fonctions d'agrégation :
sum()min()max()
Fonctions clés pour l'analytique PySpark
.select(): sélectionne des colonnes précises du DataFrame.filter(): filtre des lignes selon des conditions.groupBy(): regroupe des lignes par une ou plusieurs colonnes.agg(): applique des fonctions d'agrégation aux groupes
Exemple de fonctions clés
# Using filter and select, we can narrow down our DataFrame filtered_census_df = census_df.filter(df['age'] > 50).select('age', 'occupation') filtered_census_df.show()Output +---+------------------+ |age| occupation | +---+------------------+ | 90| ?| | 82| Exec-managerial| | 66| ?| | 54| Machine-op-inspct| +---+------------------+
Passons à la pratique !
Introduction à PySpark

