Mises en garde sur la corrélation
Introduction aux statistiques avec R

Maggie Matsui
Content Developer, DataCamp
Relations non linéaires
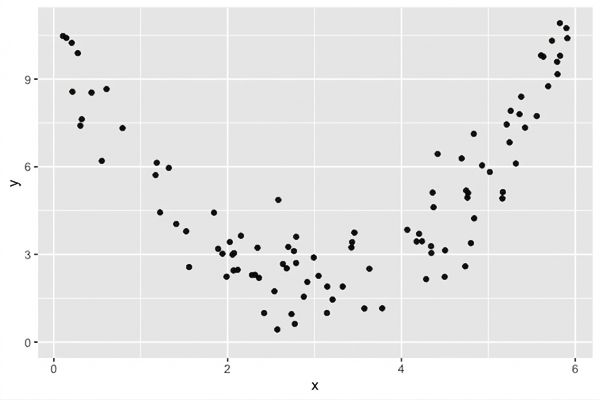
$$r = 0.18$$
Relations non linéaires
Ce que nous voyons :
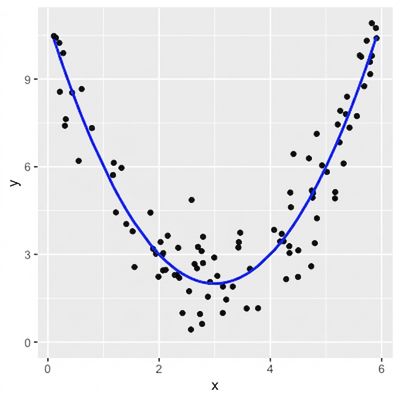
Ce que « voit » le coefficient de corrélation :
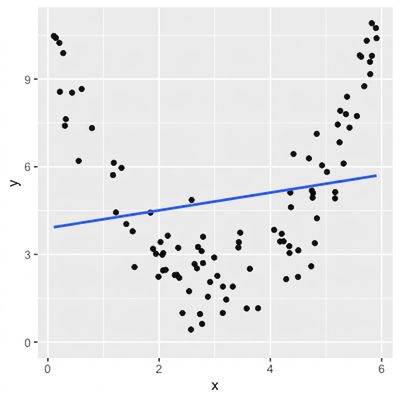
La corrélation ne capte que les relations linéaires
Visualisez toujours vos données
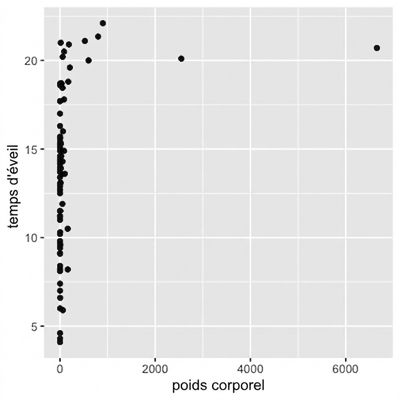
Poids corporel et temps éveillé
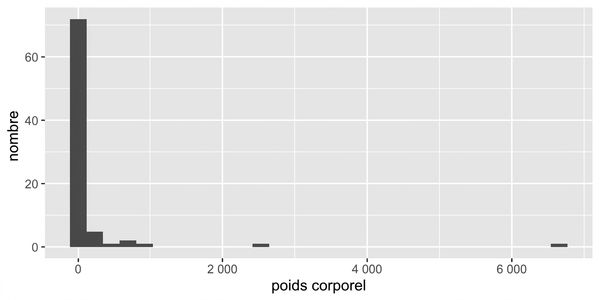
Distribution du poids corporel
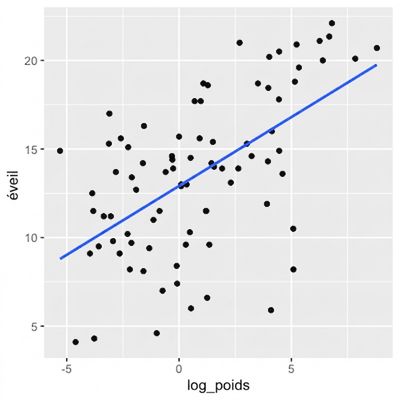
Transformation logarithmique
Corrélation n'implique pas causalité
x est corrélé à y ne veut pas dire x cause y
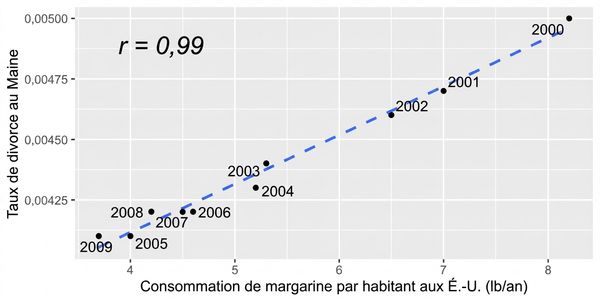
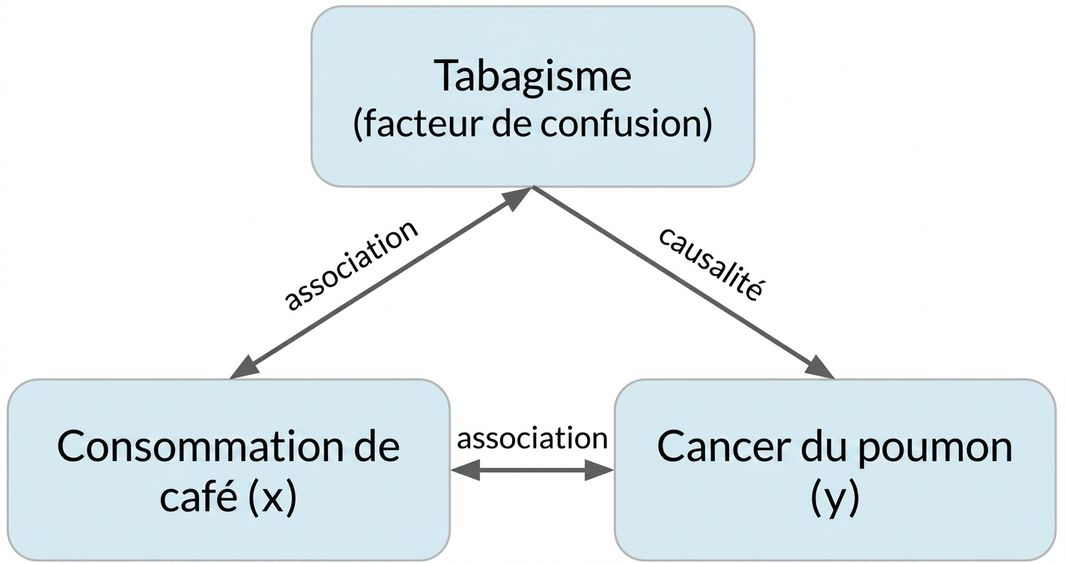
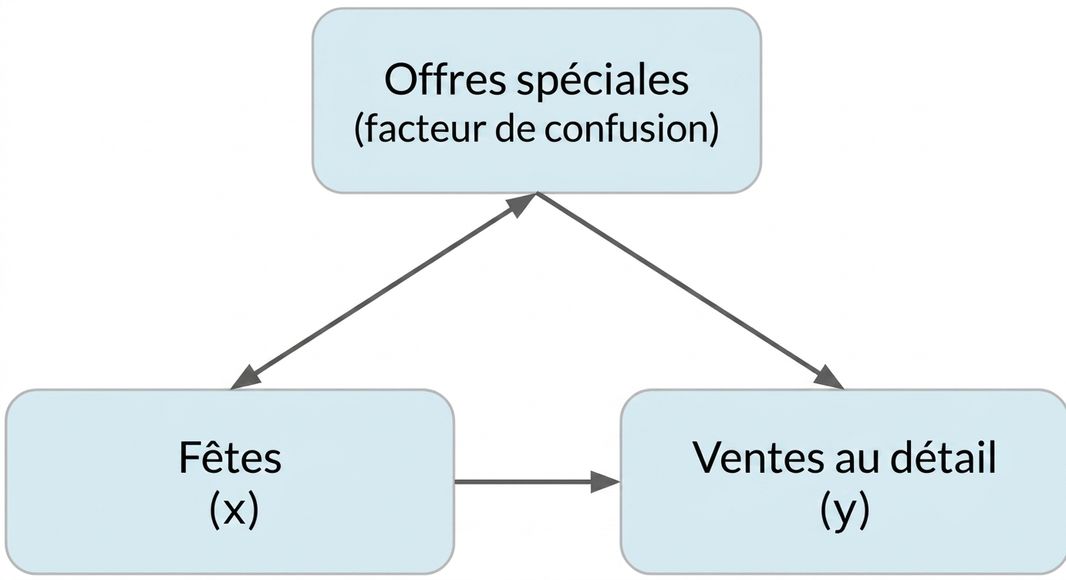
Facteur de confusion
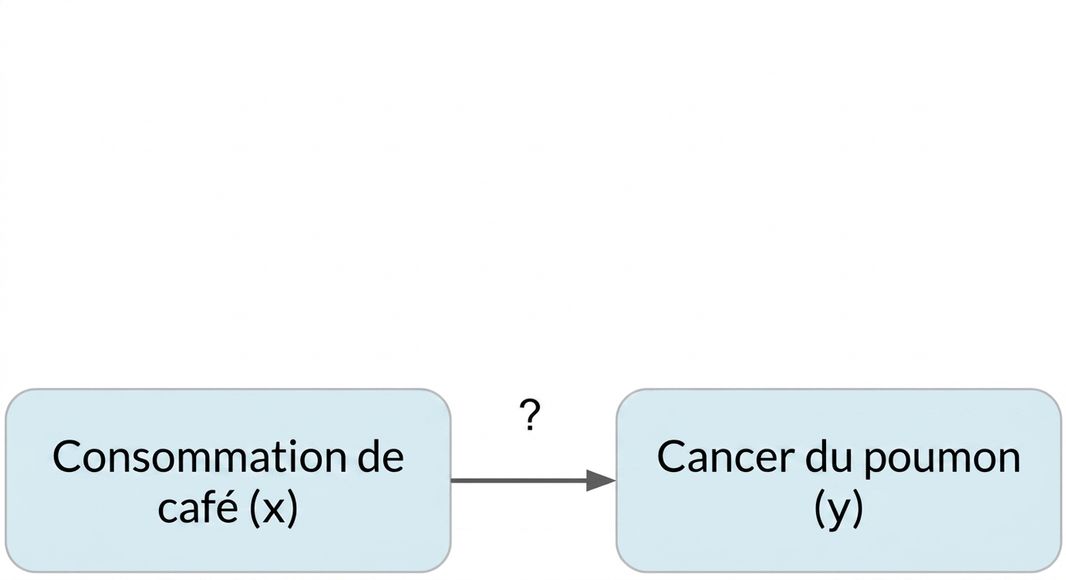
Facteur de confusion
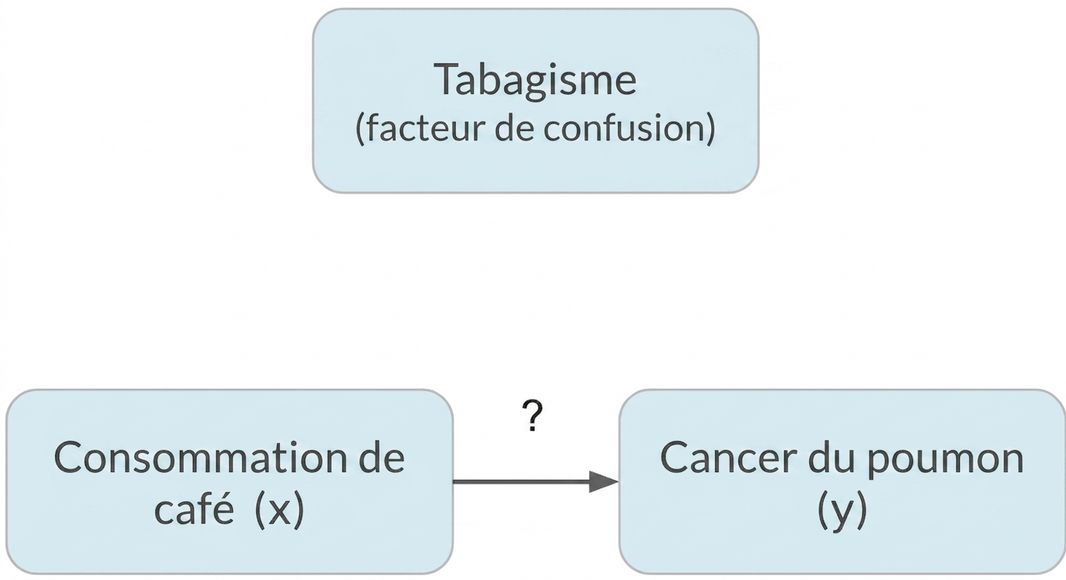
Facteur de confusion
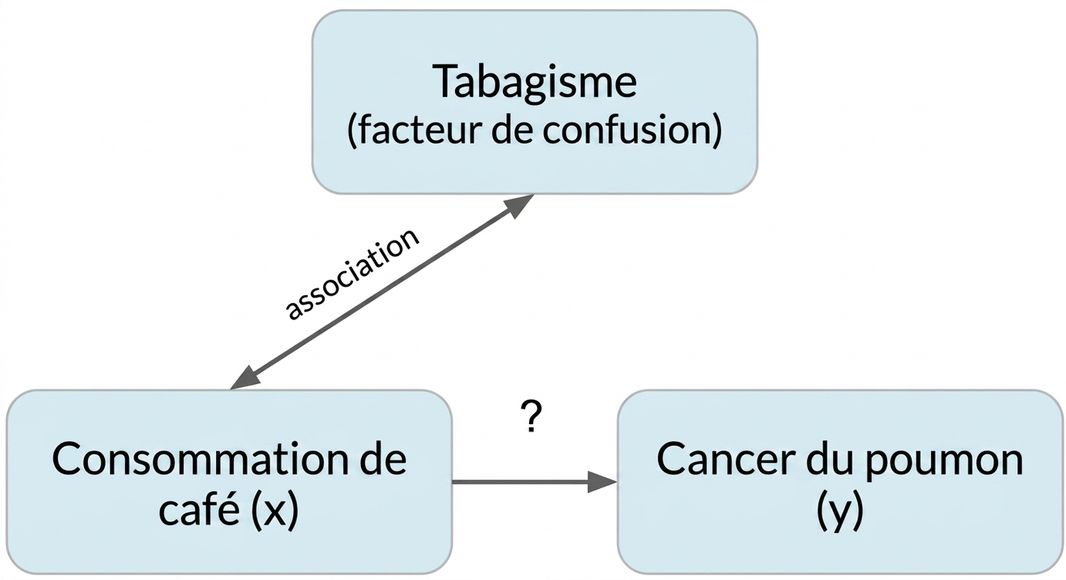
Facteur de confusion
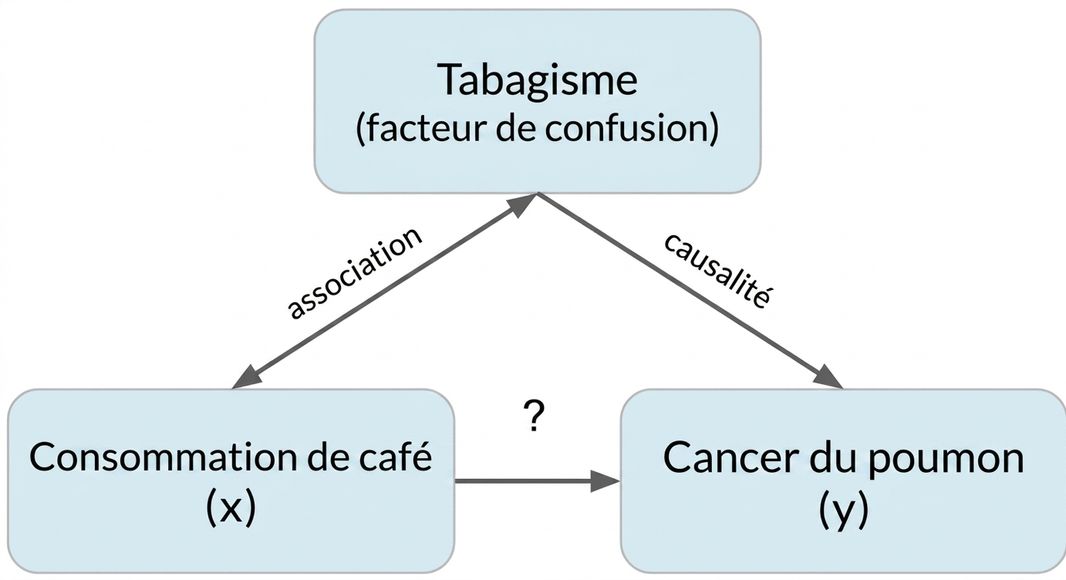
Facteur de confusion