Ajouter du style

Introduction à la science des données avec Python

Hillary Green-Lerman

Senior Curriculum Lead, DataCamp

Et bien du chemin à faire
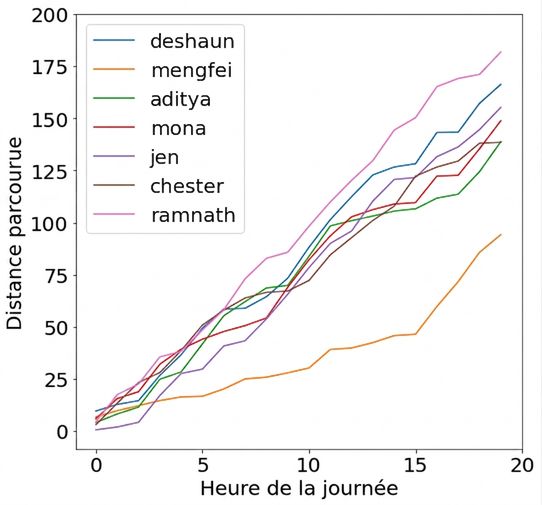
voiture de police

graphique de conduite

Introduction à la science des données avec Python

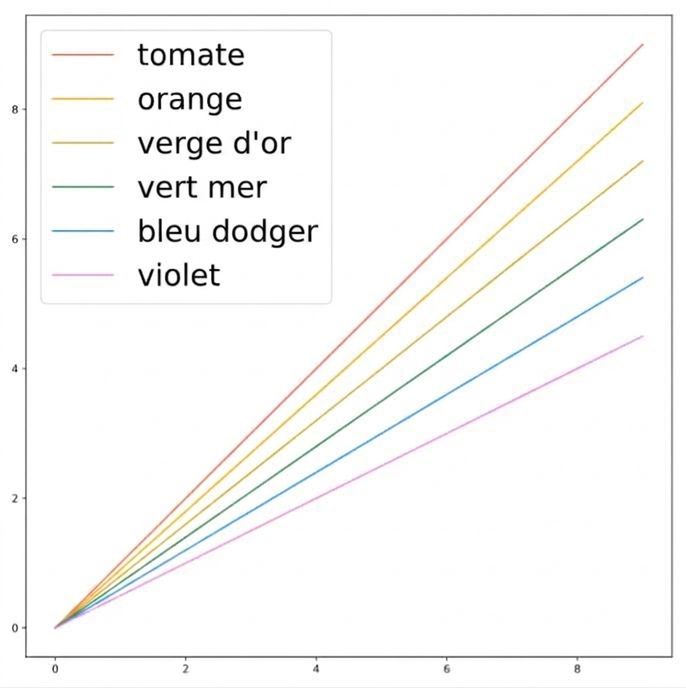
Changer la couleur des lignes

plt.plot(x, y1, color="tomato")
plt.plot(x, y2, color="orange")
plt.plot(x, y3, color="goldenrod")
plt.plot(x, y4, color="seagreen")
plt.plot(x, y5, color="dodgerblue")
plt.plot(x, y6, color="violet")

Introduction à la science des données avec Python

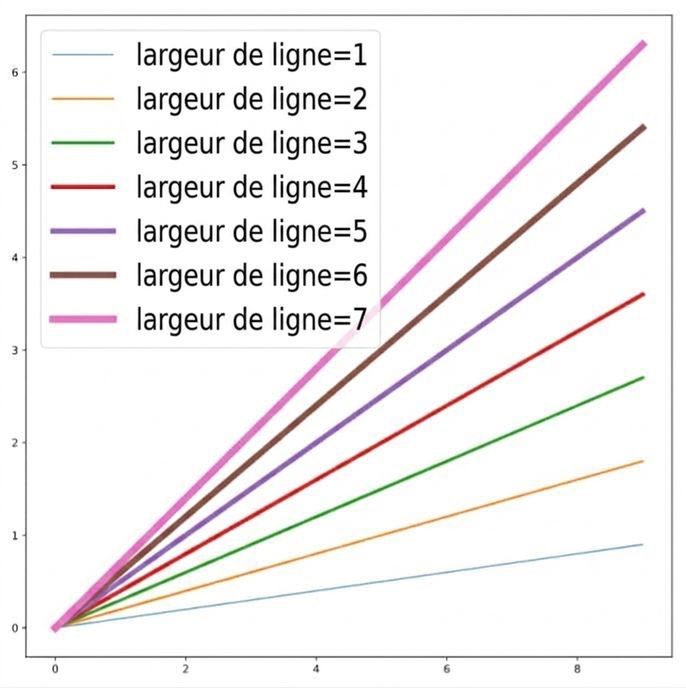
Changer l'épaisseur des lignes

plt.plot(x, y1, linewidth=1)
plt.plot(x, y2, linewidth=2)
plt.plot(x, y3, linewidth=3)
plt.plot(x, y4, linewidth=4)
plt.plot(x, y5, linewidth=5)
plt.plot(x, y6, linewidth=6)
plt.plot(x, y7, linewidth=7)

Introduction à la science des données avec Python

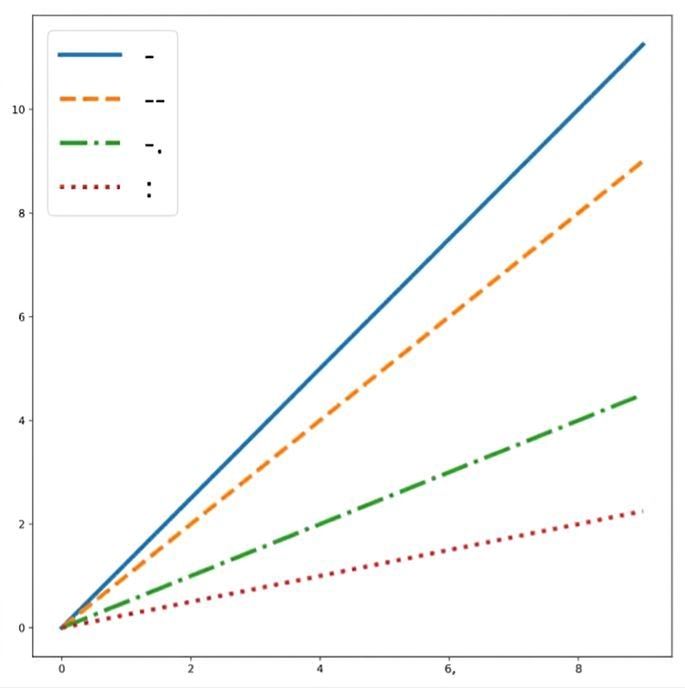
Changer le style de ligne

plt.plot(x, y1, linestyle='-')
plt.plot(x, y2, linestyle='--')
plt.plot(x, y3, linestyle='-.')
plt.plot(x, y4, linestyle=':')

Introduction à la science des données avec Python

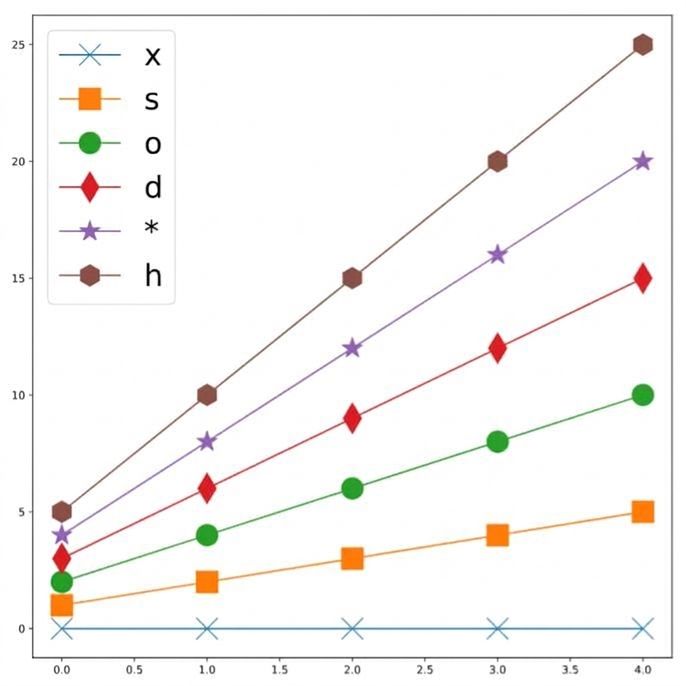
Ajouter des marqueurs

plt.plot(x, y1, marker='x')
plt.plot(x, y2, marker='s')
plt.plot(x, y3, marker='o')
plt.plot(x, y4, marker='d')
plt.plot(x, y5, marker='*')
plt.plot(x, y6, marker='h')

Introduction à la science des données avec Python

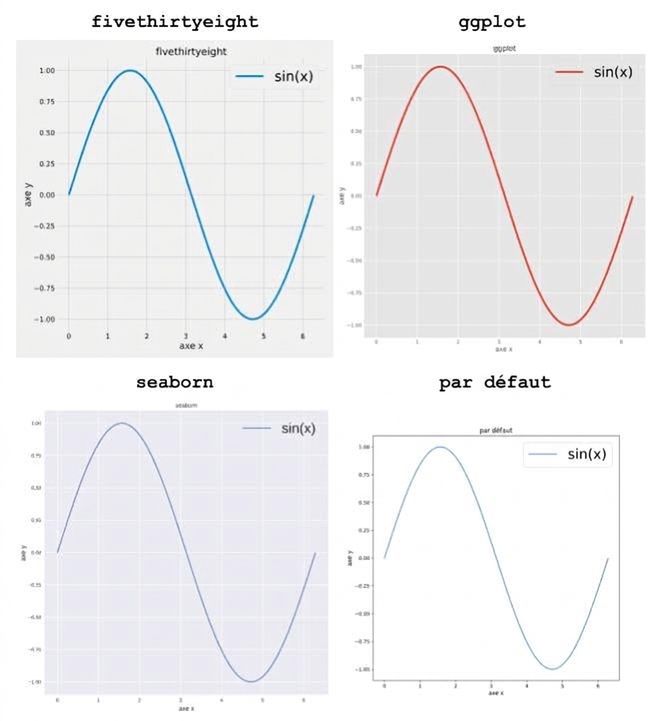
Définir un style

Avant tout autre code de tracé :

plt.style.use('fivethirtyeight')
plt.style.use('ggplot')
plt.style.use('seaborn-v0_8')
plt.style.use('default')

Introduction à la science des données avec Python

Passons à la pratique !

Introduction à la science des données avec Python

Preparing Video For Download...