Tests d'ajustement du khi carré

Tests d'hypothèse en R

Richie Cotton

Data Evangelist at DataCamp

Liens violets

Vous cherchez une solution de code en ligne et le premier lien est violet parce que vous l'avez déjà consulté. Comment vous sentez-vous ?

purple_link_counts <- stack_overflow %>% 
  count(purple_link)
# A tibble: 4 x 2
  purple_link           n
  <fct>             <int>
1 Hello, old friend  1330
2 Amused              409
3 Indifferent         426
4 Annoyed             290
Tests d'hypothèse en R

Énoncer les hypothèses

hypothesized <- tribble(
  ~ purple_link, ~ prop,
  "Hello, old friend", 1 / 2,
  "Amused"           , 1 / 6,
  "Indifferent"      , 1 / 6,
  "Annoyed"          , 1 / 6
)
# A tibble: 4 x 2
  purple_link        prop
  <chr>             <dbl>
1 Hello, old friend 0.5  
2 Amused            0.167
3 Indifferent       0.167
4 Annoyed           0.167

$H_{0}$ : L'échantillon correspond à la distribution supposée.

$H_{A}$ : L'échantillon ne correspond pas à la distribution supposée.

La statistique de test, $\chi^{2}$, mesure l'écart entre les résultats observés et attendus dans chaque groupe.

alpha <- 0.01
1 tribble est l'abréviation de « row-wise tibble » ; à ne pas confondre avec l'espèce extraterrestre de Star Trek
Tests d'hypothèse en R

Effectifs supposés par catégorie

n_total <- nrow(stack_overflow)
hypothesized <- tribble(
  ~ purple_link, ~ prop,
  "Hello, old friend", 1 / 2,
  "Amused"           , 1 / 6,
  "Indifferent"      , 1 / 6,
  "Annoyed"          , 1 / 6
) %>%
  mutate(n = prop * n_total)
# A tibble: 4 x 3
  purple_link        prop     n
  <chr>             <dbl> <dbl>
1 Hello, old friend 0.5   1228.
2 Amused            0.167  409.
3 Indifferent       0.167  409.
4 Annoyed           0.167  409.
Tests d'hypothèse en R

Visualiser les effectifs

ggplot(purple_link_counts, aes(purple_link, n)) +
  geom_col() +
  geom_point(data = hypothesized, color = "purple")
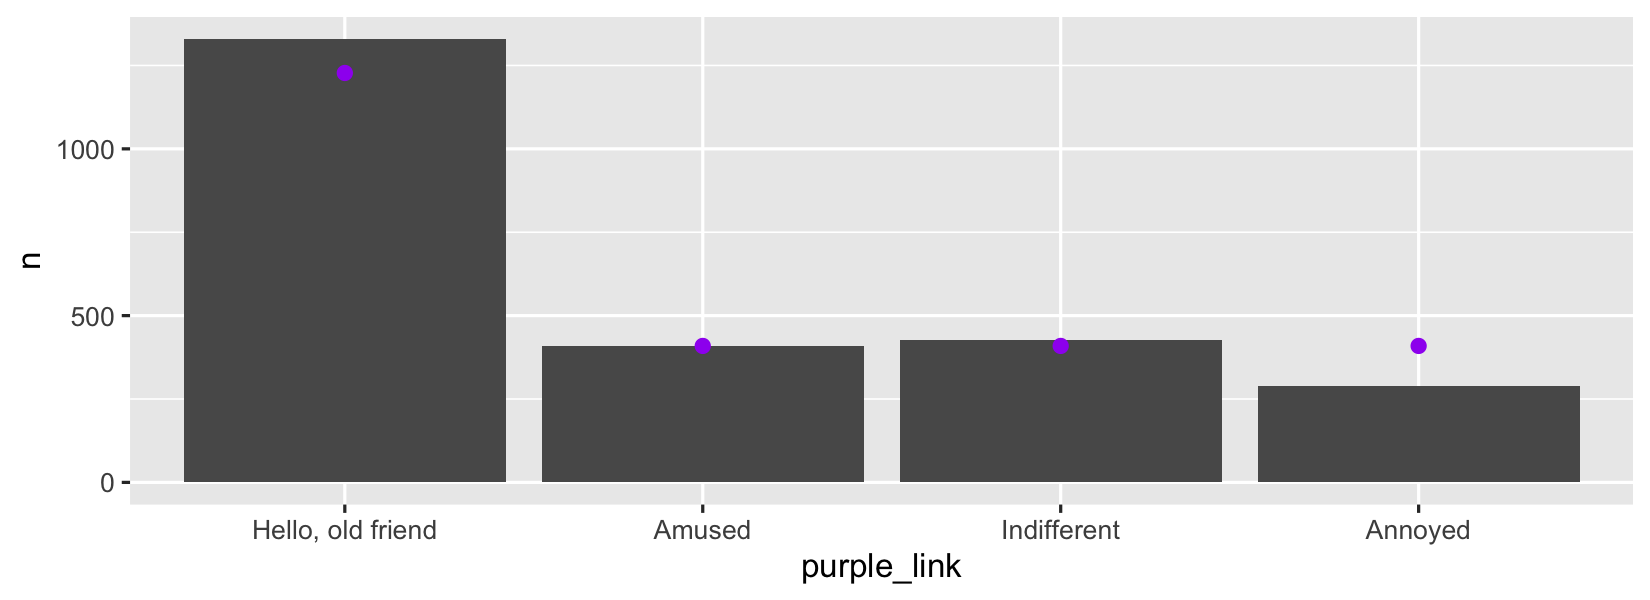
Diagramme à barres : nombre de réponses selon purple_link, avec des points violets pour les effectifs supposés

Tests d'hypothèse en R

Test d'ajustement du khi carré avec chisq_test()

hypothesized_props <- c(
  "Hello, old friend" = 1 / 2,
  Amused              = 1 / 6,
  Indifferent         = 1 / 6,
  Annoyed             = 1 / 6
)
library(infer)
stack_overflow %>% 
  chisq_test(
    response = purple_link,
    p = hypothesized_props
  )
# A tibble: 1 x 3
  statistic chisq_df       p_value
      <dbl>    <dbl>         <dbl>
1      44.0        3 0.00000000154
Tests d'hypothèse en R

Passons à la pratique !

Tests d'hypothèse en R

Preparing Video For Download...