Seaborn परिचय
Seaborn के साथ Data Visualization परिचय

Content Team
DataCamp
Seaborn क्या है?
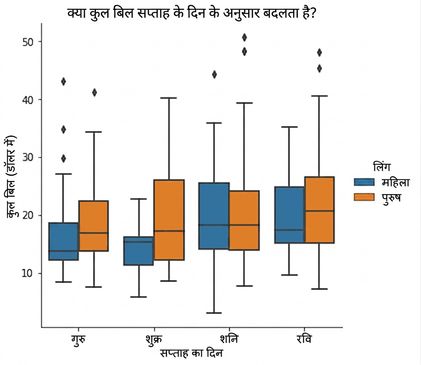
1 Waskom, M. L. (2021). seaborn: statistical data visualization. https://seaborn.pydata.org/
Seaborn क्यों उपयोगी है?
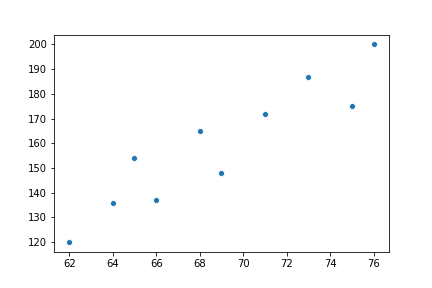
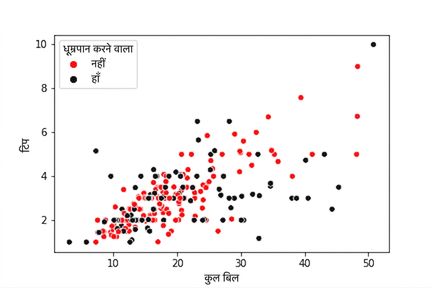
उदाहरण 1: स्कैटर प्लॉट
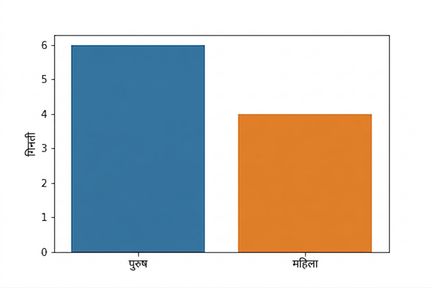
उदाहरण 2: काउंट प्लॉट बनाएँ
1 Waskom, M. L. (2021). seaborn: statistical data visualization. https://seaborn.pydata.org/

