PivotCharts के साथ असंहत डेटा का विज़ुअलाइज़ेशन
Excel में Data Visualization

Agata Bak-Geerinck
Senior Data Analyst, Telenet
Aggregated बनाम Disaggregated डेटा?

Disaggregated data (व्यक्तिगत ब्लॉक)

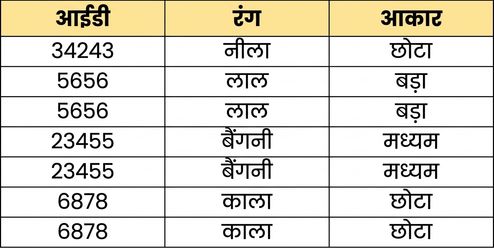
Aggregated data (रंग और आकार के अनुसार गिने हुए)

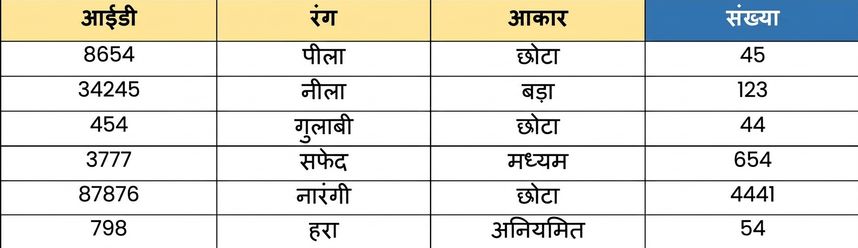
Aggregated बनाम Disaggregated डेटा?
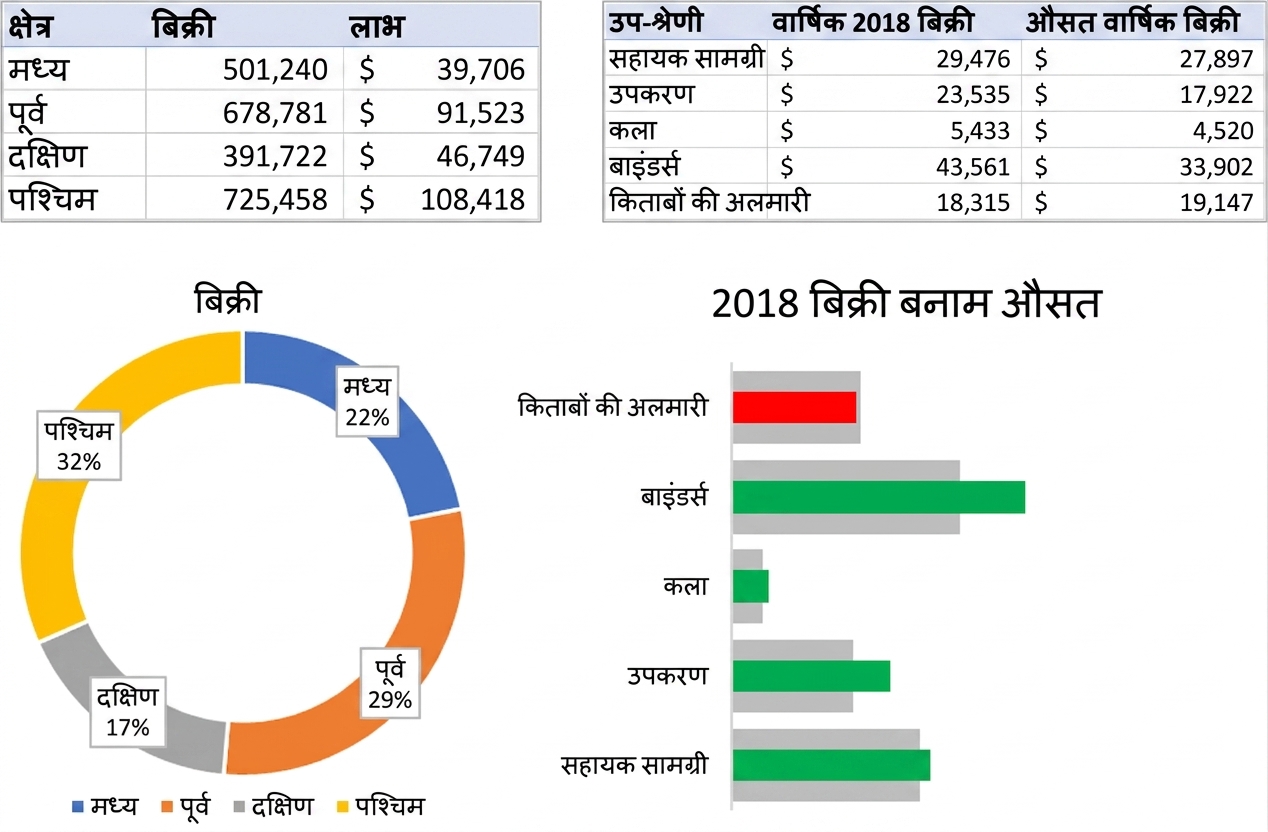
Aggregated data
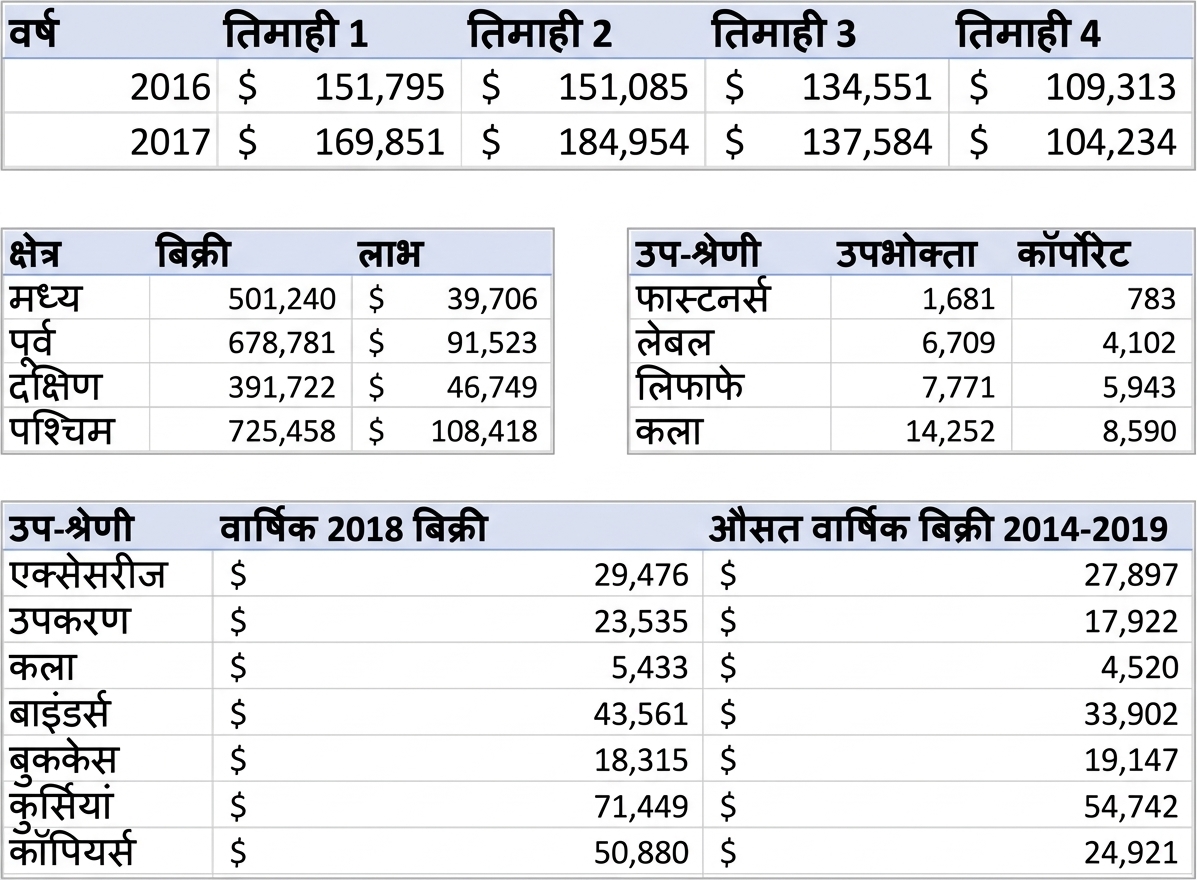
- Aggregated data = सारांश डेटा
- जैसे, प्रति क्षेत्र बिक्री, प्रति उत्पाद लाभ
Disaggregated data
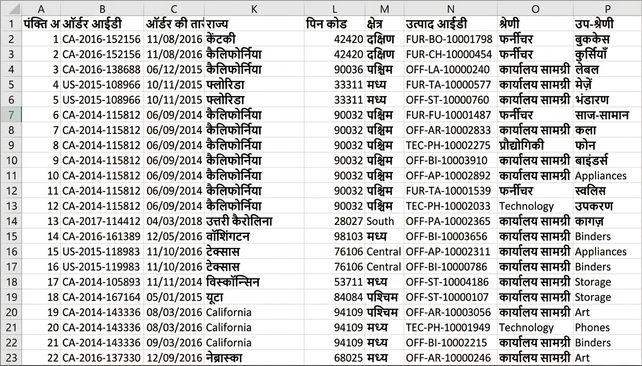
- Disaggregated data = कच्चा, बिना-सारांशित
- ट्रांज़ैक्शनल डेटा: एक रिकॉर्ड = एक घटना
टेबल्स/चार्ट्स से PivotTables और PivotCharts तक
Aggregated डेटा का विज़ुअलाइज़ेशन
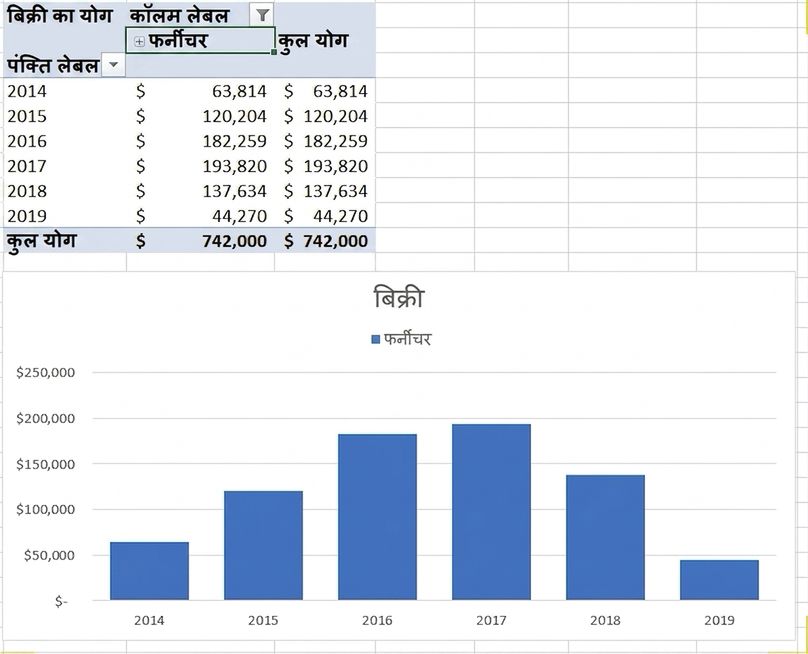
Disaggregated डेटा का विज़ुअलाइज़ेशन
बड़े datasets को कुशलता से explore करें
One dataset = आसान exploration
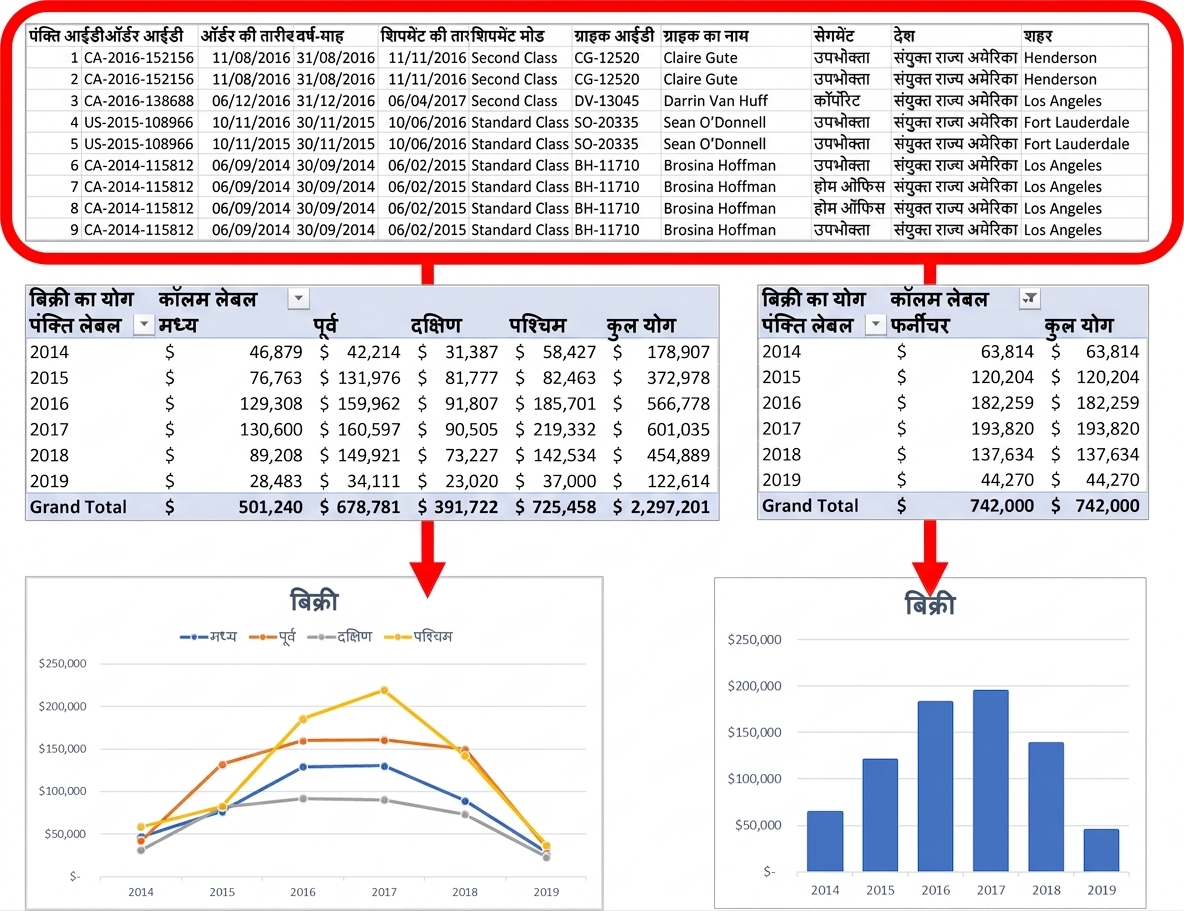
- अलग-अलग टेबल में pre-aggregate करने की ज़रूरत नहीं
- एक ही underlying dataset
- dynamic exploration और visualization
- rows/columns series को आसानी से rearrange करें
- dataset अपडेट होते ही सभी pivot tables और charts अपडेट
- "One source of truth"
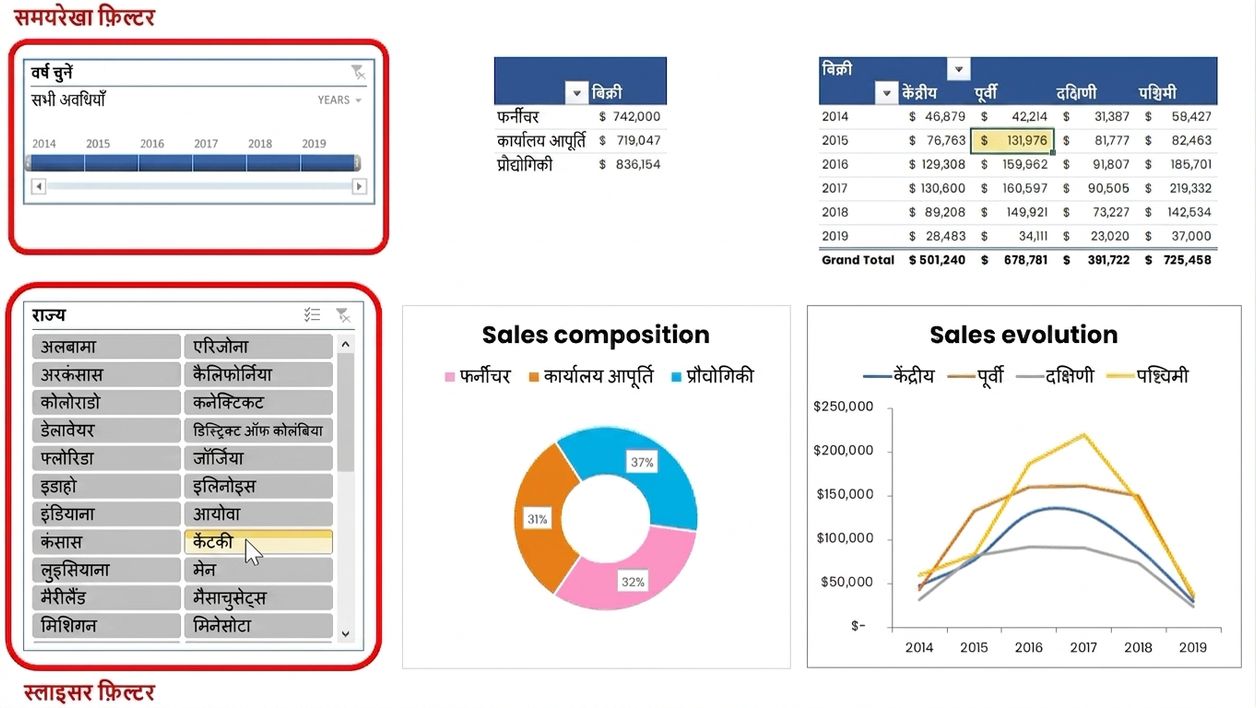
इंटरएक्टिविटी सक्षम करें और (मिनी) डैशबोर्ड बनाएं
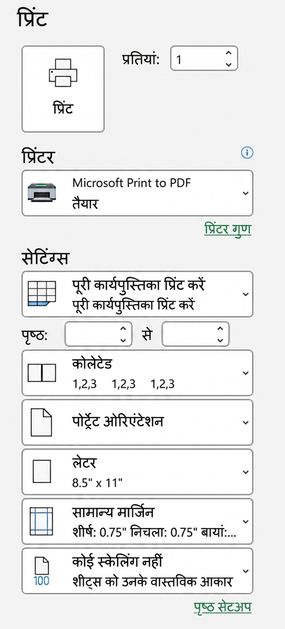
Excel में प्रिंट कैसे करें?
- मीटिंग्स में insights दिखाने या वरिष्ठ स्टाफ से साझा करने में उपयोगी
कई सेटिंग्स उपलब्ध:
- Print areas
- Page layouts
- Scaling, margins, और orientation
प्रिंट से पहले पर्यावरण का ध्यान रखें!