मात्रात्मक तुलना: बार चार्ट

Matplotlib के साथ डेटा विज़ुअलाइज़ेशन परिचय

Ariel Rokem

Data Scientist

ओलंपिक मेडल

,Gold, Silver, Bronze
United States, 137, 52, 67
Germany, 47, 43, 67
Great Britain, 64, 55, 26
Russia, 50, 28, 35
China, 44, 30, 35
France, 20, 55, 21
Australia, 23, 34, 25
Italy, 8, 38, 24
Canada, 4, 4, 61
Japan, 17, 13, 34
Matplotlib के साथ डेटा विज़ुअलाइज़ेशन परिचय

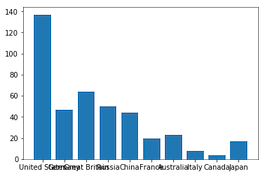
ओलंपिक मेडल: डेटा का विज़ुअलाइज़ेशन

medals = pd.read_csv('medals_by_country_2016.csv', index_col=0)

fig, ax = plt.subplots()
ax.bar(medals.index, medals["Gold"]) plt.show()
Matplotlib के साथ डेटा विज़ुअलाइज़ेशन परिचय

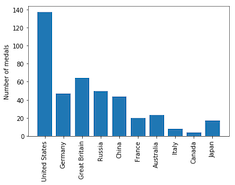
बीच में: टिक लेबल घुमाएँ

fig, ax = plt.subplots()
ax.bar(medals.index, medals["Gold"])

ax.set_xticklabels(medals.index, rotation=90) ax.set_ylabel("Number of medals")
plt.show()
Matplotlib के साथ डेटा विज़ुअलाइज़ेशन परिचय

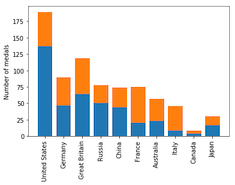
ओलंपिक मेडल: अन्य मेडल दिखाएँ

fig, ax = plt.subplots
ax.bar(medals.index, medals["Gold"])

ax.bar(medals.index, medals["Silver"], bottom=medals["Gold"])
ax.set_xticklabels(medals.index, rotation=90) ax.set_ylabel("Number of medals") plt.show()

Matplotlib के साथ डेटा विज़ुअलाइज़ेशन परिचय

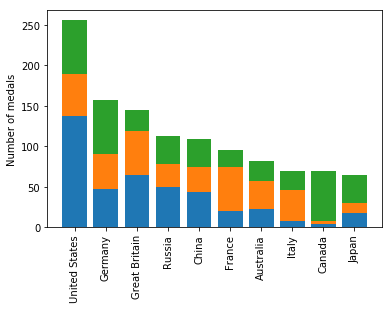
ओलंपिक मेडल: तीनों का विज़ुअलाइज़ेशन

fig, ax = plt.subplots
ax.bar(medals.index, medals["Gold"])

ax.bar(medals.index, medals["Silver"], bottom=medals["Gold"])

ax.bar(medals.index, medals["Bronze"], bottom=medals["Gold"] + medals["Silver"])
ax.set_xticklabels(medals.index, rotation=90) ax.set_ylabel("Number of medals") plt.show()
Matplotlib के साथ डेटा विज़ुअलाइज़ेशन परिचय

स्टैक्ड बार चार्ट

Matplotlib के साथ डेटा विज़ुअलाइज़ेशन परिचय

लीजेंड जोड़ना

fig, ax = plt.subplots
ax.bar(medals.index, medals["Gold"])
ax.bar(medals.index, medals["Silver"], bottom=medals["Gold"])
ax.bar(medals.index, medals["Bronze"],
       bottom=medals["Gold"] + medals["Silver"])

ax.set_xticklabels(medals.index, rotation=90)
ax.set_ylabel("Number of medals")
Matplotlib के साथ डेटा विज़ुअलाइज़ेशन परिचय

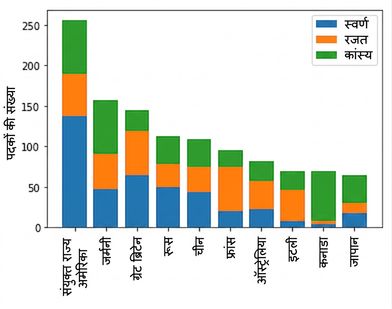
लीजेंड जोड़ना

fig, ax = plt.subplots
ax.bar(medals.index, medals["Gold"], label="Gold")
ax.bar(medals.index, medals["Silver"], bottom=medals["Gold"], 
       label="Silver")
ax.bar(medals.index, medals["Bronze"],
       bottom=medals["Gold"] + medals["Silver"], 
       label="Bronze")

ax.set_xticklabels(medals.index, rotation=90)
ax.set_ylabel("Number of medals")

ax.legend() plt.show()
Matplotlib के साथ डेटा विज़ुअलाइज़ेशन परिचय

लीजेंड के साथ स्टैक्ड बार चार्ट

Matplotlib के साथ डेटा विज़ुअलाइज़ेशन परिचय

एक बार चार्ट बनाएँ!

Matplotlib के साथ डेटा विज़ुअलाइज़ेशन परिचय

Preparing Video For Download...