R में Regression परिचय
Richie Cotton
Data Evangelist at DataCamp
library(dplyr)
swedish_motor_insurance %>%
  summarize_all(mean)
# A tibble: 1 x 2
  n_claims total_payment_sek
     <dbl>             <dbl>
1     22.9              98.2
swedish_motor_insurance %>%
  summarize(
    correlation = cor(n_claims, total_payment_sek)
  )
# A tibble: 1 x 1
  correlation
        <dbl>
1       0.881
वैरिएबल जिसका मान आप भविष्यवाणी करना चाहते हैं.
वे वैरिएबल्स जो बताते हैं कि रिस्पॉन्स वैरिएबल कैसे बदलेगा.
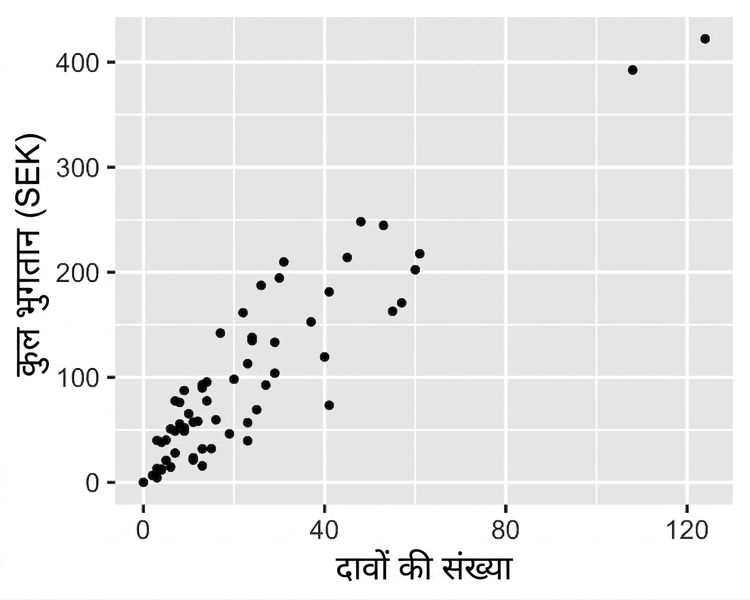
library(ggplot2)

ggplot(
  swedish_motor_insurance,
  aes(n_claims, total_payment_sek)
) +
  geom_point()
library(ggplot2)

ggplot(
  swedish_motor_insurance,
  aes(n_claims, total_payment_sek)
) +
  geom_point() +
  geom_smooth(
    method = "lm",
    se = FALSE
  )
लिनियर रिग्रेशन मॉडल्स का विज़ुअलाइज़ेशन और फिटिंग.
लिनियर रिग्रेशन मॉडल्स से प्रेडिक्शन करना और मॉडल कोइफिशिएंट्स समझना.
लिनियर रिग्रेशन मॉडल की गुणवत्ता का आकलन.
यह सब दोबारा, पर logistic regression मॉडल्स के साथ.