आपको logistic regression क्यों चाहिए

R में Regression परिचय

Richie Cotton

Data Evangelist at DataCamp

बैंक churn डेटासेट

has_churned time_since_first_purchase time_since_last_purchase
0 0.3993247 -0.5158691
1 -0.4297957 0.6780654
0 3.7383122 0.4082544
0 0.6032289 -0.6990435
... ... ...
response संबंध की अवधि गतिविधि की नवीनता
1 https://www.rdocumentation.org/packages/bayesQR/topics/Churn
R में Regression परिचय

Churn बनाम recency: एक linear मॉडल

mdl_churn_vs_recency_lm <- lm(has_churned ~ time_since_last_purchase, data = churn)
Call:
lm(formula = has_churned ~ time_since_last_purchase, data = churn)

Coefficients:
             (Intercept)  time_since_last_purchase  
                 0.49078                   0.06378 
coeffs <- coefficients(mdl_churn_vs_recency_lm)
intercept <- coeffs[1]
slope <- coeffs[2]
R में Regression परिचय

Linear मॉडल का विज़ुअलाइज़ेशन

ggplot(
  churn, 
  aes(time_since_last_purchase, has_churned)
) +
  geom_point() +
  geom_abline(intercept = intercept, slope = slope)

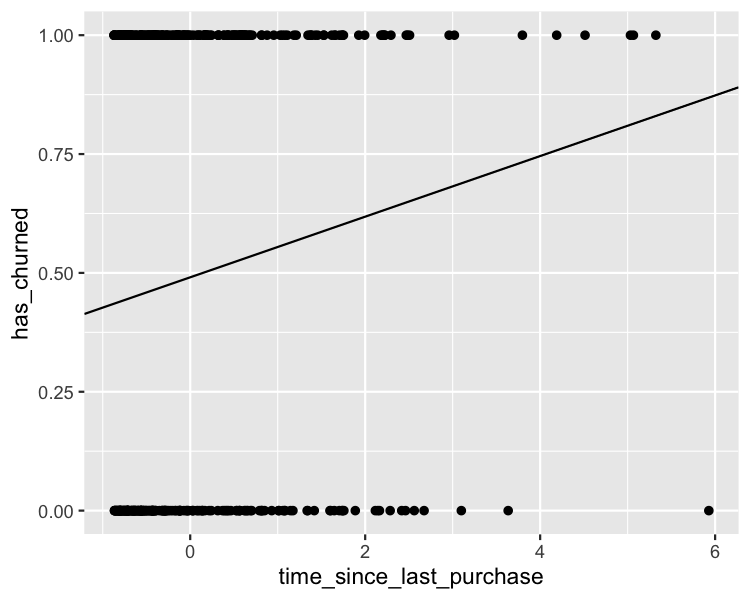
Predictions churn की probability हैं, churn की मात्रा नहीं.

ग्राहक ने churn किया या नहीं बनाम पिछली खरीद के बाद का समय का स्कैटर प्लॉट. सभी बिंदु y = 0 या y = 1 पर हैं. एक linear ट्रेंड लाइन दिखाती है कि पिछली खरीद से समय बढ़ने पर churn की probability बढ़ती है.

R में Regression परिचय

ज़ूम आउट करना

ggplot(
  churn, 
  aes(days_since_last_purchase, has_churned)
) +
  geom_point() +
  geom_abline(intercept = intercept, slope = slope) +
  xlim(-10, 10) +
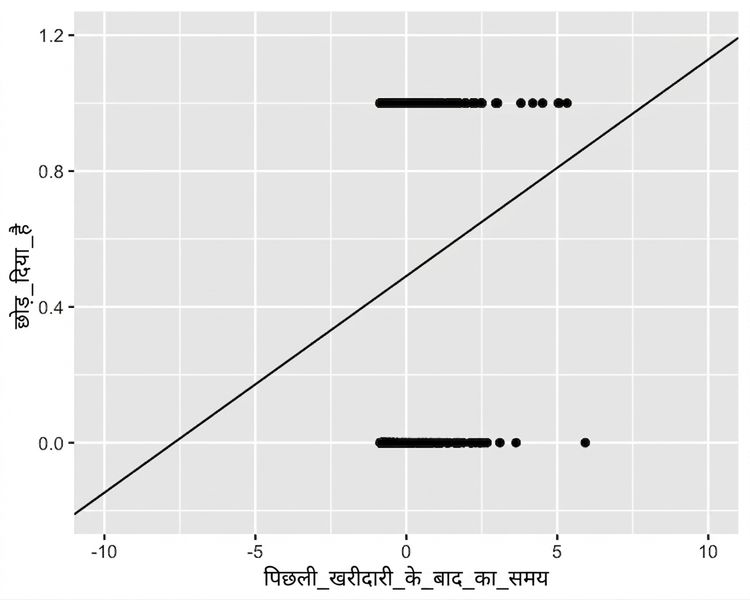
  ylim(-0.2, 1.2)

ग्राहक ने churn किया या नहीं बनाम पिछली खरीद के बाद का समय का वही स्कैटर प्लॉट. इस बार अक्ष ज़्यादा बाहर तक ज़ूम हैं, दिख रहा है कि ट्रेंड लाइन y = 0 से नीचे और y = 1 से ऊपर चली जाती है, जो असंभव होना चाहिए.

R में Regression परिचय

Logistic regression क्या है?

  • generalized linear model का एक और प्रकार.
  • जब response वैरिएबल logical हो.
  • responses logistic (S-आकार) कर्व का पालन करते हैं.
R में Regression परिचय

glm() के साथ linear regression

glm(has_churned ~ time_since_last_purchase, data = churn, family = gaussian)
Call:  glm(formula = has_churned ~ time_since_last_purchase, family = gaussian, 
    data = churn)

Coefficients:
             (Intercept)  time_since_last_purchase  
                 0.49078                   0.06378  

Degrees of Freedom: 399 Total (i.e. Null);  398 Residual
Null Deviance:        100 
Residual Deviance: 98.02     AIC: 578.7
R में Regression परिचय

Logistic regression: glm() में binomial family

mdl_recency_glm <- glm(has_churned ~ time_since_last_purchase, data = churn, family = binomial)
Call:  glm(formula = has_churned ~ time_since_last_purchase, family = binomial, 
    data = churn)

Coefficients:
             (Intercept)  time_since_last_purchase  
                -0.03502                   0.26921  

Degrees of Freedom: 399 Total (i.e. Null);  398 Residual
Null Deviance:        554.5 
Residual Deviance: 546.4     AIC: 550.4
R में Regression परिचय

Logistic मॉडल का विज़ुअलाइज़ेशन

ggplot(
  churn, 
  aes(time_since_last_purchase, has_churned)
) +
  geom_point() +
  geom_abline(
    intercept = intercept, slope = slope
  ) +
  geom_smooth(
    method = "glm", 
    se = FALSE, 
    method.args = list(family = binomial)
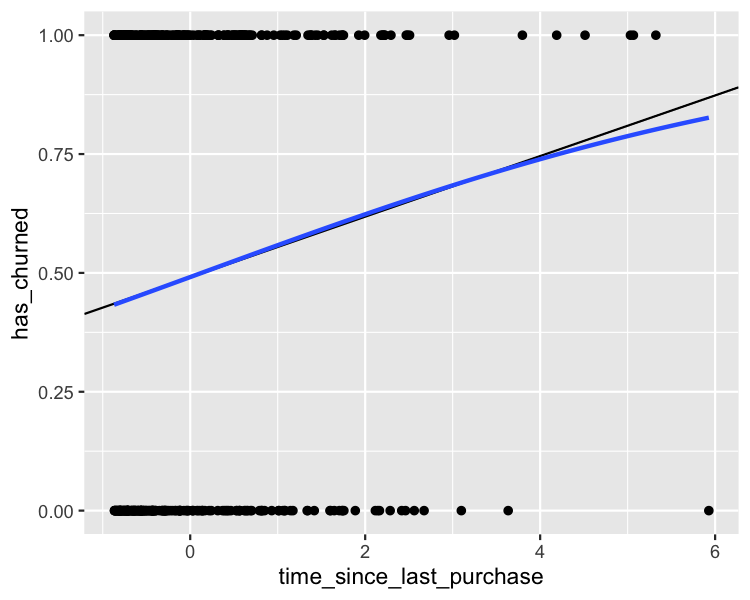
  )

ग्राहक ने churn किया या नहीं बनाम पिछली खरीद के बाद का समय का स्कैटर प्लॉट. Linear और logistic दोनों ट्रेंड लाइनें दिखती हैं, और दोनों में समय बढ़ने पर churn की probability बढ़ती है. उच्च समय पर दोनों लाइनों में थोड़ा अंतर दिखता है.

R में Regression परिचय

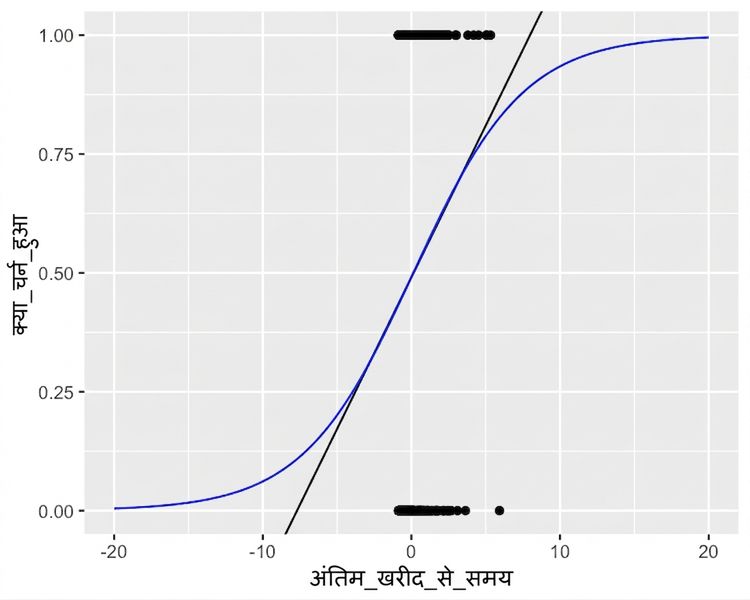
ज़ूम आउट करना

ग्राहक ने churn किया या नहीं बनाम पिछली खरीद के बाद का समय का स्कैटर प्लॉट, दोनों ट्रेंड लाइनों के साथ. अक्ष पहले से अधिक ज़ूम-आउट हैं, दिखता है कि logistic ट्रेंड लाइन कभी 0 से 1 की churn रेंज से बाहर नहीं जाती.

R में Regression परिचय

अभ्यास करते हैं!

R में Regression परिचय

Preparing Video For Download...