Outliers, leverage, और influence

R में Regression परिचय

Richie Cotton

Data Evangelist at DataCamp

Roach डेटासेट

roach <- fish %>%
  filter(species == "Roach")
species length_cm mass_g
Roach 12.9 40
Roach 16.5 69
Roach 17.5 78
Roach 18.2 87
Roach 18.6 120
... ... ...
R में Regression परिचय

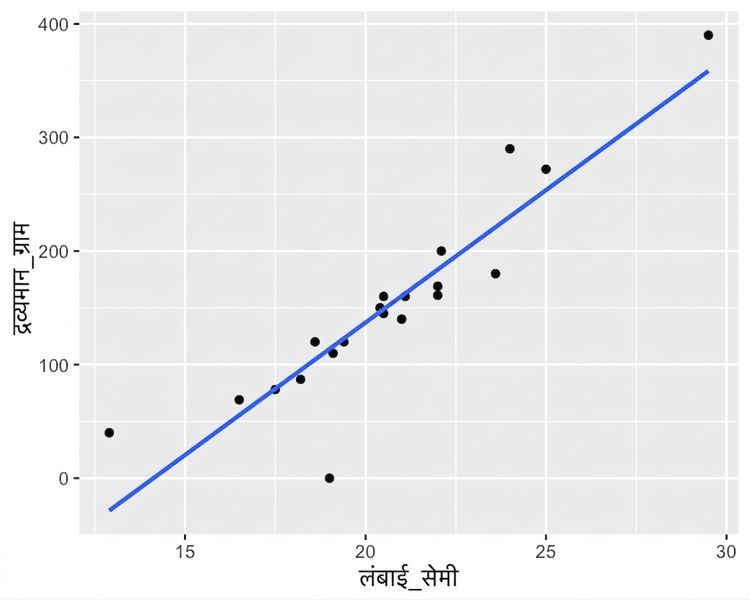
कौन से पॉइंट्स outliers हैं?

ggplot(roach, aes(length_cm, mass_g)) +
  geom_point() +
  geom_smooth(method = "lm", se = FALSE)

लंबाई के मुकाबले roach के mass का scatter plot, ट्रेंड लाइन सहित. ज़्यादातर पॉइंट्स लाइन के क़रीब हैं.

R में Regression परिचय

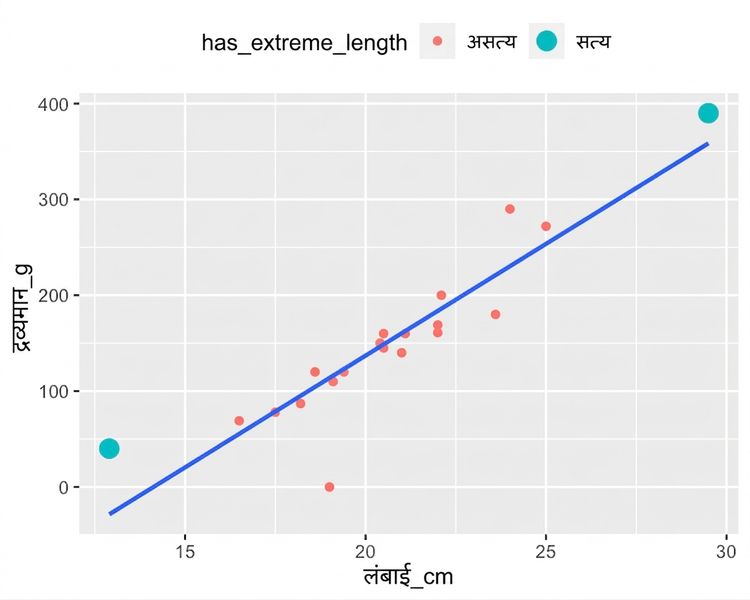
अत्यधिक explanatory मान

roach %>% 
  mutate(
    has_extreme_length = length_cm < 15 | length_cm > 26
  ) %>% 
  ggplot(aes(length_cm, mass_g)) +
  geom_point(aes(color = has_extreme_length)) +
  geom_smooth(method = "lm", se = FALSE)

लंबाई के मुकाबले roach के mass का scatter plot, ट्रेंड लाइन सहित. ज़्यादातर पॉइंट्स लाल हैं, पर एक बहुत छोटा और एक बहुत लंबा roach सियान रंग में है.

R में Regression परिचय

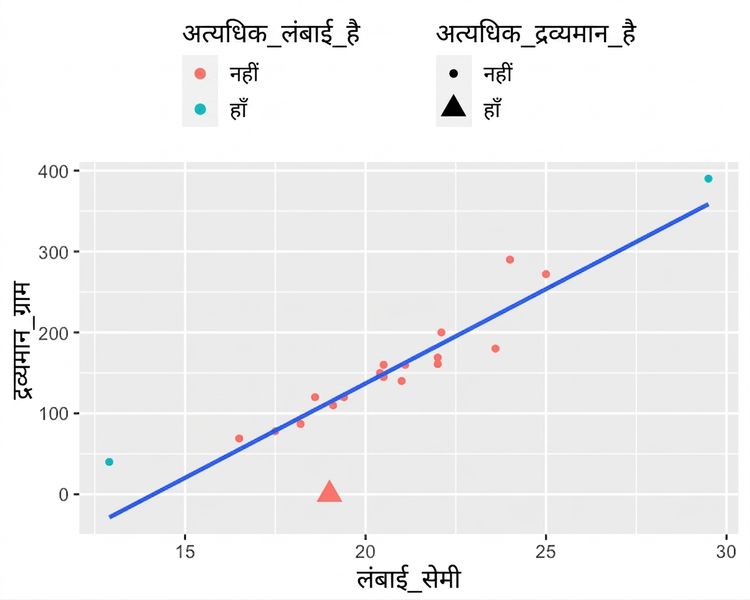
Regression लाइन से दूर response मान

roach %>% 
  mutate(
    has_extreme_length = length_cm < 15 | length_cm > 26,
    has_extreme_mass = mass_g < 1
  ) %>% 
  ggplot(aes(length_cm, mass_g)) +
  geom_point(
    aes(
      color = has_extreme_length, 
      shape = has_extreme_mass
    )
  ) +
  geom_smooth(method = "lm", se = FALSE)

लंबाई के मुकाबले roach के mass का scatter plot, ट्रेंड लाइन सहित. ज़्यादातर पॉइंट्स लाल हैं, पर एक बहुत छोटा और एक बहुत लंबा roach सियान है. ज़्यादातर पॉइंट्स सर्कल हैं, पर apparent mass शून्य वाला एक पॉइंट त्रिकोण है.

R में Regression परिचय

Leverage

Leverage यह मापता है कि explanatory वैरिएबल के मान कितने चरम हैं.

mdl_roach <- lm(mass_g ~ length_cm, data = roach)

hatvalues(mdl_roach)
     1      2      3      4      5      6      7 
0.3137 0.1255 0.0935 0.0763 0.0684 0.0619 0.0605 
     8      9     10     11     12     13     14 
0.0568 0.0503 0.0501 0.0501 0.0506 0.0509 0.0581 
    15     16     17     18     19     20 
0.0581 0.0593 0.0884 0.0995 0.1334 0.3947
R में Regression परिचय

.hat कॉलम

library(broom)
augment(mdl_roach)
# A tibble: 20 × 8
   mass_g length_cm .fitted   .resid   .hat .sigma   .cooksd .std.resid
    <dbl>     <dbl>   <dbl>    <dbl>  <dbl>  <dbl>     <dbl>      <dbl>
 1     40      12.9   -28.6   68.6   0.314    33.8 1.07          2.17  
 2     69      16.5    55.4   13.6   0.126    39.1 0.0104        0.381 
 3     78      17.5    78.7   -0.711 0.0935   39.3 0.0000197    -0.0196
 4     87      18.2    95.0   -8.03  0.0763   39.2 0.00198      -0.219 
 5    120      18.6   104.    15.6   0.0684   39.1 0.00661       0.424 
... 
R में Regression परिचय

उच्च leverage वाले roach

mdl_roach %>%
  augment() %>%
  select(mass_g, length_cm, leverage = .hat) %>%
  arrange(desc(leverage)) %>% 
  head()
# A tibble: 6 x 3
  mass_g length_cm leverage
   <dbl>     <dbl>    <dbl>
1    390      29.5   0.395  # बहुत लंबा roach
2     40      12.9   0.314  # बहुत छोटा roach
3    272      25     0.133 
4     69      16.5   0.126 
5    290      24     0.0995
6     78      17.5   0.0935
R में Regression परिचय

Influence

Influence मापता है कि अगर modeling के समय आप किसी observation को डेटासेट से हटा दें तो मॉडल कितना बदलेगा.

एक व्यक्ति रिंच घुमा रहा है

R में Regression परिचय

Cook's distance

Cook's distance influence का सबसे सामान्य माप है.

cooks.distance(mdl_roach)
       1        2        3        4        5        6 
1.07e+00 1.04e-02 1.97e-05 1.98e-03 6.61e-03 3.12e-01 
       7        8        9       10       11       12 
8.53e-04 1.99e-04 2.57e-04 2.56e-04 2.45e-03 7.95e-03 
      13       14       15       16       17       18 
1.37e-04 4.82e-03 1.15e-02 4.52e-03 6.12e-02 1.50e-01 
      19       20 
2.06e-02 3.66e-01
R में Regression परिचय

.cooksd कॉलम

library(broom)
augment(mdl_roach)
# A tibble: 20 x 9
   mass_g length_cm .fitted .se.fit   .resid   .hat .sigma   .cooksd .std.resid
    <dbl>     <dbl>   <dbl>   <dbl>    <dbl>  <dbl>  <dbl>     <dbl>      <dbl>
 1     40      12.9   -28.6   21.4    68.6   0.314    33.8 1.07          2.17  
 2     69      16.5    55.4   13.5    13.6   0.126    39.1 0.0104        0.381 
 3     78      17.5    78.7   11.7    -0.711 0.0935   39.3 0.0000197    -0.0196
 4     87      18.2    95.0   10.5    -8.03  0.0763   39.2 0.00198      -0.219 
 5    120      18.6   104.     9.98   15.6   0.0684   39.1 0.00661       0.424 
... 
R में Regression परिचय

सबसे प्रभावशाली roach

mdl_roach %>%
  augment() %>%
  select(mass_g, length_cm, cooks_dist = .cooksd) %>%
  arrange(desc(cooks_dist)) %>% 
  head()
# A tibble: 6 x 3
  mass_g length_cm cooks_dist
   <dbl>     <dbl>      <dbl>
1     40      12.9     1.07   # बहुत छोटा roach
2    390      29.5     0.366  # बहुत लंबा roach
3      0      19       0.312  # शून्य mass वाला roach
4    290      24       0.150 
5    180      23.6     0.0612
6    272      25       0.0206
R में Regression परिचय

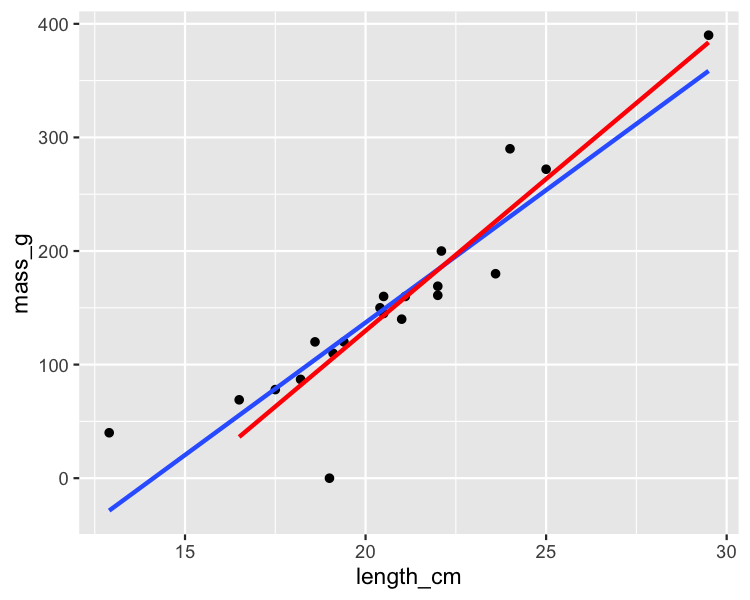
सबसे प्रभावशाली roach हटाना

roach_not_short <- roach %>% 
  filter(length != 12.9)
ggplot(roach, aes(length_cm, mass_g)) +
  geom_point() +
  geom_smooth(method = "lm", se = FALSE) +
  geom_smooth(
    method = "lm", se = FALSE, 
    data = roach_not_short, color = "red"
  )

लंबाई के मुकाबले roach के mass का scatter plot, दो ट्रेंड लाइनों सहित. एक लाइन सभी डेटा पर है, दूसरी सबसे छोटे roach को हटाकर. दूसरी लाइन का ढलान noticeably अधिक खड़ा है.

R में Regression परिचय

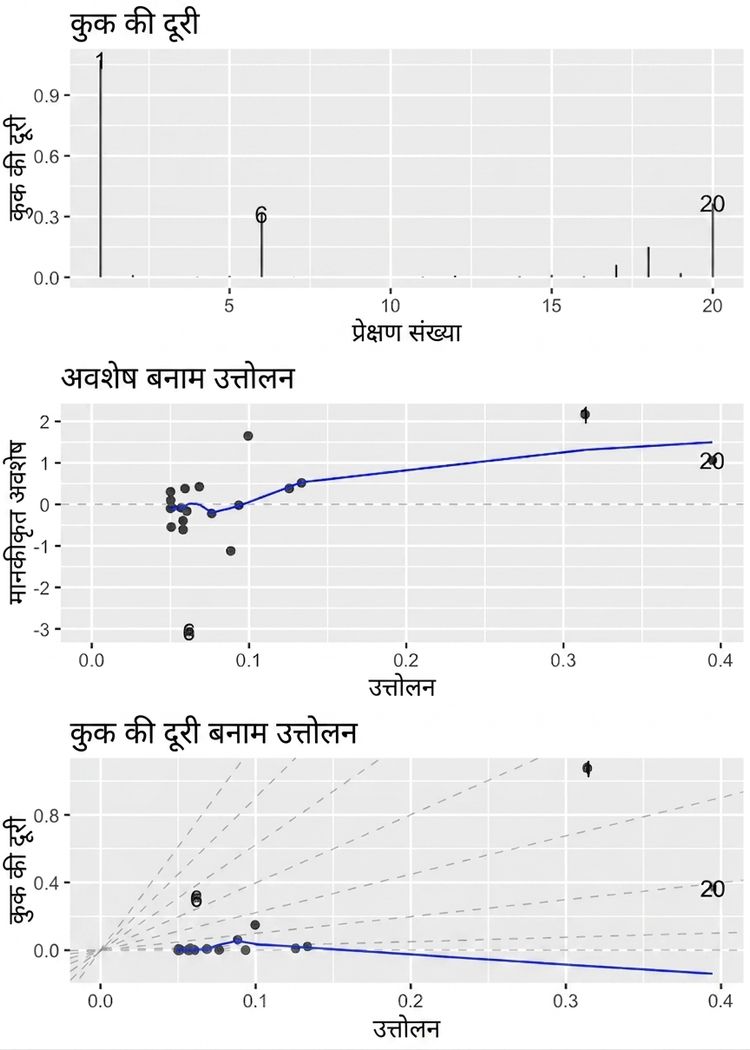
autoplot()

autoplot(
  mdl_roach, 
  which = 4:6, 
  nrow = 3,
  ncol = 1
)

roach मॉडल के तीन डायग्नोस्टिक प्लॉट, तीन पैनलों में.

R में Regression परिचय

अभ्यास करते हैं!

R में Regression परिचय

Preparing Video For Download...