और probability distributions

R में Statistics परिचय

Maggie Matsui

Content Developer, DataCamp

Exponential distribution

  • Poisson घटनाओं के बीच समय की प्रायिकता

  • उदाहरण

    • गोद लिए जाने के बीच > 1 दिन की प्रायिकता
    • रेस्तरां आगमन के बीच < 10 मिनट की प्रायिकता
    • भूकंपों के बीच 6-8 महीने की प्रायिकता
  • lambda (rate) भी उपयोग होती है

  • सतत (समय)

R में Statistics परिचय

Customer service अनुरोध

  • औसतन, हर 2 मिनट में एक customer service टिकट बनता है
    • $\lambda$ = प्रति मिनट 0.5 customer service टिकट
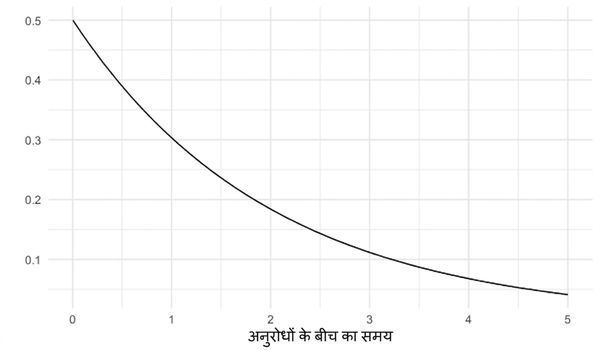
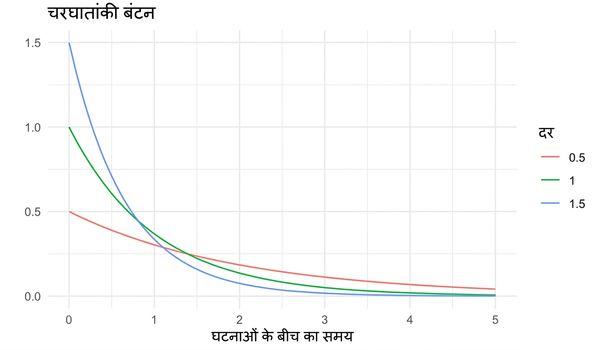
lambda = 0.5 वाला exponential distribution

R में Statistics परिचय

Exponential distribution में lambda

3 exponential distributions: lambda = 0.5, lambda = 1, और lambda = 1.5

R में Statistics परिचय

नए अनुरोध तक कितना समय?

$P(\text{wait} < \text{1 min})$ =

pexp(1, rate = 0.5)
0.3934693

$P(\text{wait} > \text{4 min})$ =

pexp(4, rate = 0.5, lower.tail = FALSE)
0.1353353

$P(\text{1 min} < \text{wait} < \text{4 min})$ =

pexp(4, rate = 0.5) - pexp(1, rate = 0.5)
0.4711954
R में Statistics परिचय

Exponential distribution का अपेक्षित मान

Rate (Poisson) के रूप में:

  • $\lambda$ = प्रति मिनट $0.5$ अनुरोध


समय (exponential) के रूप में:

  • $1/\lambda$ = $2$ मिनट में $1$ अनुरोध
R में Statistics परिचय

(Student's) t-distribution

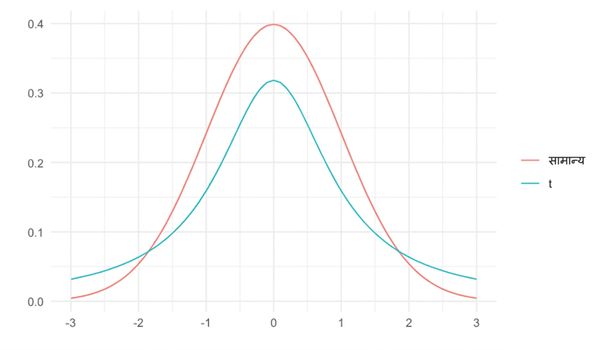
  • आकार normal distribution जैसा

t-distribution और normal distribution एक ही अक्ष पर

R में Statistics परिचय

Degrees of freedom

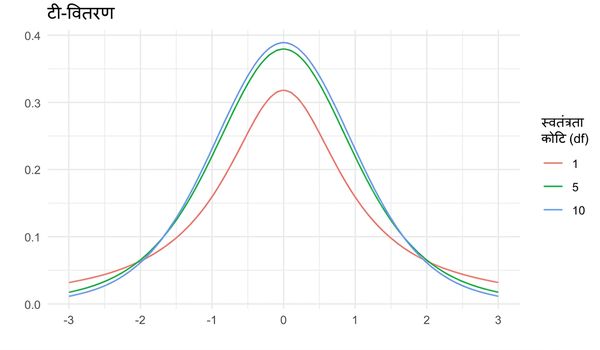
  • पैरामीटर degrees of freedom (df) पूंछों की मोटाई को प्रभावित करता है
    • कम df = मोटी पूंछें, अधिक standard deviation
    • अधिक df = normal distribution के करीब

3 t distributions: df = 1, df = 5, और df = 10

R में Statistics परिचय

Log-normal distribution

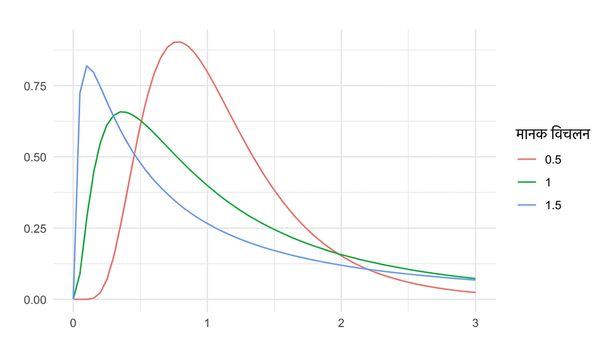
  • ऐसा वैरिएबल जिसका लॉगरिद्म normally distributed हो

  • उदाहरण:

    • शतरंज खेलों की लंबाई
    • वयस्क blood pressure
    • 2003 SARS प्रकोप में hospitalizations की संख्या

3 log-normal distributions: sd = 0.5, sd = 1, और sd = 1.5

R में Statistics परिचय

अभ्यास करते हैं!

R में Statistics परिचय

Preparing Video For Download...