Finance के लिए Python परिचय
Adina Howe
Professor
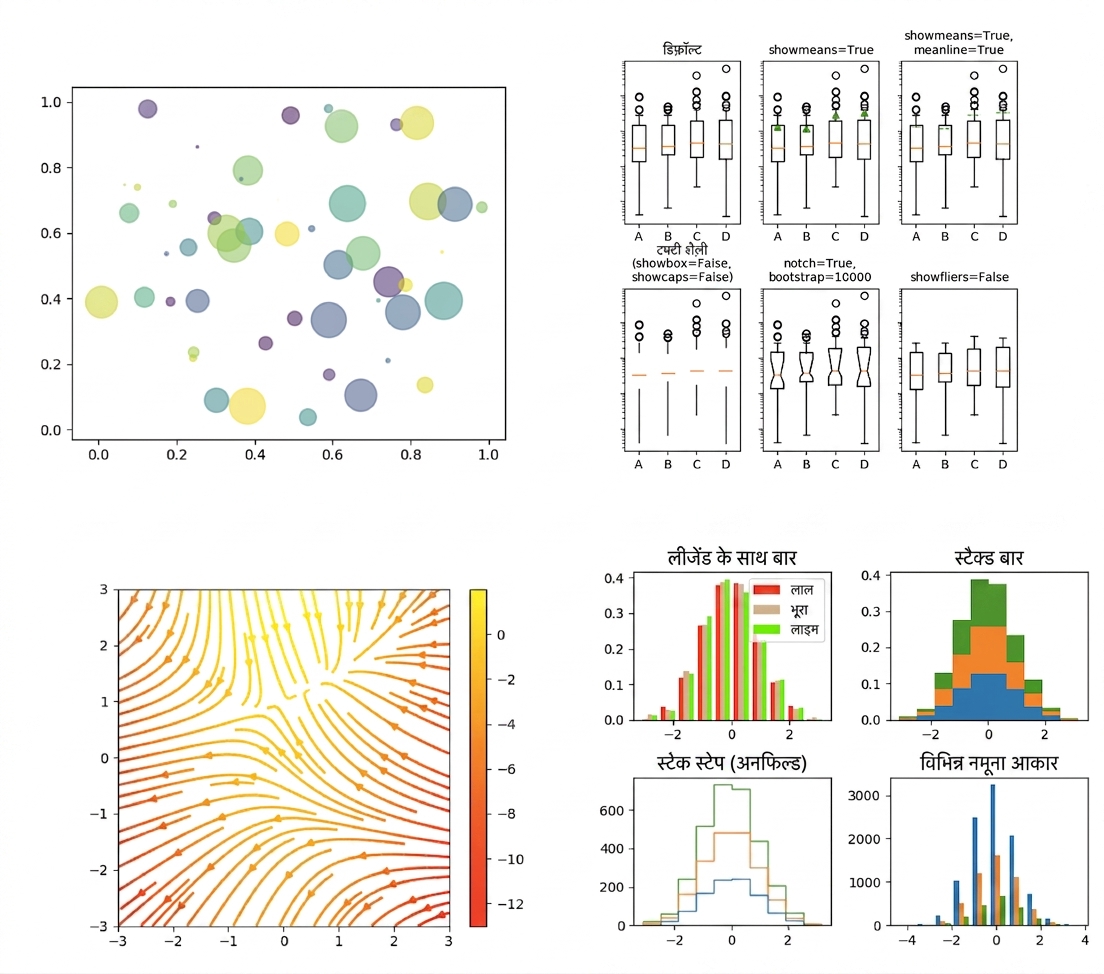
इस लिंक पर क्लिक करके Matplotlib गैलरी और देखें.
import matplotlib.pyplot as plt
plt.plot()
plt.show()
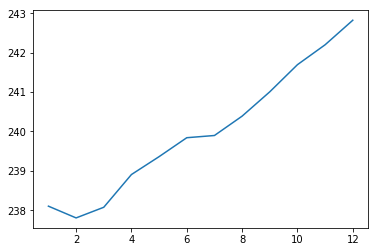
import matplotlib.pyplot as plt
plt.plot(months, prices)
plt.show()

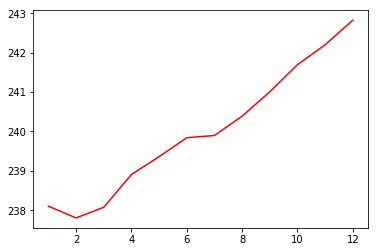
import matplotlib.pyplot as plt
plt.plot(months, prices, color = 'red')
plt.show()

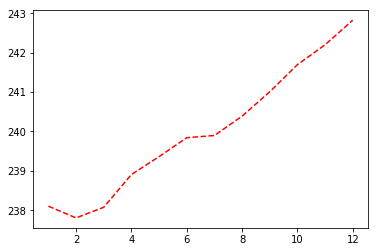
import matplotlib.pyplot as plt
plt.plot(months, prices, color = 'red', linestyle = '--')
plt.show()

| रंग | |
|---|---|
| 'green' | हरा |
| 'red' | लाल |
| 'cyan' | सियान |
| 'blue' | नीला |
| linestyle | |
|---|---|
| '-' | solid लाइन |
| '--' | dashed लाइन |
| '-.' | dash-dot लाइन |
| ':' | डॉटेड |
colors और lines पर और डॉक्युमेंटेशन यहाँ मिलेगा.
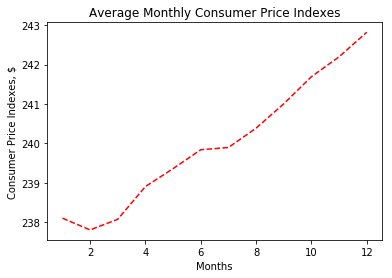
import matplotlib.pyplot as plt
plt.plot(months, prices, color = 'red', linestyle = '--')
# Add labels
plt.xlabel('Months')
plt.ylabel('Consumer Price Indexes, $')
plt.title('Average Monthly Consumer Price Indexes')
# Show plot
plt.show()

import matplotlib.pyplot as plt
plt.plot(months, prices, color = 'red', linestyle = '--')
# adding an additional line
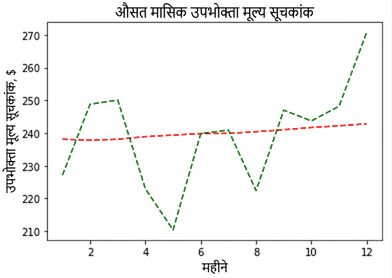
plt.plot(months, prices_new, color = 'green', linestyle = '--')
plt.xlabel('Months')
plt.ylabel('Consumer Price Indexes, $')
plt.title('Average Monthly Consumer Price Indexes')
plt.show()

import matplotlib.pyplot as plt
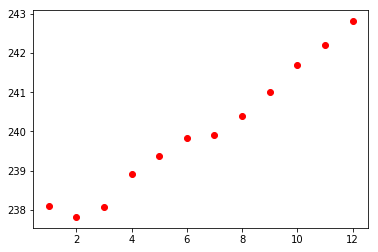
plt.scatter(x = months, y = prices, color = 'red')
plt.show()

Finance के लिए Python परिचय