infer पाइपलाइन जारी रखें

R में Hypothesis Testing

Richie Cotton

Data Evangelist at DataCamp

रिकैप: परिकल्पनाएँ और डेटासेट

$H_{0}$: 30 से कम उम्र के शौक़ियाओं का proportion, कम से कम 30 वाले शौक़ियाओं के proportion के बराबर है.

$H_{A}$: 30 से कम उम्र के शौक़ियाओं का proportion, कम से कम 30 वाले शौक़ियाओं के proportion से अलग है.

alpha <- 0.1

stack_overflow_imbalanced %>% 
  count(hobbyist, age_cat, .drop = FALSE)
  hobbyist     age_cat    n
1       No At least 30    0
2       No    Under 30  191
3      Yes At least 30   15
4      Yes    Under 30 1025
R में Hypothesis Testing

रिकैप: वर्कफ़्लो

null_distn <- dataset %>% 
  specify() %>% 
  hypothesize() %>% 
  generate() %>% 
  calculate()
observed_stat <- dataset %>% 
  specify() %>% 
  calculate()
get_p_value(null_distn, observed_stat)
stack_overflow_imbalanced %>%
  specify(hobbyist ~ age_cat, success = "Yes") %>% 
  hypothesize(null = "independence")
Response: hobbyist (factor)
Explanatory: age_cat (factor)
Null Hypothesis: independence
# A tibble: 1,231 x 2
  hobbyist age_cat    
  <fct>    <fct>      
1 Yes      At least 30
2 Yes      At least 30
3 Yes      At least 30
4 Yes      Under 30   
5 Yes      At least 30
6 Yes      At least 30
7 No       Under 30   
# ... with 1,224 more rows
R में Hypothesis Testing

generate() को प्रेरित करना

$H_{0}$: 30 से कम उम्र के शौक़ियाओं का proportion, कम से कम 30 वाले शौक़ियाओं के proportion के बराबर है.

यदि $H_{0}$ सत्य है, तो

  • हर पंक्ति में, hobbyist मान किसी भी age श्रेणी के साथ समान संभावना से आ सकता था.
  • इसे सिमुलेट करने के लिए, age श्रेणियाँ स्थिर रखते हुए hobbyist मानों को permute (shuffle) कर सकते हैं.
R में Hypothesis Testing
stack_overflow_imbalanced


# A tibble: 1,231 x 2
  hobbyist age_cat    
  <fct>    <fct>      
1 Yes      At least 30
2 Yes      At least 30
3 Yes      At least 30
4 Yes      Under 30   
5 Yes      At least 30
6 Yes      At least 30
7 No       Under 30   
# ... with 1,224 more rows
bind_cols(
  stack_overflow_imbalanced %>% 
    select(hobbyist) %>% 
    slice_sample(prop = 1),
  stack_overflow_imbalanced %>% 
    select(age_cat)
)
# A tibble: 1,231 x 2
  hobbyist age_cat    
  <fct>    <fct>      
1 Yes      At least 30
2 Yes      At least 30
3 No       At least 30
4 No       Under 30   
5 Yes      At least 30
6 Yes      At least 30
7 Yes      Under 30   
# ... with 1,224 more rows
R में Hypothesis Testing

कई replicates जनरेट करना

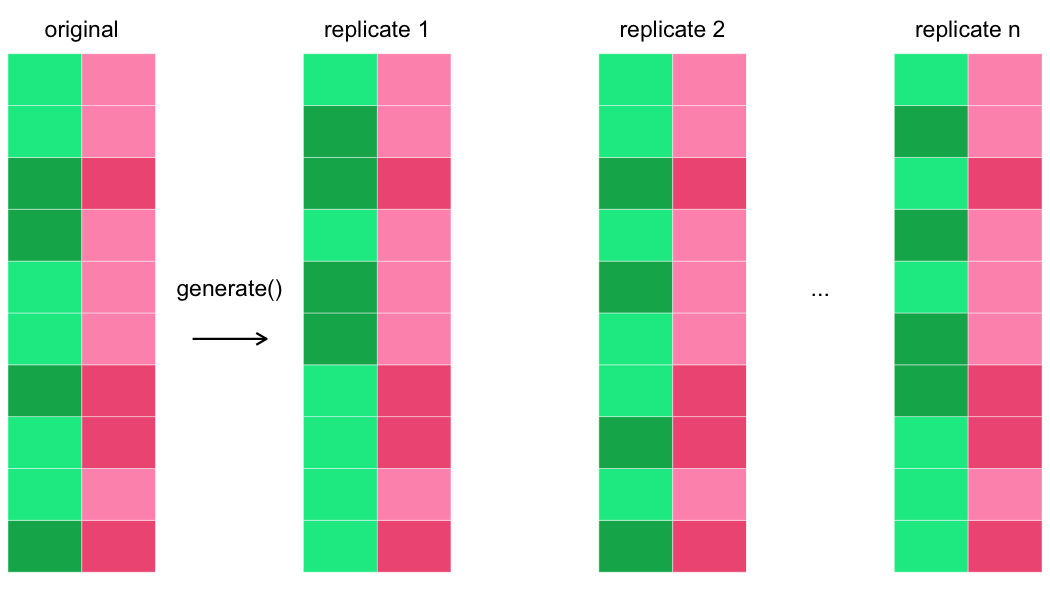
बाएँ ओर specify किए गए कॉलमों से बना दो-कॉलम का ग्रिड है। दाईं ओर "generate" शब्द और दाहिनी दिशा में तीर है। तीर के दाईं ओर तीन और दो-कॉलम ग्रिड हैं, जो replicates दर्शाते हैं। हर replicate के दाएँ कॉलम मूल डेटासेट के दाएँ कॉलम जैसे हैं, यानी explanatory वैरिएबल अपरिवर्तित है। हर replicate का बायाँ कॉलम अलग है, यानी response वैरिएबल permute हुआ है.

R में Hypothesis Testing

generate()

generate() null hypothesis को दर्शाता simulated डेटा बनाता है.

  • "independence" null hypothesis के लिए, type को "permute" सेट करें.
  • "point" null hypothesis के लिए, type को "bootstrap" या "simulate" सेट करें.
stack_overflow_imbalanced %>%
  specify(hobbyist ~ age_cat, success = "Yes") %>% 
  hypothesize(null = "independence") %>% 
  generate(reps = 5000, type = "permute")
Response: hobbyist (factor)
Explanatory: age_cat (factor)
Null Hypothesis: independence
# A tibble: 6,155,000 x 3
# Groups:   replicate [5,000]
  hobbyist age_cat     replicate
  <fct>    <fct>           <int>
1 Yes      At least 30         1
2 Yes      At least 30         1
3 Yes      At least 30         1
4 Yes      Under 30            1
5 Yes      At least 30         1
6 Yes      At least 30         1
7 Yes      Under 30            1
# ... with 6,154,993 more rows
R में Hypothesis Testing

टेस्ट स्टैटिस्टिक निकालना

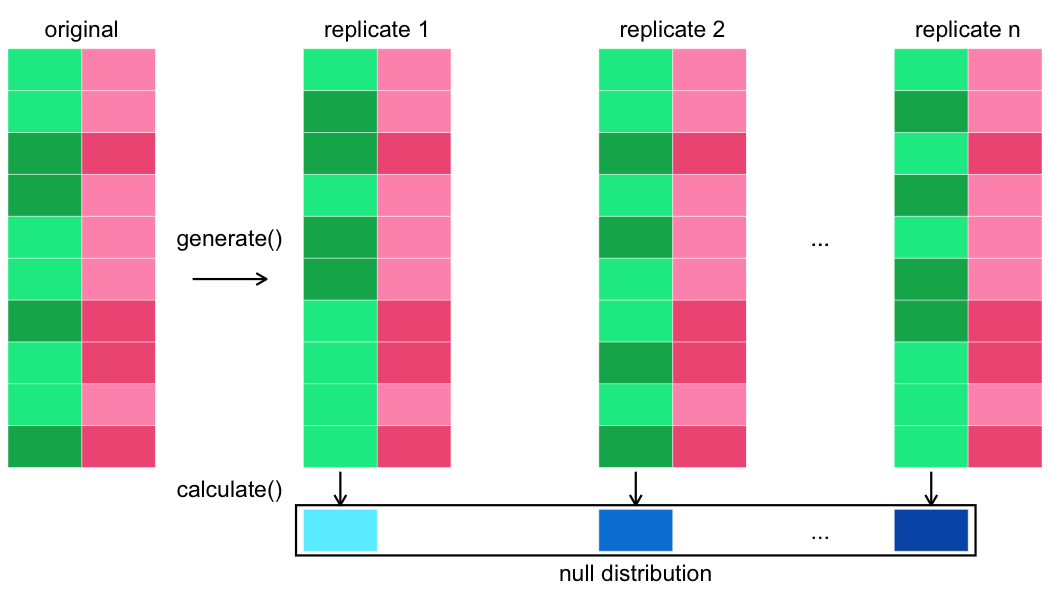
generation चरण में दिखे मूल डेटासेट और replicates के ग्रिड फिर दिखाए गए हैं। नीचे 'calculate' लिखा है और हर replicate के नीचे नीचे की ओर तीर है। हर तीर के नीचे एक shaded सेल है जो test statistic दर्शाता है। सभी replicates के test statistics के चारों ओर एक बॉक्स है, लेबल 'null distribution'.

R में Hypothesis Testing

calculate()

calculate() टेस्ट स्टैटिस्टिक्स का एक distribution निकालता है, जिसे null distribution कहते हैं.

null_distn <- stack_overflow_imbalanced %>%
  specify(
    hobbyist ~ age_cat, 
    success = "Yes"
  ) %>%
  hypothesize(null = "independence") %>%
  generate(reps = 5000, type = "permute") %>%
  calculate(
    stat = "diff in props", 
    order = c("At least 30", "Under 30")
  )
# A tibble: 5,000 x 2
  replicate    stat
      <int>   <dbl>
1         1  0.0896
2         2  0.0896
3         3 -0.180 
4         4  0.157 
5         5  0.0896
6         6 -0.113 
7         7  0.0221
# ... with 4,993 more rows
1 ?calculate की help पेज पर सभी संभावित टेस्ट स्टैटिस्टिक्स सूचीबद्ध हैं.
R में Hypothesis Testing

null distribution को visualize करना

visualize(null_distn)
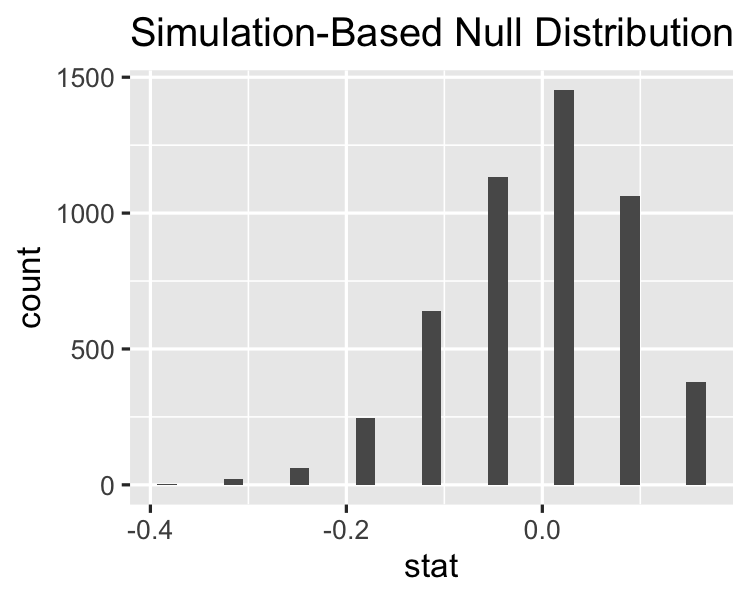
null distribution का एक histogram. यह बाएँ-तरफ़ा skewed है, और कुल नौ अलग-अलग मान हैं.

null_distn %>% count(stat)
# A tibble: 9 x 2
     stat     n
    <dbl> <int>
1 -0.383      2
2 -0.315     22
3 -0.248     63
4 -0.180    246
5 -0.113    641
6 -0.0454  1132
7  0.0221  1453
8  0.0896  1063
9  0.157    378
R में Hypothesis Testing

मूल डेटासेट पर टेस्ट स्टैटिस्टिक निकालना
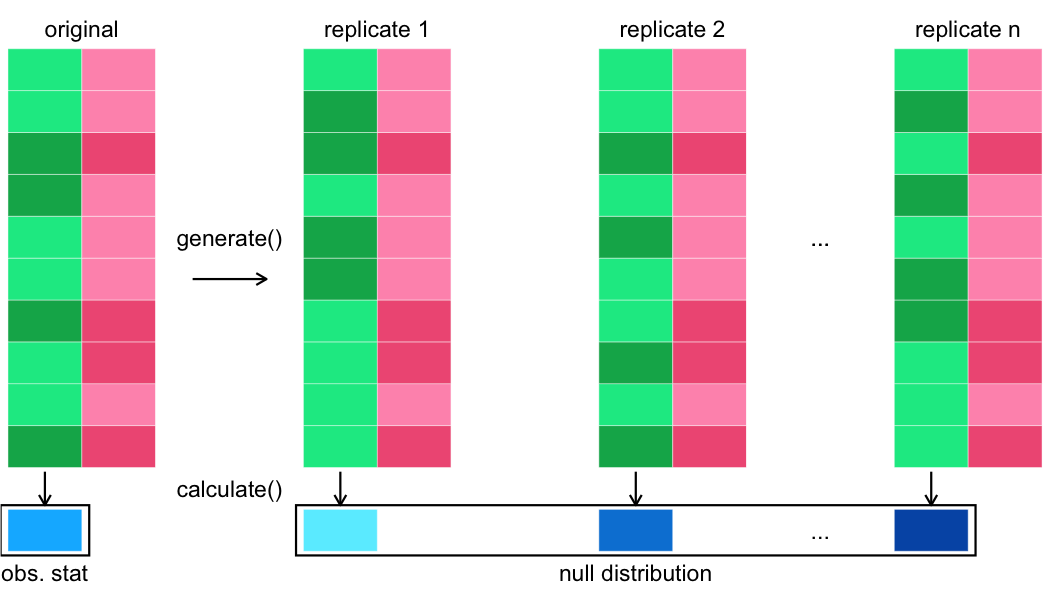
calculate चरण में दिखे मूल डेटासेट, replicates और null distribution सेल्स दिख रहे हैं। इस बार मूल डेटासेट के नीचे भी नीचे की ओर तीर है और उसके नीचे एक shaded सेल है। इस सेल के चारों ओर बॉक्स है, लेबल 'observed statistic'.

R में Hypothesis Testing

Observed statistic: specify() %>% calculate()

obs_stat <- stack_overflow_imbalanced %>%
  specify(hobbyist ~ age_cat, success = "Yes") %>%
  # hypothesize(null = "independence") %>%
  # generate(reps = 5000, type = "permute") %>%
  calculate(
    stat = "diff in props",
    order = c("At least 30", "Under 30")
  )
# A tibble: 1 x 1
   stat
  <dbl>
1 0.157
R में Hypothesis Testing

null distribution बनाम observed stat को visualize करना
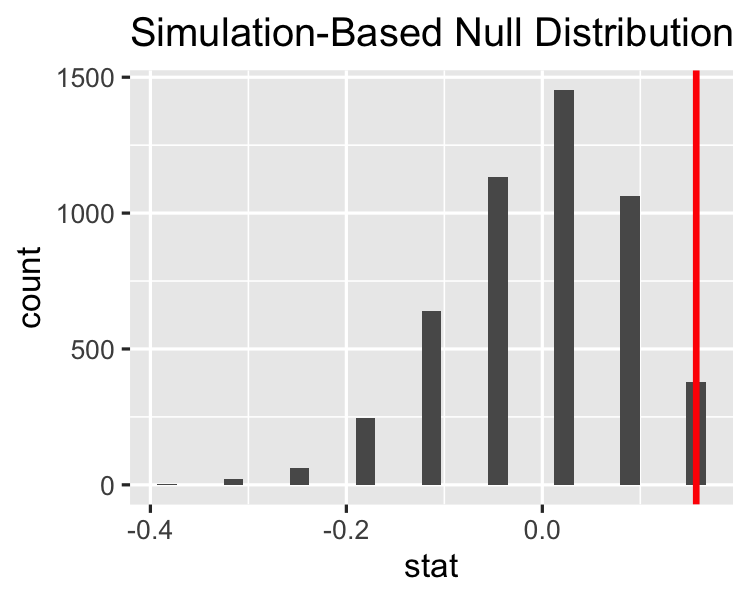
visualize(null_distn) +
  geom_vline(
    aes(xintercept = stat),
    data = observed_stat, 
    color = "red"
  )

null distribution का histogram, जिसमें observed statistic पर एक अतिरिक्त लाल वर्टिकल रेखा है। यह रेखा histogram की सबसे दायीं पट्टी पर है.

R में Hypothesis Testing

p-value प्राप्त करें

get_p_value(
  null_distn, obs_stat, 
  direction = "two sided"   # Not alternative = "two.sided"
)
# A tibble: 1 x 1
  p_value
    <dbl>
1   0.151
# A tibble: 1 x 6
  statistic chisq_df p_value alternative lower_ci upper_ci
      <dbl>    <dbl>   <dbl> <chr>          <dbl>    <dbl>
1      2.79        1  0.0949 two.sided    0.00718   0.0217
R में Hypothesis Testing

अभ्यास करते हैं!

R में Hypothesis Testing

Preparing Video For Download...