पेयरड t-टेस्ट्स
R में Hypothesis Testing

Richie Cotton
Data Evangelist at DataCamp
US रिपब्लिकन प्रेसिडेंट्स डेटासेट
| state | county | repub_percent_08 | repub_percent_12 |
|---|---|---|---|
| Alabama | Bullock | 25.69 | 23.51 |
| Alabama | Chilton | 78.49 | 79.78 |
| Alabama | Clay | 73.09 | 72.31 |
| Alabama | Cullman | 81.85 | 84.16 |
| Alabama | Escambia | 63.89 | 62.46 |
| Alabama | Fayette | 73.93 | 76.19 |
| Alabama | Franklin | 68.83 | 69.68 |
| ... | ... | ... | ... |
500 पंक्तियाँ; हर पंक्ति में राष्ट्रपति चुनाव के काउंटी-स्तर के वोट दिखते हैं.
परिकल्पनाएँ
प्रश्न: क्या 2008 में रिपब्लिकन उम्मीदवार का वोट प्रतिशत 2012 से कम था?
$H_{0}$: $\mu_{2008} - \mu_{2012} = 0$
$H_{A}$: $\mu_{2008} - \mu_{2012} < 0$
$\alpha = 0.05$ सिग्निफिकेंस लेवल रखें.
डेटा पेयर्ड है, क्योंकि हर वोट प्रतिशत उसी काउंटी के लिए है.
दो सैंपल से एक तक
sample_data <- repub_votes_potus_08_12 %>%
  mutate(diff = repub_percent_08 - repub_percent_12)
ggplot(sample_data, aes(x = diff)) +
  geom_histogram(binwidth = 1)
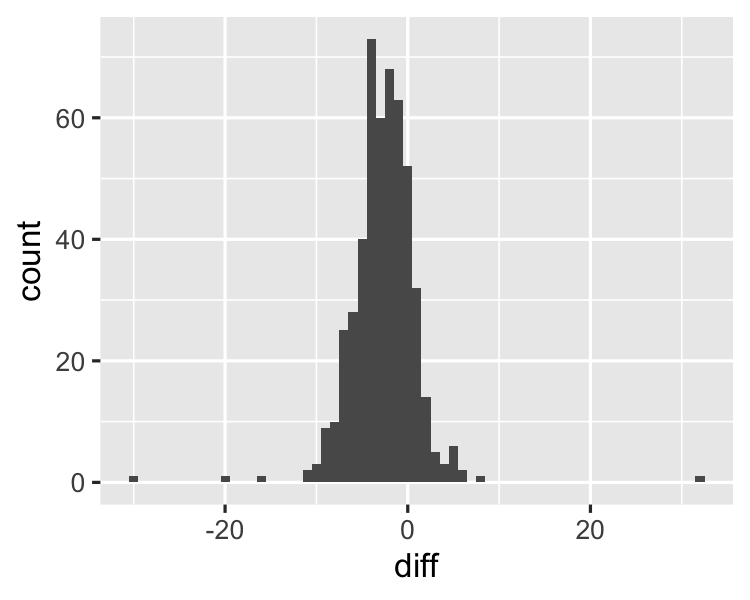
अंतर के सैंपल आँकड़े निकालें
sample_data %>%
  summarize(xbar_diff = mean(diff))
  xbar_diff
1 -2.643027
संशोधित परिकल्पनाएँ
पुरानी परिकल्पनाएँ
$H_{0}$: $\mu_{2008} - \mu_{2012} = 0$
$H_{A}$: $\mu_{2008} - \mu_{2012} < 0$
नई परिकल्पनाएँ
$H_{0}$: $\mu_{\text{diff}} = 0$
$H_{A}$: $ \mu_{\text{diff}} < 0$
$t = \dfrac{\bar{x}_{\text{diff}} - \mu_{\text{diff}}}{\sqrt{\dfrac{s_{diff}^2}{n_{\text{diff}}}}}$
$df = n_{diff} - 1$
p-वैल्यू की गणना
n_diff <- nrow(sample_data)
s_diff <- sample_data %>%
  summarize(sd_diff = sd(diff)) %>%
  pull(sd_diff)
t_stat <- (xbar_diff - 0) / sqrt(s_diff ^ 2 / n_diff)
-16.06374
degrees_of_freedom <- n_diff - 1
499
$t = \dfrac{\bar{x}_{\text{diff}} - \mu_{\text{diff}}}{\sqrt{\dfrac{s_{\text{diff}}^2}{n_{\text{diff}}}}}$
$df = n_{\text{diff}} - 1$
p_value <- pt(t_stat, df = degrees_of_freedom)
2.084965e-47
t.test() से दो माध्यों के अंतर का परीक्षण
t.test(# अंतर का वेक्टर sample_data$diff,# "two.sided", "less", "greater" में से चुनें alternative = "less",# शून्य परिकल्पना का पॉपुलेशन पैरामीटर mu = 0)
    One Sample t-test

data:  sample_data$diff
t = -16.064, df = 499, p-value < 2.2e-16
alternative hypothesis: true mean is less than 0
95 percent confidence interval:
     -Inf -2.37189
sample estimates:
mean of x
-2.643027
t.test() में paired = TRUE
t.test(
  sample_data$repub_percent_08,
  sample_data$repub_percent_12,
  alternative = "less",
  mu = 0,
  paired = TRUE
)
    Paired t-test

data:  sample_data$repub_percent_08 and
       sample_data$repub_percent_12
t = -16.064, df = 499, p-value < 2.2e-16
alternative hypothesis: true difference in means
                        is less than 0
95 percent confidence interval:
     -Inf -2.37189
sample estimates:
mean of the differences
              -2.643027
Unpaired t.test()
t.test(
  x = sample_data$repub_percent_08,
  y = sample_data$repub_percent_12,
  alternative = "less",
  mu = 0
)
अनपेयर्ड t-test में फॉल्स नेगेटिव की संभावना अधिक होती है (कम सांख्यिकीय पावर).
    Welch Two Sample t-test

data:  sample_data$repub_percent_08 and
       sample_data$repub_percent_12
t = -2.8788, df = 992.76, p-value = 0.002039
alternative hypothesis: true difference in means
                        is less than 0
95 percent confidence interval:
      -Inf -1.131469
sample estimates:
mean of x mean of y
 56.52034  59.16337
अभ्यास करते हैं!
R में Hypothesis Testing

