Chi-square goodness of fit tests

R में Hypothesis Testing

Richie Cotton

Data Evangelist at DataCamp

बैंगनी लिंक

आप ऑनलाइन कोडिंग समाधान ढूँढते हैं और पहला रिज़ल्ट लिंक बैंगनी है क्योंकि आप पहले ही उसे देख चुके हैं. आपको कैसा लगता है?

purple_link_counts <- stack_overflow %>% 
  count(purple_link)
# A tibble: 4 x 2
  purple_link           n
  <fct>             <int>
1 Hello, old friend  1330
2 Amused              409
3 Indifferent         426
4 Annoyed             290
R में Hypothesis Testing

हाइपोथेसिस बताना

hypothesized <- tribble(
  ~ purple_link, ~ prop,
  "Hello, old friend", 1 / 2,
  "Amused"           , 1 / 6,
  "Indifferent"      , 1 / 6,
  "Annoyed"          , 1 / 6
)
# A tibble: 4 x 2
  purple_link        prop
  <chr>             <dbl>
1 Hello, old friend 0.5  
2 Amused            0.167
3 Indifferent       0.167
4 Annoyed           0.167

$H_{0}$: सैंपल हाइपोथेसाइज़्ड डिस्ट्रीब्यूशन से मेल खाता है.

$H_{A}$: सैंपल हाइपोथेसाइज़्ड डिस्ट्रीब्यूशन से मेल नहीं खाता.

टेस्ट स्टैटिस्टिक $\chi^{2}$ मापता है कि हर समूह में ऑब्ज़र्व्ड नतीजे अपेक्षा से कितने दूर हैं.

alpha <- 0.01
1 tribble का अर्थ है "row-wise tibble"; इसे Star Trek की एलियन स्पीशीज़ से न मिलाएँ
R में Hypothesis Testing

श्रेणी अनुसार हाइपोथेटिकल काउंट्स

n_total <- nrow(stack_overflow)
hypothesized <- tribble(
  ~ purple_link, ~ prop,
  "Hello, old friend", 1 / 2,
  "Amused"           , 1 / 6,
  "Indifferent"      , 1 / 6,
  "Annoyed"          , 1 / 6
) %>%
  mutate(n = prop * n_total)
# A tibble: 4 x 3
  purple_link        prop     n
  <chr>             <dbl> <dbl>
1 Hello, old friend 0.5   1228.
2 Amused            0.167  409.
3 Indifferent       0.167  409.
4 Annoyed           0.167  409.
R में Hypothesis Testing

काउंट्स का विज़ुअलाइज़ेशन

ggplot(purple_link_counts, aes(purple_link, n)) +
  geom_col() +
  geom_point(data = hypothesized, color = "purple")
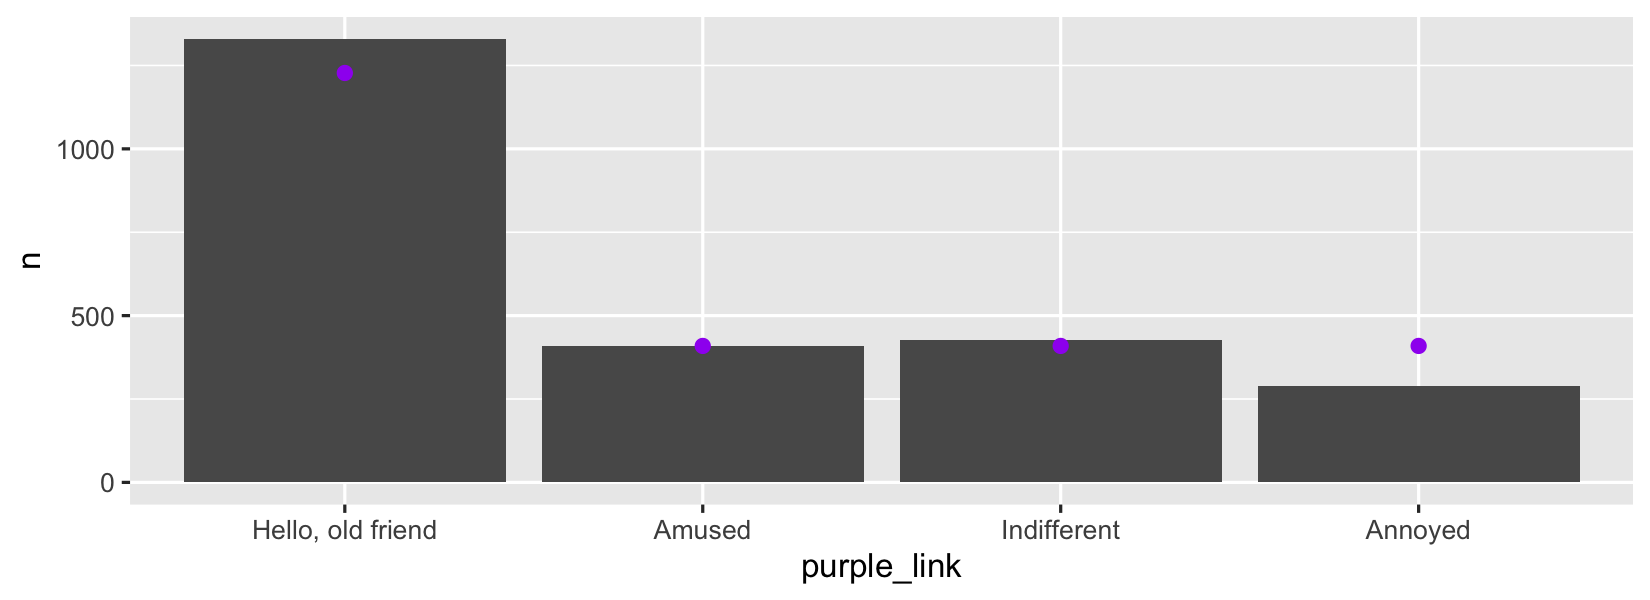
उत्तर की संख्या बनाम purple_link उत्तर का बार प्लॉट, जिसमें हाइपोथेटिकल संख्या दिखाने के लिए बैंगनी पॉइंट्स हैं

R में Hypothesis Testing

chisq_test() के साथ chi-square goodness of fit टेस्ट

hypothesized_props <- c(
  "Hello, old friend" = 1 / 2,
  Amused              = 1 / 6,
  Indifferent         = 1 / 6,
  Annoyed             = 1 / 6
)
library(infer)
stack_overflow %>% 
  chisq_test(
    response = purple_link,
    p = hypothesized_props
  )
# A tibble: 1 x 3
  statistic chisq_df       p_value
      <dbl>    <dbl>         <dbl>
1      44.0        3 0.00000000154
R में Hypothesis Testing

अभ्यास करते हैं!

R में Hypothesis Testing

Preparing Video For Download...