Hypothesis tests और z-scores

R में Hypothesis Testing

Richie Cotton

Data Evangelist at DataCamp

A/B testing

  • Electronic Arts (EA) एक वीडियो गेम कंपनी है.
  • 2013 में, उन्होंने SimCity 5 रिलीज़ किया.
  • लक्ष्य था गेम के प्री-ऑर्डर बढ़ाना.
  • उन्होंने A/B testing से अलग-अलग विज्ञापन परिदृश्यों को परखा.
  • इसमें यूजर्स को control और treatment समूहों में बाँटा जाता है.

Electronic Arts building

1 छवि श्रेय: "Electronic Arts" by majaX1 CC BY-NC-SA 2.0
R में Hypothesis Testing

Retail वेबपेज A/B test

Control

SimCity webpage with banner that says "pre-order and get $20 off your next purchase"

Treatment

SimCity webpage without banner

R में Hypothesis Testing

A/B test के परिणाम

  • Treatment समूह (कोई विज्ञापन नहीं) में खरीदारी control समूह (विज्ञापन के साथ) से 43.4% अधिक हुई.
  • यह धारणा कि "विज्ञापन दिखाने से बिक्री बढ़ेगी" पूरी तरह गलत निकली.
  • क्या यह नतीजा statistically significant था या बस संयोग से?
  • यह तय करने के लिए EA का डेटा चाहिए.
  • ऐसा करने के लिए आप Sampling in R + इस कोर्स की तकनीकें उपयोग करेंगे.
R में Hypothesis Testing

Stack Overflow Developer Survey 2020

library(dplyr)
glimpse(stack_overflow)
Rows: 2,261
Columns: 8
$ respondent         <dbl> 36, 47, 69, 125, 147, 152, 166, 170, 187, 196, 221,…
$ age_first_code_cut <chr> "adult", "child", "child", "adult", "adult", "adult…
$ converted_comp     <dbl> 77556, 74970, 594539, 2000000, 37816, 121980, 48644…
$ job_sat            <fct> Slightly satisfied, Very satisfied, Very satisfied,…
$ purple_link        <chr> "Hello, old friend", "Hello, old friend", "Hello, o…
$ age_cat            <chr> "At least 30", "At least 30", "Under 30", "At least…
$ age                <dbl> 34, 53, 25, 41, 28, 30, 28, 26, 43, 23, 24, 35, 37,…
$ hobbyist           <chr> "Yes", "Yes", "Yes", "Yes", "No", "Yes", "Yes", "Ye…
R में Hypothesis Testing

औसत पर परिकल्पना लगाना

एक परिकल्पना:

डेटा वैज्ञानिकों की आबादी का वार्षिक औसत पारिश्रमिक $110,000 है.

पॉइंट एस्टीमेट (सैंपल सांख्यिकीय):

mean_comp_samp <- mean(stack_overflow$converted_comp)
mean_comp_samp <- stack_overflow %>% 
  summarize(mean_compensation = mean(converted_comp)) %>% 
  pull(mean_compensation)
119574.7
R में Hypothesis Testing

Bootstrap वितरण बनाना

# Step 3. Repeat steps 1 & 2 many times
so_boot_distn <- replicate(
  n = 5000,
  expr = {
    # Step 1. Resample
    stack_overflow %>%
      slice_sample(prop = 1, replace = TRUE) %>%
      # Step 2. Calculate point estimate
      summarize(mean_compensation = mean(converted_comp)) %>% 
      pull(mean_compensation)
  }
)
1 Bootstrap वितरण Chapter 4 (Sampling in R) में पढ़ाया गया है
R में Hypothesis Testing

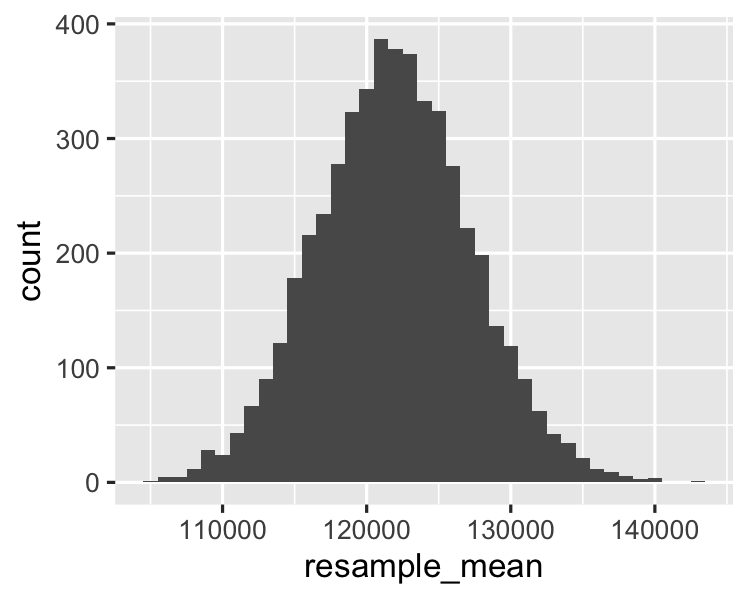
Bootstrap वितरण का विज़ुअलाइज़ेशन

tibble(resample_mean = so_boot_distn) %>%
  ggplot(aes(resample_mean)) +
  geom_histogram(binwidth = 1000)

Histogram of the bootstrap distribution - it's bell shaped and ranges roughly between 110000 and 140000

R में Hypothesis Testing

Standard error

std_error <- sd(so_boot_distn)
5511.674
R में Hypothesis Testing

z-scores

$\text{standardized value} = \dfrac{\text{value} - \text{mean}}{\text{standard deviation}}$

$z = \dfrac{\text{sample stat} - \text{hypoth. param. value}}{\text{standard error}}$

$z = \dfrac{\$119,574.7 - \$110,000}{\$5511.67} = 1.737$

mean_comp_samp
119574.7
mean_comp_hyp <- 110000
std_error
5511.674
z_score <- (mean_comp_samp - mean_comp_hyp) / std_error
1.737171
R में Hypothesis Testing

परिकल्पना की जाँच

  • 1.737171 बड़ा है या छोटा?
  • यही इस कोर्स का लक्ष्य है!
Hypothesis testing उपयोग मामला:

तय करें कि सैंपल के आँकड़े अपेक्षित (या "hypothesized" मान) के क़रीब हैं या काफ़ी दूर.

R में Hypothesis Testing

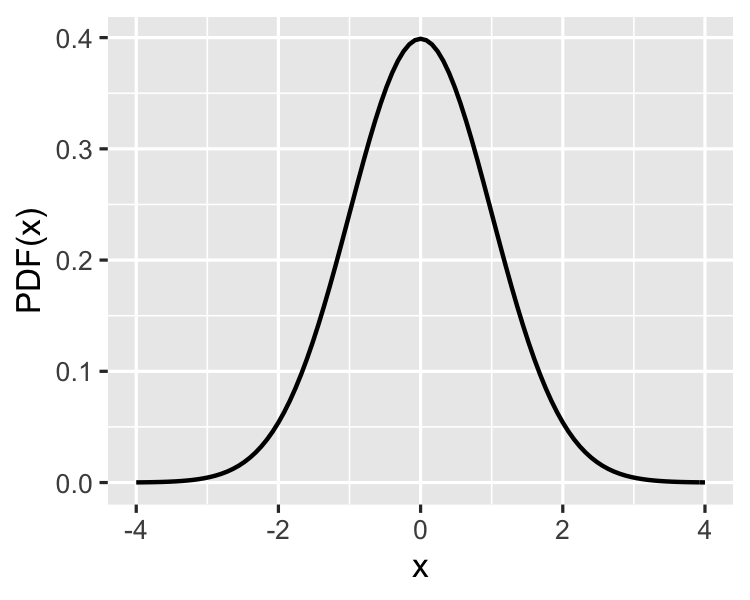
Standard normal (z) वितरण

Standard normal distribution: ऐसा normal वितरण जिसका mean शून्य और standard deviation 1 हो.

tibble(x = seq(-4, 4, 0.01)) %>% 
  ggplot(aes(x)) +
  stat_function(fun = dnorm) +
  ylab("PDF(x)")

Density plot of the PDF for the standard normal distribution

R में Hypothesis Testing

अभ्यास करते हैं!

R में Hypothesis Testing

Preparing Video For Download...