R में Hypothesis Testing
Richie Cotton
Data Evangelist at DataCamp
$p$: population proportion (अज्ञात population parameter)
$\hat{p}$: sample proportion (sample statistic)
$p_{0}$: hypothesized population proportion
$$ z = \frac{\hat{p} - \text{mean}(\hat{p})}{\text{standard error}(\hat{p})} = \frac{\hat{p} - p}{\text{standard error}(\hat{p})} $$
यदि $H_{0}$ सत्य है, तो $p = p_{0}$, अतः
$$ z = \dfrac{\hat{p} - p_{0}}{\text{standard error}(\hat{p})} $$
$SE(\bar{x}_{\text{child}} - \bar{x}_{\text{adult}}) \approx \sqrt{\dfrac{s_{\text{child}}^2}{n_{\text{child}}} + \dfrac{s_{\text{adult}}^2}{n_{\text{adult}}}}$
$SE_{\hat{p}} = \sqrt{\dfrac{p_{0}*(1-p_{0})}{n}}$
मान लें $H_{0}$ सत्य है,
$z = \dfrac{\hat{p} - p_{0}}{\sqrt{\dfrac{p_{0}*(1-p_{0})}{n}}}$
यह केवल सैंपल जानकारी ($\hat{p}$ और $n$) और हाइपोथेसाइज़्ड पैरामीटर ($p_{0}$) का उपयोग करता है.
$t = \dfrac{(\bar{x}_{\text{child}} - \bar{x}_{\text{adult}})}{\sqrt{\dfrac{s_{\text{child}}^2}{n_{\text{child}}} + \dfrac{s_{\text{adult}}^2}{n_{\text{adult}}}}}$
$H_{0}$: 30 से कम उम्र वाले SO यूज़र्स का proportion 0.5 के बराबर है.
$H_{A}$: 30 से कम उम्र वाले SO यूज़र्स का proportion 0.5 के बराबर नहीं है.
alpha <- 0.01
stack_overflow %>%
count(age_cat)
# A tibble: 2 x 2
age_cat n
<chr> <int>
1 At least 30 1050
2 Under 30 1216
p_hat <- stack_overflow %>%
summarize(prop_under_30 = mean(age_cat == "Under 30")) %>%
pull(prop_under_30)
0.5366
p_0 <- 0.50
n <- nrow(stack_overflow)
2266
$z = \dfrac{\hat{p} - p_{0}}{\sqrt{\dfrac{p_{0}*(1-p_{0})}{n}}}$
numerator <- p_hat - p_0
denominator <- sqrt(p_0 * (1 - p_0) / n)
z_score <- numerator / denominator
3.487
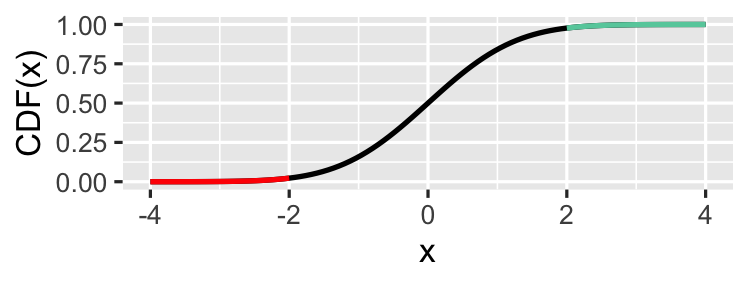
लेफ्ट-टेल्ड ("less than")
p_value <- pnorm(z_score)
राइट-टेल्ड ("greater than")
p_value <- pnorm(z_score, lower.tail = FALSE)
टू-टेल्ड ("not equal")
p_value <- pnorm(z_score) +
pnorm(z_score, lower.tail = FALSE)
p_value <- 2 * pnorm(z_score)
0.000244
p_value <= alpha
TRUE
R में Hypothesis Testing