Chi-square goodness of fit tests
Python में Hypothesis Testing

James Chapman
Curriculum Manager, DataCamp
Purple links
जब आप पाते हैं कि आपने पहले ही टॉप रिसोर्स देख लिया है, तो आपको कैसा लगता है?
purple_link_counts = stack_overflow['purple_link'].value_counts()
purple_link_counts = purple_link_counts.rename_axis('purple_link')\
                                       .reset_index(name='n')\
                                       .sort_values('purple_link')
         purple_link     n
2             Amused   368
3            Annoyed   263
0  Hello, old friend  1225
1        Indifferent   405
परिकल्पनाएँ घोषित करना
hypothesized = pd.DataFrame({
  'purple_link': ['Amused', 'Annoyed', 'Hello, old friend', 'Indifferent'],
  'prop': [1/6, 1/6, 1/2, 1/6]})
         purple_link      prop
0             Amused  0.166667
1            Annoyed  0.166667
2  Hello, old friend  0.500000
3        Indifferent  0.166667
$H_{0}$: सैंपल परिकल्पित वितरण से मेल खाता है
$H_{A}$: सैंपल परिकल्पित वितरण से मेल नहीं खाता
$\chi^{2}$ मापता है कि हर समूह में ऑब्ज़र्व्ड परिणाम अपेक्षाओं से कितने दूर हैं
alpha = 0.01
श्रेणीवार अनुमानित काउंट्स
n_total = len(stack_overflow)
hypothesized["n"] = hypothesized["prop"] * n_total
         purple_link      prop            n
0             Amused  0.166667   376.833333
1            Annoyed  0.166667   376.833333
2  Hello, old friend  0.500000  1130.500000
3        Indifferent  0.166667   376.833333
काउंट्स को विज़ुअलाइज़ करना
import matplotlib.pyplot as plt plt.bar(purple_link_counts['purple_link'], purple_link_counts['n'], color='red', label='Observed')plt.bar(hypothesized['purple_link'], hypothesized['n'], alpha=0.5, color='blue', label='Hypothesized') plt.legend() plt.show()
काउंट्स को विज़ुअलाइज़ करना
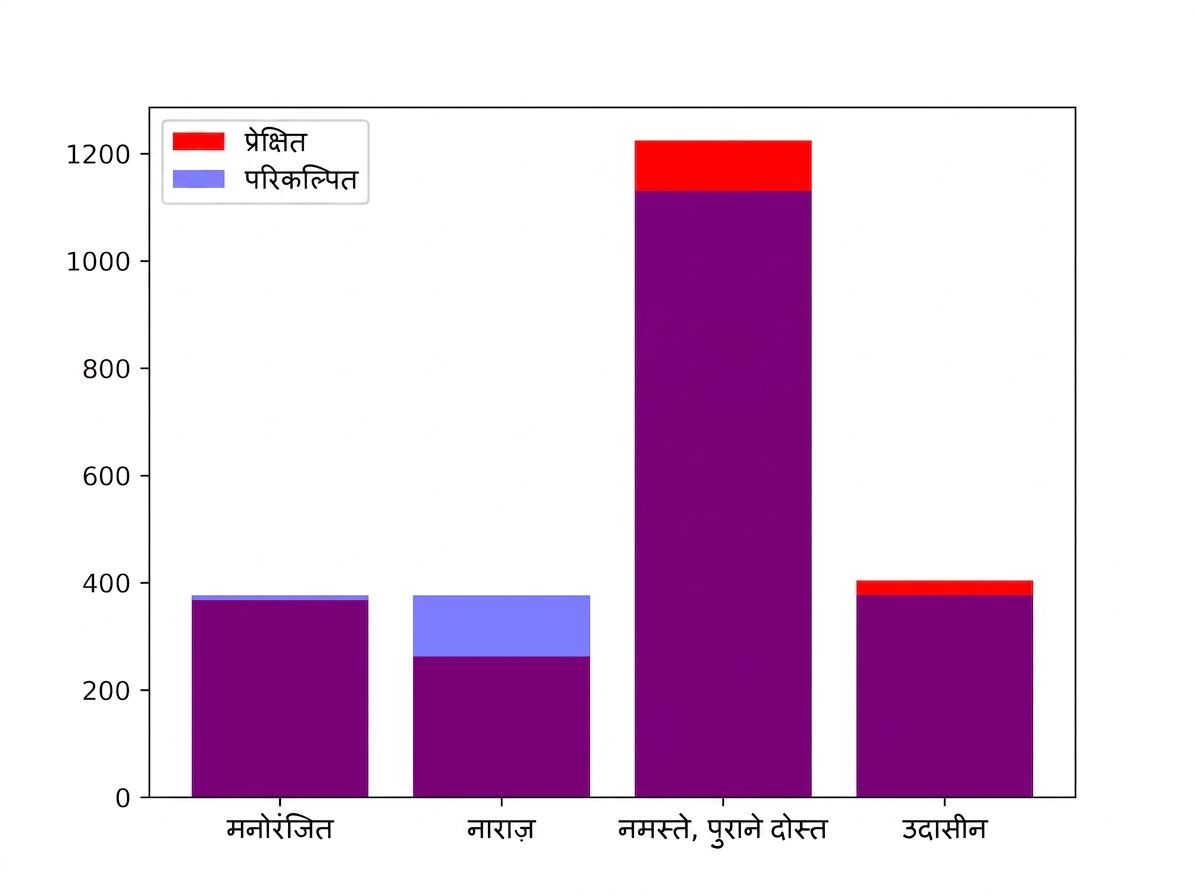
chi-square goodness of fit test
print(hypothesized)
         purple_link      prop            n
0             Amused  0.166667   376.833333
1            Annoyed  0.166667   376.833333
2  Hello, old friend  0.500000  1130.500000
3        Indifferent  0.166667   376.833333
from scipy.stats import chisquare
chisquare(f_obs=purple_link_counts['n'], f_exp=hypothesized['n'])
Power_divergenceResult(statistic=44.59840778416629, pvalue=1.1261810719413759e-09)
अभ्यास करते हैं!
Python में Hypothesis Testing

