Python में statsmodels के साथ Regression परिचय
Maarten Van den Broeck
Content Developer at DataCamp
| n_claims | total_payment_sek |
|---|---|
| 108 | 392.5 |
| 19 | 46.2 |
| 13 | 15.7 |
| 124 | 422.2 |
| 40 | 119.4 |
| ... | ... |
import pandas as pd
print(swedish_motor_insurance.mean())
n_claims 22.904762
total_payment_sek 98.187302
dtype: float64
print(swedish_motor_insurance['n_claims'].corr(swedish_motor_insurance['total_payment_sek']))
0.9128782350234068
| n_claims | total_payment_sek |
|---|---|
| 108 | 3925 |
| 19 | 462 |
| 13 | 157 |
| 124 | 4222 |
| 40 | 1194 |
| 200 | ??? |
जिस वैरिएबल की आप भविष्यवाणी करना चाहते हैं.
वे वैरिएबल्स जो बताते हैं कि response वैरिएबल कैसे बदलेगा.
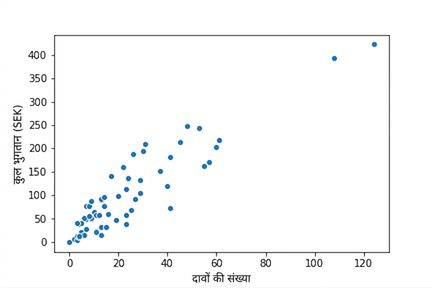
import matplotlib.pyplot as plt
import seaborn as sns
sns.scatterplot(x="n_claims",
y="total_payment_sek",
data=swedish_motor_insurance)
plt.show()

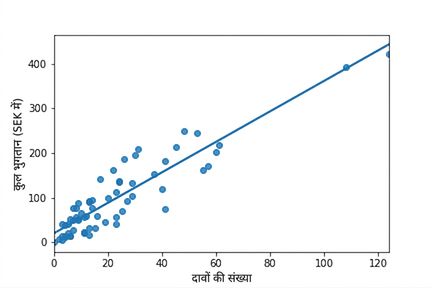
sns.regplot(x="n_claims",
y="total_payment_sek",
data=swedish_motor_insurance,
ci=None)

Linear regression मॉडलों का विज़ुअलाइज़ेशन और फिटिंग.
Linear regression से भविष्यवाणियाँ करना और model coefficients समझना.
Linear regression मॉडल की गुणवत्ता आँकना.
यही प्रक्रिया, पर logistic regression मॉडलों के साथ.
statsmodelsscikit-learnPython में statsmodels के साथ Regression परिचय