Python में statsmodels के साथ Regression परिचय
Maarten Van den Broeck
Content Developer at DataCamp
roach = fish[fish['species'] == "Roach"]
print(roach.head())
species mass_g length_cm
35 Roach 40.0 12.9
36 Roach 69.0 16.5
37 Roach 78.0 17.5
38 Roach 87.0 18.2
39 Roach 120.0 18.6

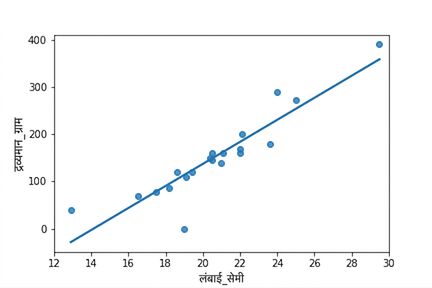
sns.regplot(x="length_cm",
y="mass_g",
data=roach,
ci=None)
plt.show()

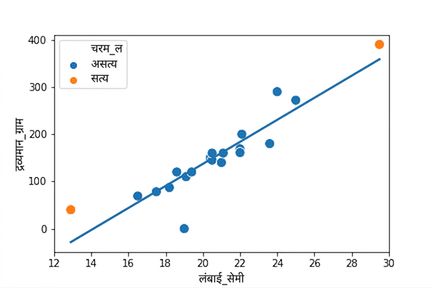
roach["extreme_l"] = ((roach["length_cm"] < 15) |
(roach["length_cm"] > 26))
fig = plt.figure()
sns.regplot(x="length_cm",
y="mass_g",
data=roach,
ci=None)
sns.scatterplot(x="length_cm",
y="mass_g",
hue="extreme_l",
data=roach)

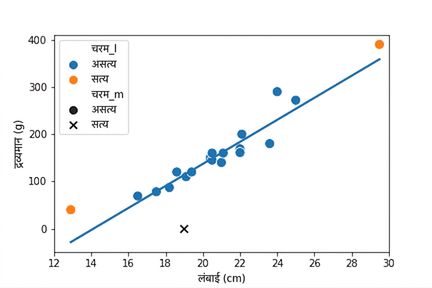
roach["extreme_m"] = roach["mass_g"] < 1
fig = plt.figure()
sns.regplot(x="length_cm",
y="mass_g",
data=roach,
ci=None)
sns.scatterplot(x="length_cm",
y="mass_g",
hue="extreme_l",
style="extreme_m",
data=roach)

"Leverage" बताता है कि explanatory variable के मान कितने चरम हैं.
"Influence" मापता है कि अगर आप मॉडलिंग के समय उस observation को डेटासेट से हटा दें तो मॉडल कितना बदल जाएगा.

mdl_roach = ols("mass_g ~ length_cm", data=roach).fit()summary_roach = mdl_roach.get_influence().summary_frame()roach["leverage"] = summary_roach["hat_diag"] print(roach.head())
species mass_g length_cm leverage
35 Roach 40.0 12.9 0.313729
36 Roach 69.0 16.5 0.125538
37 Roach 78.0 17.5 0.093487
38 Roach 87.0 18.2 0.076283
39 Roach 120.0 18.6 0.068387
"Cook's distance" influence का सबसे आम माप है.
roach["cooks_dist"] = summary_roach["cooks_d"]
print(roach.head())
species mass_g length_cm leverage cooks_dist
35 Roach 40.0 12.9 0.313729 1.074015
36 Roach 69.0 16.5 0.125538 0.010429
37 Roach 78.0 17.5 0.093487 0.000020
38 Roach 87.0 18.2 0.076283 0.001980
39 Roach 120.0 18.6 0.068387 0.006610
print(roach.sort_values("cooks_dist", ascending = False))
species mass_g length_cm leverage cooks_dist
35 Roach 40.0 12.9 0.313729 1.074015 # बहुत छोटा roach
54 Roach 390.0 29.5 0.394740 0.365782 # बहुत लंबा roach
40 Roach 0.0 19.0 0.061897 0.311852 # शून्य द्रव्यमान वाला roach
52 Roach 290.0 24.0 0.099488 0.150064
51 Roach 180.0 23.6 0.088391 0.061209
.. ... ... ... ... ...
43 Roach 150.0 20.4 0.050264 0.000257
44 Roach 145.0 20.5 0.050092 0.000256
42 Roach 120.0 19.4 0.056815 0.000199
47 Roach 160.0 21.1 0.050910 0.000137
37 Roach 78.0 17.5 0.093487 0.000020
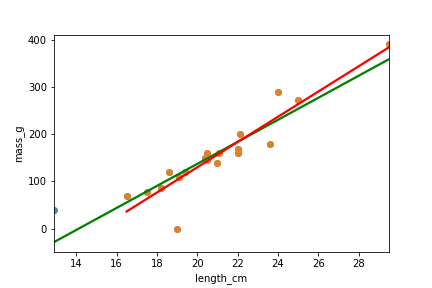
roach_not_short = roach[roach["length_cm"] != 12.9]
sns.regplot(x="length_cm",
y="mass_g",
data=roach,
ci=None,
line_kws={"color": "green"})
sns.regplot(x="length_cm",
y="mass_g",
data=roach_not_short,
ci=None,
line_kws={"color": "red"})

Python में statsmodels के साथ Regression परिचय