Вступ до візуалізації даних із Seaborn
Content Team
DataCamp


Seaborn створює два типи об'єктів: FacetGrid і AxesSubplot
g = sns.scatterplot(x="height", y="weight", data=df)type(g)
> matplotlib.axes._subplots.AxesSubplot

| Object Type | Plot Types | Characteristics |
|---|---|---|
FacetGrid |
relplot(), catplot() |
Може створювати субплоти |
AxesSubplot |
scatterplot(), countplot(), тощо |
Створює лише один графік |
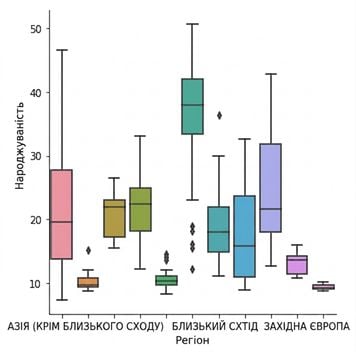
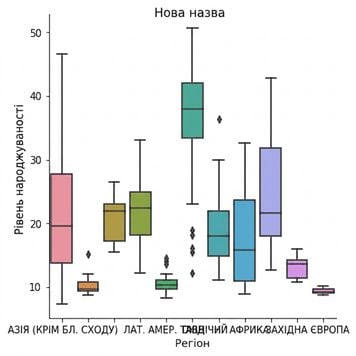
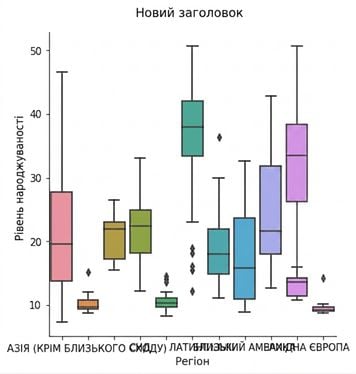
g = sns.catplot(x="Region", y="Birthrate", data=gdp_data, kind="box")g.figure.suptitle("New Title")plt.show()

g = sns.catplot(x="Region",
y="Birthrate",
data=gdp_data,
kind="box")
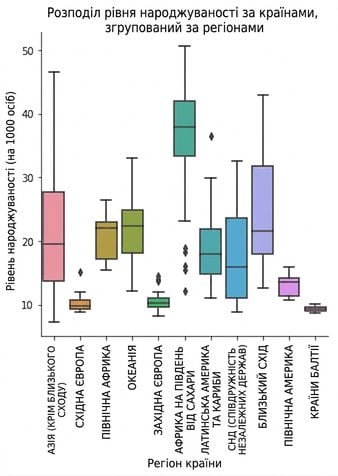
g.figure.suptitle("New Title",
y=1.03)
plt.show()

Вступ до візуалізації даних із Seaborn