Кількісні порівняння: стовпчикові діаграми

Вступ до візуалізації даних з Matplotlib

Ariel Rokem

Data Scientist

Олімпійські медалі

,Gold, Silver, Bronze
United States, 137, 52, 67
Germany, 47, 43, 67
Great Britain, 64, 55, 26
Russia, 50, 28, 35
China, 44, 30, 35
France, 20, 55, 21
Australia, 23, 34, 25
Italy, 8, 38, 24
Canada, 4, 4, 61
Japan, 17, 13, 34
Вступ до візуалізації даних з Matplotlib

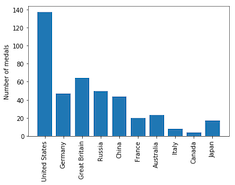
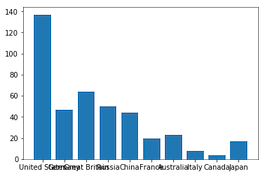
Олімпійські медалі: візуалізація даних

medals = pd.read_csv('medals_by_country_2016.csv', index_col=0)

fig, ax = plt.subplots()
ax.bar(medals.index, medals["Gold"]) plt.show()
Вступ до візуалізації даних з Matplotlib

Інтермедія: обертання підписів поділок

fig, ax = plt.subplots()
ax.bar(medals.index, medals["Gold"])

ax.set_xticklabels(medals.index, rotation=90) ax.set_ylabel("Number of medals")
plt.show()
Вступ до візуалізації даних з Matplotlib

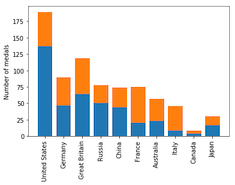
Олімпійські медалі: інші медалі

fig, ax = plt.subplots
ax.bar(medals.index, medals["Gold"])

ax.bar(medals.index, medals["Silver"], bottom=medals["Gold"])
ax.set_xticklabels(medals.index, rotation=90) ax.set_ylabel("Number of medals") plt.show()

Вступ до візуалізації даних з Matplotlib

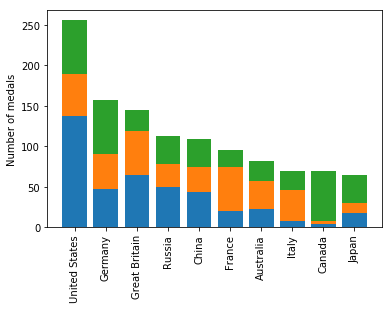
Олімпійські медалі: усі три

fig, ax = plt.subplots
ax.bar(medals.index, medals["Gold"])

ax.bar(medals.index, medals["Silver"], bottom=medals["Gold"])

ax.bar(medals.index, medals["Bronze"], bottom=medals["Gold"] + medals["Silver"])
ax.set_xticklabels(medals.index, rotation=90) ax.set_ylabel("Number of medals") plt.show()
Вступ до візуалізації даних з Matplotlib

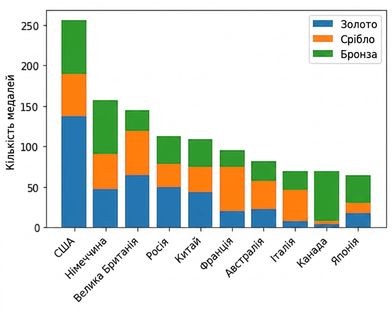
Суміщена стовпчикова діаграма

Вступ до візуалізації даних з Matplotlib

Додавання легенди

fig, ax = plt.subplots
ax.bar(medals.index, medals["Gold"])
ax.bar(medals.index, medals["Silver"], bottom=medals["Gold"])
ax.bar(medals.index, medals["Bronze"],
       bottom=medals["Gold"] + medals["Silver"])

ax.set_xticklabels(medals.index, rotation=90)
ax.set_ylabel("Number of medals")
Вступ до візуалізації даних з Matplotlib

Додавання легенди

fig, ax = plt.subplots
ax.bar(medals.index, medals["Gold"], label="Gold")
ax.bar(medals.index, medals["Silver"], bottom=medals["Gold"], 
       label="Silver")
ax.bar(medals.index, medals["Bronze"],
       bottom=medals["Gold"] + medals["Silver"], 
       label="Bronze")

ax.set_xticklabels(medals.index, rotation=90)
ax.set_ylabel("Number of medals")

ax.legend() plt.show()
Вступ до візуалізації даних з Matplotlib

Суміщена стовпчикова діаграма з легендою
Вступ до візуалізації даних з Matplotlib

Створіть стовпчикову діаграму!

Вступ до візуалізації даних з Matplotlib

Preparing Video For Download...