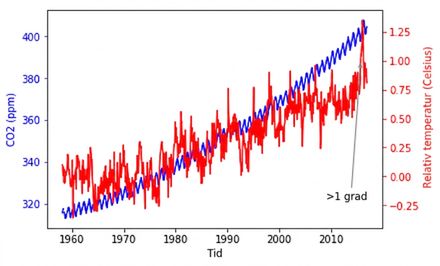
Annotera tidsseriedata
Introduktion till datavisualisering med Matplotlib

Ariel Rokem
Data Scientist
Tidsseriedata
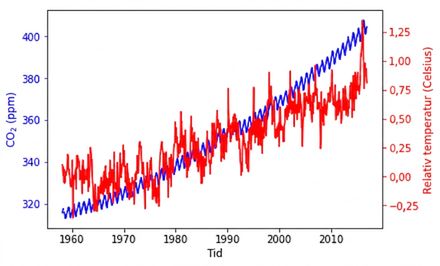
Annotering
fig, ax = plt.subplots() plot_timeseries(ax, climate_change.index, climate_change['co2'], 'blue', 'Time', 'CO2 (ppm)') ax2 = ax.twinx() plot_timeseries(ax2, climate_change.index, climate_change['relative_temp'], 'red', 'Time', 'Relative temperature (Celsius)')ax2.annotate(">1 degree", xy=(pd.Timestamp("2015-10-06"), 1))plt.show()
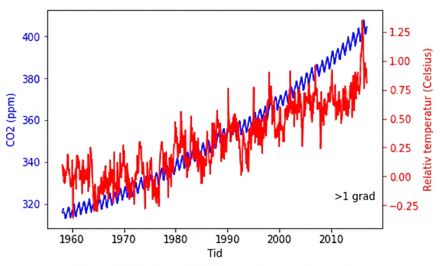
Placera texten
ax2.annotate(">1 degree",
             xy=(pd.Timestamp('2015-10-06'), 1),
             xytext=(pd.Timestamp('2008-10-06'), -0.2))
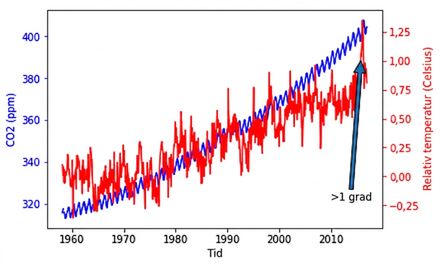
Lägg till pilar i annoteringen
ax2.annotate(">1 degree",
             xy=(pd.Timestamp('2015-10-06'), 1),
             xytext=(pd.Timestamp('2008-10-06'), -0.2),
             arrowprops={})
Anpassa pilegenskaper
ax2.annotate(">1 degree",
             xy=(pd.Timestamp('2015-10-06'), 1),
             xytext=(pd.Timestamp('2008-10-06'), -0.2),
             arrowprops={"arrowstyle":"->", "color":"gray"})