Kvantitativa jämförelser: stapeldiagram

Introduktion till datavisualisering med Matplotlib

Ariel Rokem

Data Scientist

Olympiska medaljer

,Gold, Silver, Bronze
United States, 137, 52, 67
Germany, 47, 43, 67
Great Britain, 64, 55, 26
Russia, 50, 28, 35
China, 44, 30, 35
France, 20, 55, 21
Australia, 23, 34, 25
Italy, 8, 38, 24
Canada, 4, 4, 61
Japan, 17, 13, 34
Introduktion till datavisualisering med Matplotlib

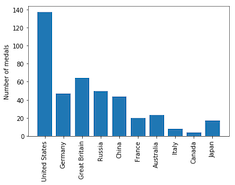
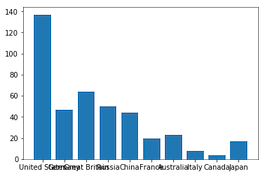
Olympiska medaljer: visualisera datan

medals = pd.read_csv('medals_by_country_2016.csv', index_col=0)

fig, ax = plt.subplots()
ax.bar(medals.index, medals["Gold"]) plt.show()
Introduktion till datavisualisering med Matplotlib

Intermezzo: rotera axetiketterna

fig, ax = plt.subplots()
ax.bar(medals.index, medals["Gold"])

ax.set_xticklabels(medals.index, rotation=90) ax.set_ylabel("Number of medals")
plt.show()
Introduktion till datavisualisering med Matplotlib

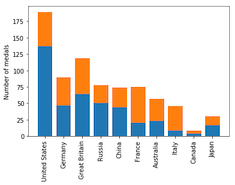
Olympiska medaljer: visualisera de övriga medaljerna

fig, ax = plt.subplots
ax.bar(medals.index, medals["Gold"])

ax.bar(medals.index, medals["Silver"], bottom=medals["Gold"])
ax.set_xticklabels(medals.index, rotation=90) ax.set_ylabel("Number of medals") plt.show()

Introduktion till datavisualisering med Matplotlib

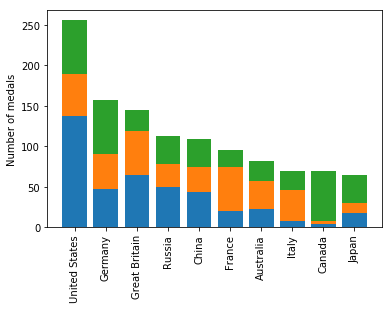
Olympiska medaljer: visualisera alla tre

fig, ax = plt.subplots
ax.bar(medals.index, medals["Gold"])

ax.bar(medals.index, medals["Silver"], bottom=medals["Gold"])

ax.bar(medals.index, medals["Bronze"], bottom=medals["Gold"] + medals["Silver"])
ax.set_xticklabels(medals.index, rotation=90) ax.set_ylabel("Number of medals") plt.show()
Introduktion till datavisualisering med Matplotlib

Staplat stapeldiagram

Introduktion till datavisualisering med Matplotlib

Lägga till en legend

fig, ax = plt.subplots
ax.bar(medals.index, medals["Gold"])
ax.bar(medals.index, medals["Silver"], bottom=medals["Gold"])
ax.bar(medals.index, medals["Bronze"],
       bottom=medals["Gold"] + medals["Silver"])

ax.set_xticklabels(medals.index, rotation=90)
ax.set_ylabel("Number of medals")
Introduktion till datavisualisering med Matplotlib

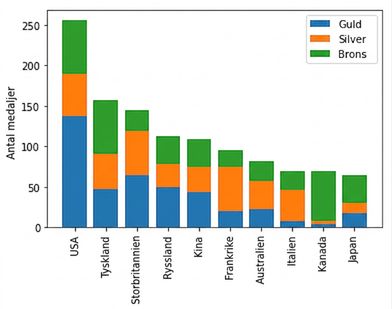
Lägga till en legend

fig, ax = plt.subplots
ax.bar(medals.index, medals["Gold"], label="Gold")
ax.bar(medals.index, medals["Silver"], bottom=medals["Gold"], 
       label="Silver")
ax.bar(medals.index, medals["Bronze"],
       bottom=medals["Gold"] + medals["Silver"], 
       label="Bronze")

ax.set_xticklabels(medals.index, rotation=90)
ax.set_ylabel("Number of medals")

ax.legend() plt.show()
Introduktion till datavisualisering med Matplotlib

Staplat stapeldiagram med legend

Introduktion till datavisualisering med Matplotlib

Nu kör vi en övning!

Introduktion till datavisualisering med Matplotlib

Preparing Video For Download...