Introduktion till Python för finans
Adina Howe
Professor
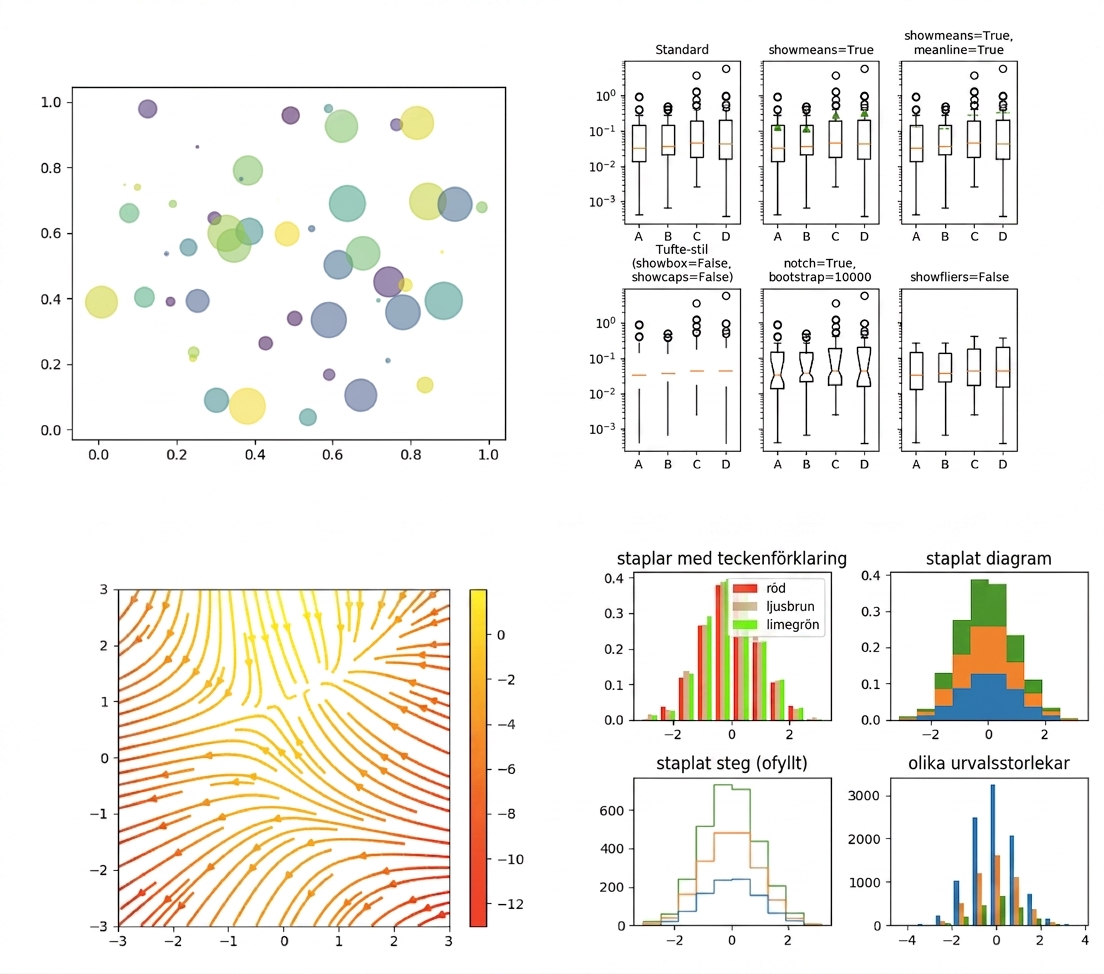
Se fler exempel i Matplotlib-galleriet via den här länken.
import matplotlib.pyplot as plt
plt.plot()
plt.show()
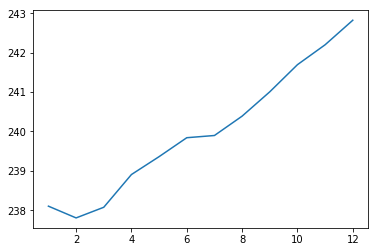
import matplotlib.pyplot as plt
plt.plot(months, prices)
plt.show()

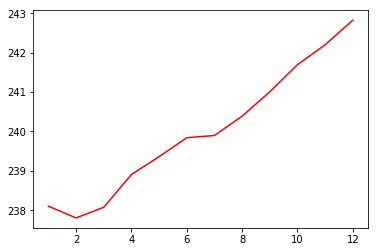
import matplotlib.pyplot as plt
plt.plot(months, prices, color = 'red')
plt.show()

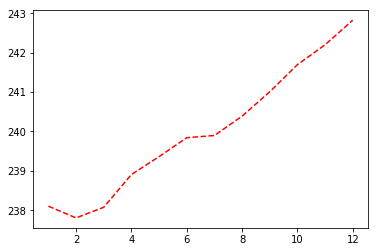
import matplotlib.pyplot as plt
plt.plot(months, prices, color = 'red', linestyle = '--')
plt.show()

| color | |
|---|---|
| 'green' | grön |
| 'red' | röd |
| 'cyan' | cyan |
| 'blue' | blå |
| linestyle | |
|---|---|
| '-' | heldragen linje |
| '--' | streckad linje |
| '-.' | streck-punkt-linje |
| ':' | prickad |
Mer dokumentation om färger och linjer finns här.
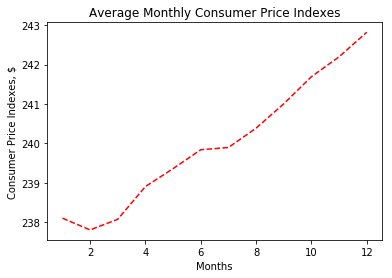
import matplotlib.pyplot as plt
plt.plot(months, prices, color = 'red', linestyle = '--')
# Add labels
plt.xlabel('Months')
plt.ylabel('Consumer Price Indexes, $')
plt.title('Average Monthly Consumer Price Indexes')
# Show plot
plt.show()

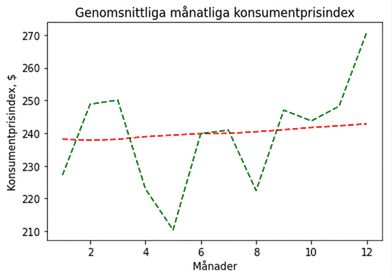
import matplotlib.pyplot as plt
plt.plot(months, prices, color = 'red', linestyle = '--')
# adding an additional line
plt.plot(months, prices_new, color = 'green', linestyle = '--')
plt.xlabel('Months')
plt.ylabel('Consumer Price Indexes, $')
plt.title('Average Monthly Consumer Price Indexes')
plt.show()

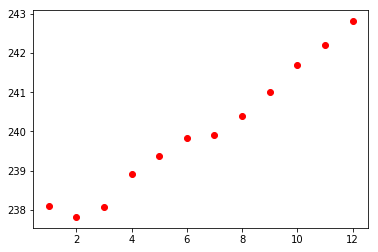
import matplotlib.pyplot as plt
plt.scatter(x = months, y = prices, color = 'red')
plt.show()

Introduktion till Python för finans