Parade t-test
Hypotestestning i R

Richie Cotton
Data Evangelist at DataCamp
Datamängd: republikanska presidentval i USA
| state | county | repub_percent_08 | repub_percent_12 |
|---|---|---|---|
| Alabama | Bullock | 25.69 | 23.51 |
| Alabama | Chilton | 78.49 | 79.78 |
| Alabama | Clay | 73.09 | 72.31 |
| Alabama | Cullman | 81.85 | 84.16 |
| Alabama | Escambia | 63.89 | 62.46 |
| Alabama | Fayette | 73.93 | 76.19 |
| Alabama | Franklin | 68.83 | 69.68 |
| ... | ... | ... | ... |
500 rader; varje rad representerar valresultat på countynivå i ett presidentval.
Hypoteser
Fråga: Var andelen röster för den republikanske kandidaten lägre 2008 jämfört med 2012?
$H_{0}$: $\mu_{2008} - \mu_{2012} = 0$
$H_{A}$: $\mu_{2008} - \mu_{2012} < 0$
Sätt signifikansnivån $\alpha = 0{,}05$.
Data är parade, eftersom varje röstandel avser samma county.
Från två stickprov till ett
sample_data <- repub_votes_potus_08_12 %>%
  mutate(diff = repub_percent_08 - repub_percent_12)
ggplot(sample_data, aes(x = diff)) +
  geom_histogram(binwidth = 1)
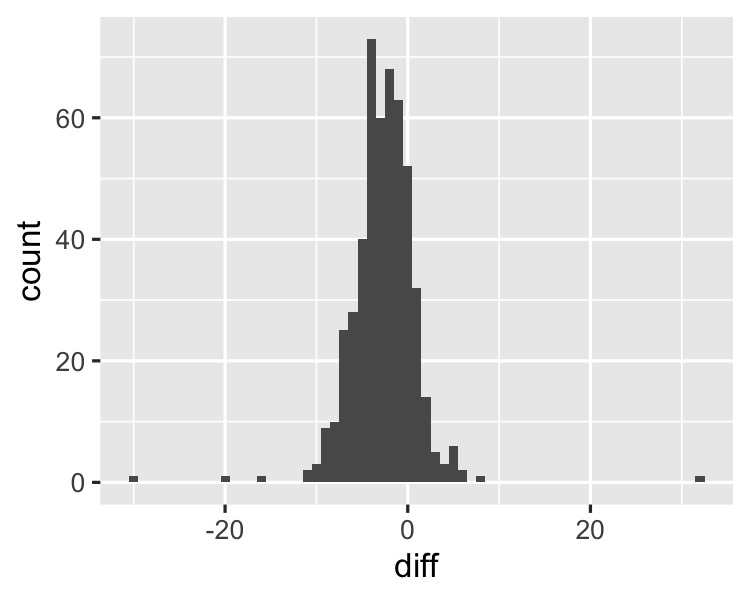
Beräkna stickprovsstatistik för differensen
sample_data %>%
  summarize(xbar_diff = mean(diff))
  xbar_diff
1 -2.643027
Reviderade hypoteser
Ursprungliga hypoteser
$H_{0}$: $\mu_{2008} - \mu_{2012} = 0$
$H_{A}$: $\mu_{2008} - \mu_{2012} < 0$
Reviderade hypoteser
$H_{0}$: $\mu_{\text{diff}} = 0$
$H_{A}$: $ \mu_{\text{diff}} < 0$
$t = \dfrac{\bar{x}_{\text{diff}} - \mu_{\text{diff}}}{\sqrt{\dfrac{s_{diff}^2}{n_{\text{diff}}}}}$
$df = n_{diff} - 1$
Beräkna p-värdet
n_diff <- nrow(sample_data)
s_diff <- sample_data %>%
  summarize(sd_diff = sd(diff)) %>%
  pull(sd_diff)
t_stat <- (xbar_diff - 0) / sqrt(s_diff ^ 2 / n_diff)
-16.06374
degrees_of_freedom <- n_diff - 1
499
$t = \dfrac{\bar{x}_{\text{diff}} - \mu_{\text{diff}}}{\sqrt{\dfrac{s_{\text{diff}}^2}{n_{\text{diff}}}}}$
$df = n_{\text{diff}} - 1$
p_value <- pt(t_stat, df = degrees_of_freedom)
2.084965e-47
Testa skillnader mellan två medelvärden med t.test()
t.test(# Vector of differences sample_data$diff,# Choose between "two.sided", "less", "greater" alternative = "less",# Null hypothesis population parameter mu = 0)
    One Sample t-test

data:  sample_data$diff
t = -16.064, df = 499, p-value < 2.2e-16
alternative hypothesis: true mean is less than 0
95 percent confidence interval:
     -Inf -2.37189
sample estimates:
mean of x
-2.643027
t.test() med paired = TRUE
t.test(
  sample_data$repub_percent_08,
  sample_data$repub_percent_12,
  alternative = "less",
  mu = 0,
  paired = TRUE
)
    Paired t-test

data:  sample_data$repub_percent_08 and
       sample_data$repub_percent_12
t = -16.064, df = 499, p-value < 2.2e-16
alternative hypothesis: true difference in means
                        is less than 0
95 percent confidence interval:
     -Inf -2.37189
sample estimates:
mean of the differences
              -2.643027
Oparad t.test()
t.test(
  x = sample_data$repub_percent_08,
  y = sample_data$repub_percent_12,
  alternative = "less",
  mu = 0
)
Oparad t-test har större risk för falskt negativt fel (lägre statistisk styrka).
    Welch Two Sample t-test

data:  sample_data$repub_percent_08 and
       sample_data$repub_percent_12
t = -2.8788, df = 992.76, p-value = 0.002039
alternative hypothesis: true difference in means
                        is less than 0
95 percent confidence interval:
      -Inf -1.131469
sample estimates:
mean of x mean of y
 56.52034  59.16337
Nu kör vi en övning!
Hypotestestning i R

