Introduktion till arrayer

Introduktion till NumPy

Izzy Weber

Core Curriculum Manager, DataCamp

NumPy och Python-ekosystemet

En grafik av Atlas som håller upp jordgloben, stylad som NumPy eftersom NumPy bär upp Python-världen

Introduktion till NumPy

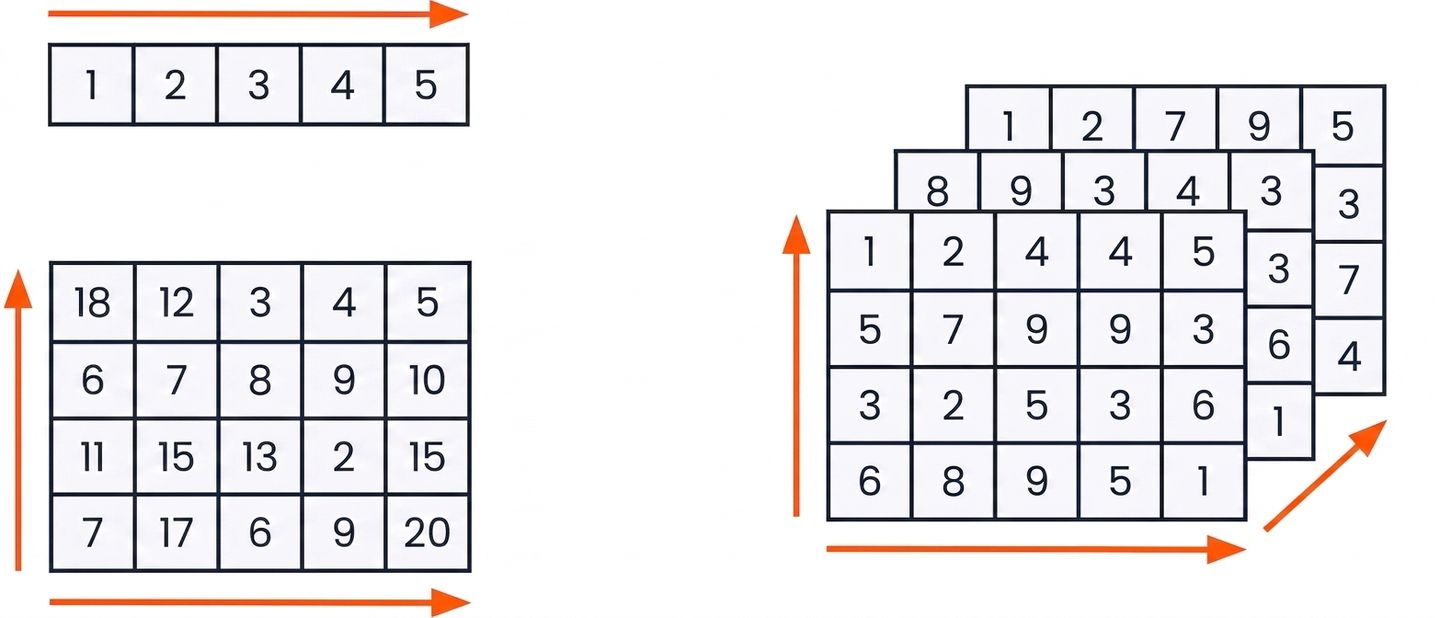
NumPy-arrayer


Grafik av 1D-, 2D- och 3D-arrayer

Introduktion till NumPy

Importera NumPy


import numpy as np
Introduktion till NumPy

Skapa 1D-arrayer från listor

python_list = [3, 2, 5, 8, 4, 9, 7, 6, 1]
array = np.array(python_list)
array
array([3, 2, 5, 8, 4, 9, 7, 6, 1])


type(array)
numpy.ndarray
Introduktion till NumPy

Skapa 2D-arrayer från listor

python_list_of_lists = [[3, 2, 5],
                        [9, 7, 1],
                        [4, 3, 6]]
np.array(python_list_of_lists)
array([[3, 2, 5],
       [9, 7, 1],
       [4, 3, 6]])
Introduktion till NumPy

Python-listor

  • Kan innehålla många olika datatyper
python_list = ["beep", False, 56, .945, [3, 2, 5]]


NumPy-arrayer

  • Kan bara innehålla en enda datatyp
  • Tar mindre plats i minnet
numpy_boolean_array = [[True, False], [True, True], [False, True]]

numpy_float_array = [1.9, 5.4, 8.8, 3.6, 3.2]
Introduktion till NumPy

Skapa arrayer från grunden


Det finns många NumPy-funktioner för att skapa arrayer från grunden, till exempel:

  • np.zeros()
  • np.random.random()
  • np.arange()
Introduktion till NumPy

Skapa arrayer: np.zeros()

np.zeros((5, 3))
array([[0., 0., 0.],
       [0., 0., 0.],
       [0., 0., 0.],
       [0., 0., 0.],
       [0., 0., 0.]])
Introduktion till NumPy

Skapa arrayer: np.random.random()

np.random.random((2, 4))
array([[0.88524516, 0.85641352, 0.33463107, 0.53337117],
       [0.69933362, 0.09295327, 0.93616428, 0.03601592]])
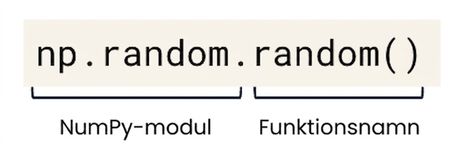
 

np.random är en NumPy-modul medan np.random.random() är en funktion inom np.random

Introduktion till NumPy

Skapa arrayer med np.arange()

np.arange(-3, 4)
array([-3, -2, -1,  0,  1,  2,  3])
np.arange(4)
array([0, 1, 2, 3])
np.arange(-3, 4, 3)
array([-3,  0,  3])
from matplotlib import pyplot as plt
plt.scatter(np.arange(0, 7),
            np.arange(-3, 4))
plt.show()
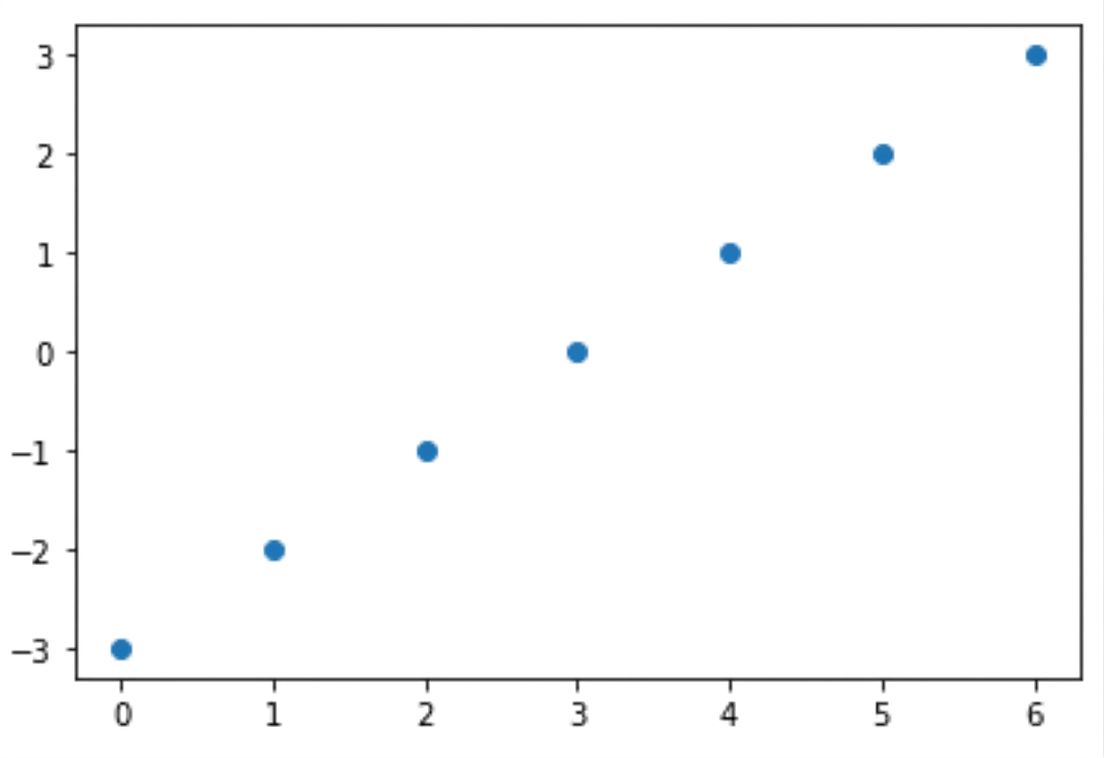
Ett diagram med två range-arrayer längs X- och Y-axeln

Introduktion till NumPy

Nu kör vi en övning!

Introduktion till NumPy

Preparing Video For Download...