Введение в Python для финансов
Adina Howe
Professor
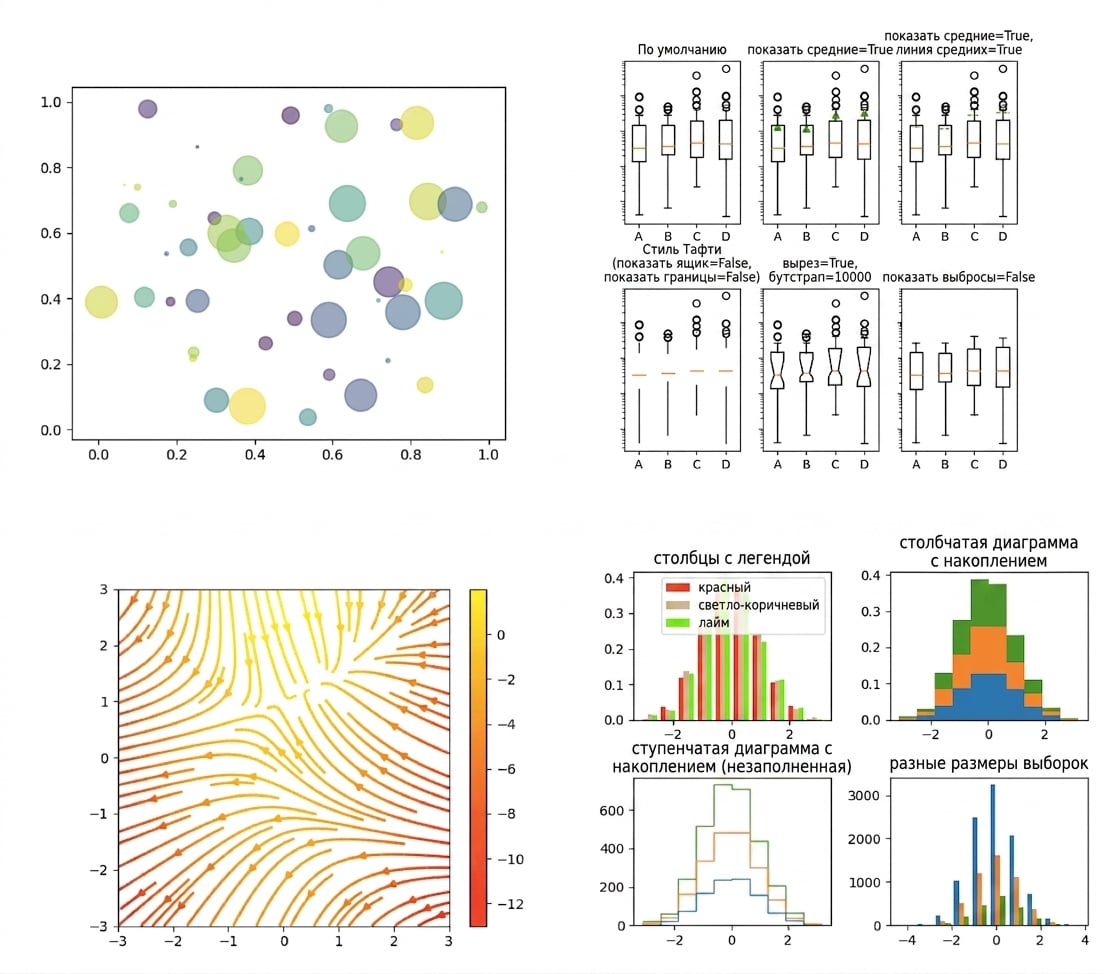
Больше примеров из галереи Matplotlib можно найти по этой ссылке.
import matplotlib.pyplot as plt
plt.plot()
plt.show()
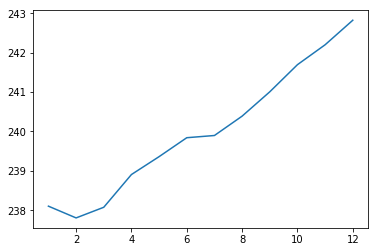
import matplotlib.pyplot as plt
plt.plot(months, prices)
plt.show()

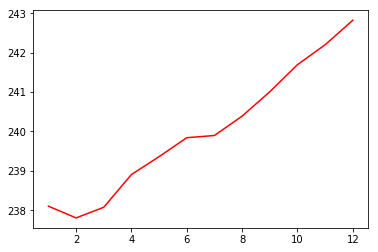
import matplotlib.pyplot as plt
plt.plot(months, prices, color = 'red')
plt.show()

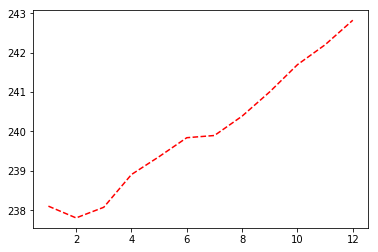
import matplotlib.pyplot as plt
plt.plot(months, prices, color = 'red', linestyle = '--')
plt.show()

| color | |
|---|---|
| 'green' | зелёный |
| 'red' | красный |
| 'cyan' | голубой |
| 'blue' | синий |
| linestyle | |
|---|---|
| '-' | сплошная линия |
| '--' | пунктирная линия |
| '-.' | штрихпунктирная линия |
| ':' | точечная |
Подробная документация по цветам и стилям линий доступна здесь.
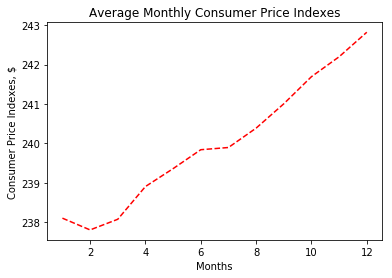
import matplotlib.pyplot as plt
plt.plot(months, prices, color = 'red', linestyle = '--')
# Add labels
plt.xlabel('Months')
plt.ylabel('Consumer Price Indexes, $')
plt.title('Average Monthly Consumer Price Indexes')
# Show plot
plt.show()

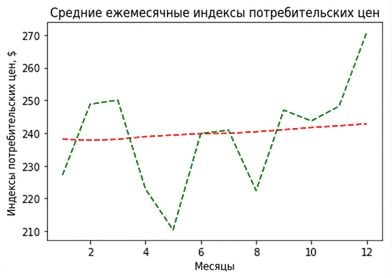
import matplotlib.pyplot as plt
plt.plot(months, prices, color = 'red', linestyle = '--')
# adding an additional line
plt.plot(months, prices_new, color = 'green', linestyle = '--')
plt.xlabel('Months')
plt.ylabel('Consumer Price Indexes, $')
plt.title('Average Monthly Consumer Price Indexes')
plt.show()

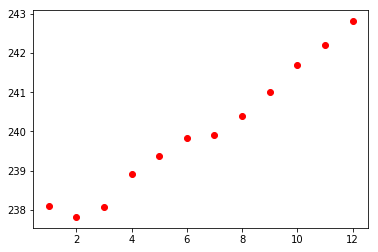
import matplotlib.pyplot as plt
plt.scatter(x = months, y = prices, color = 'red')
plt.show()

Введение в Python для финансов