Goodness of fit
Inference for Categorical Data in R

Andrew Bray
Assistant Professor of Statistics at Reed College
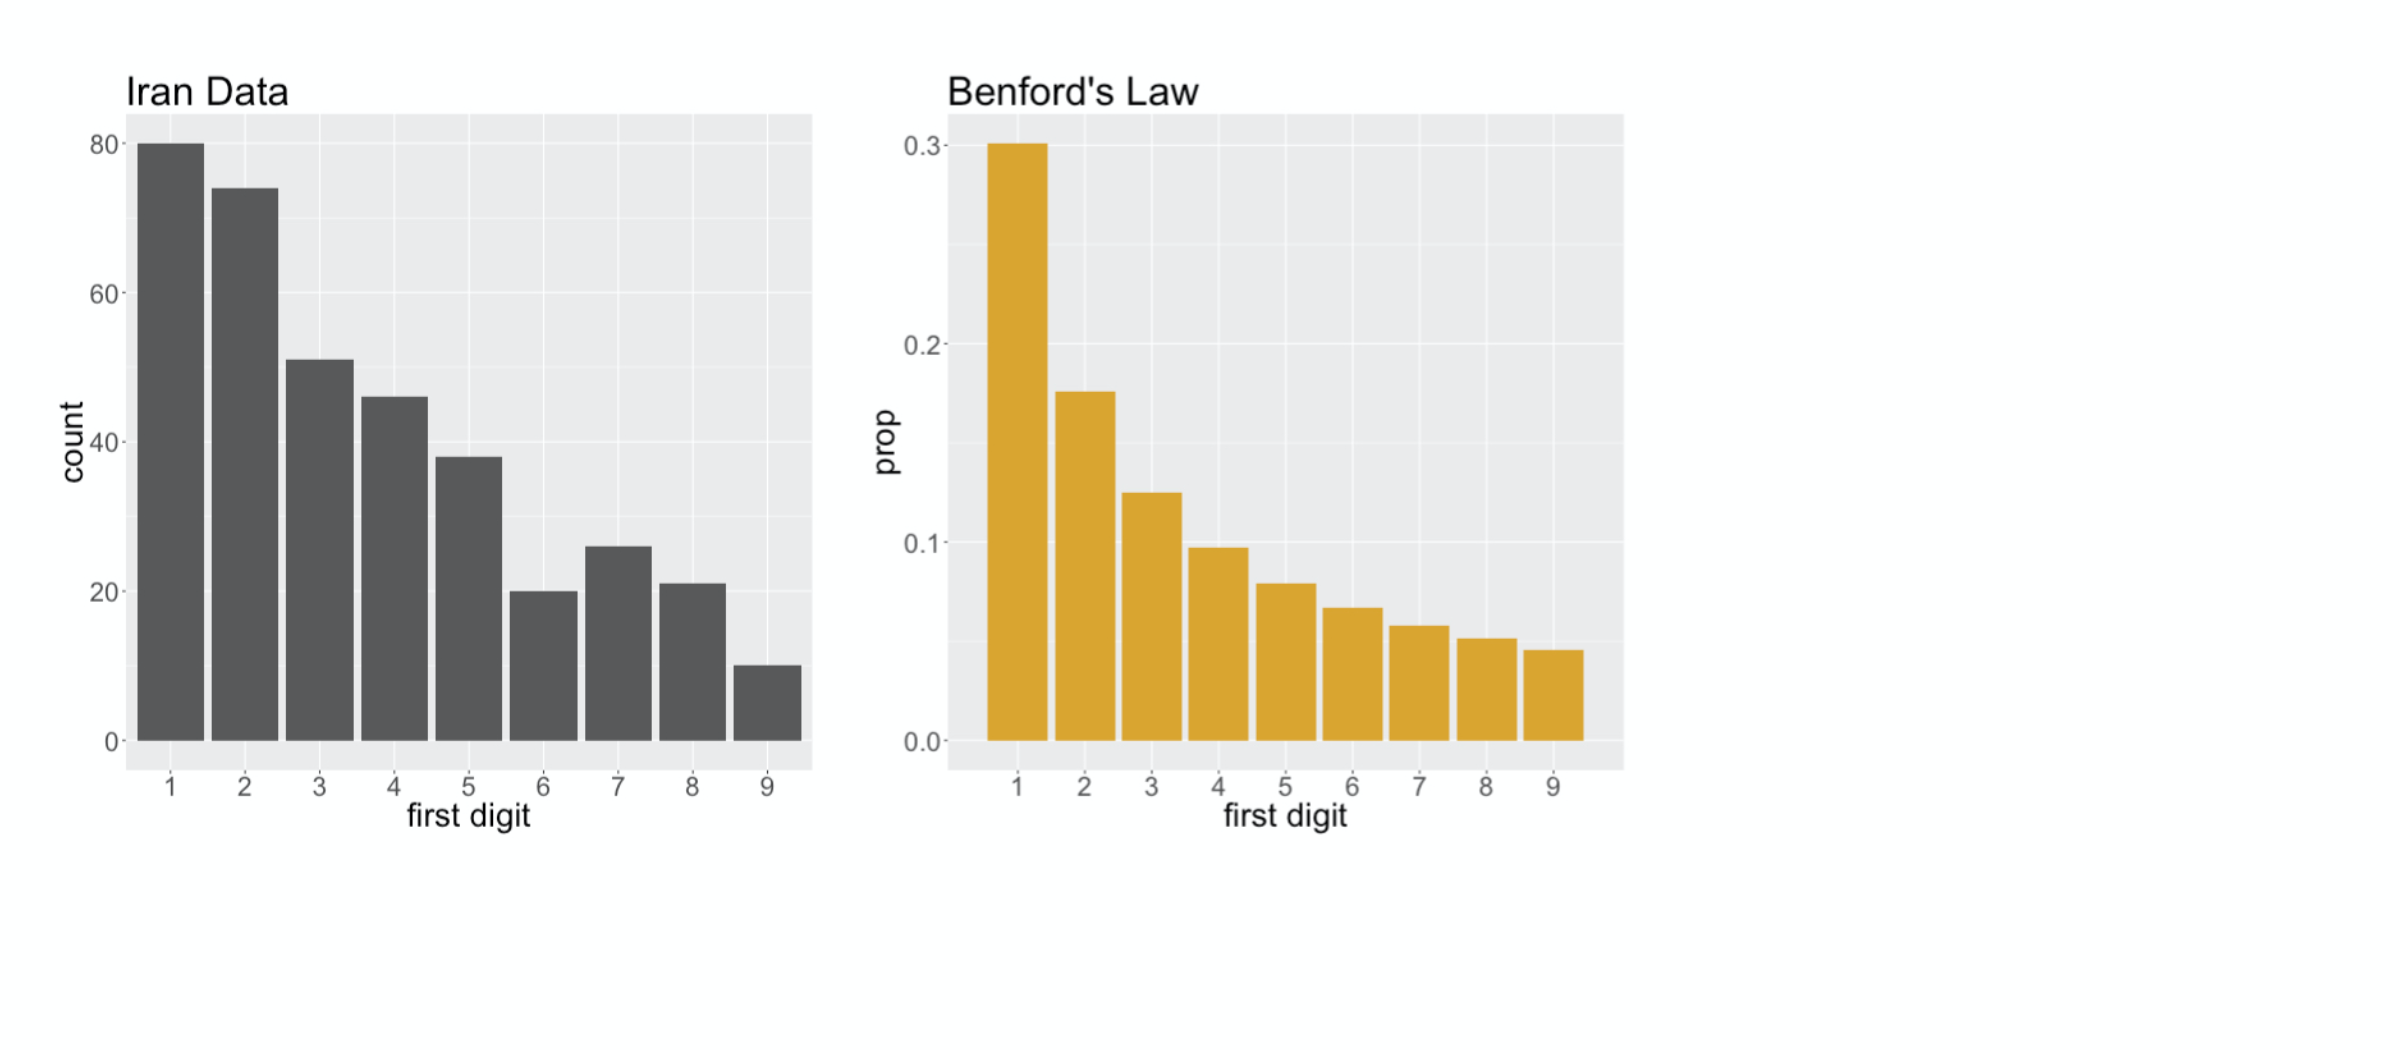
First Digit Distribution
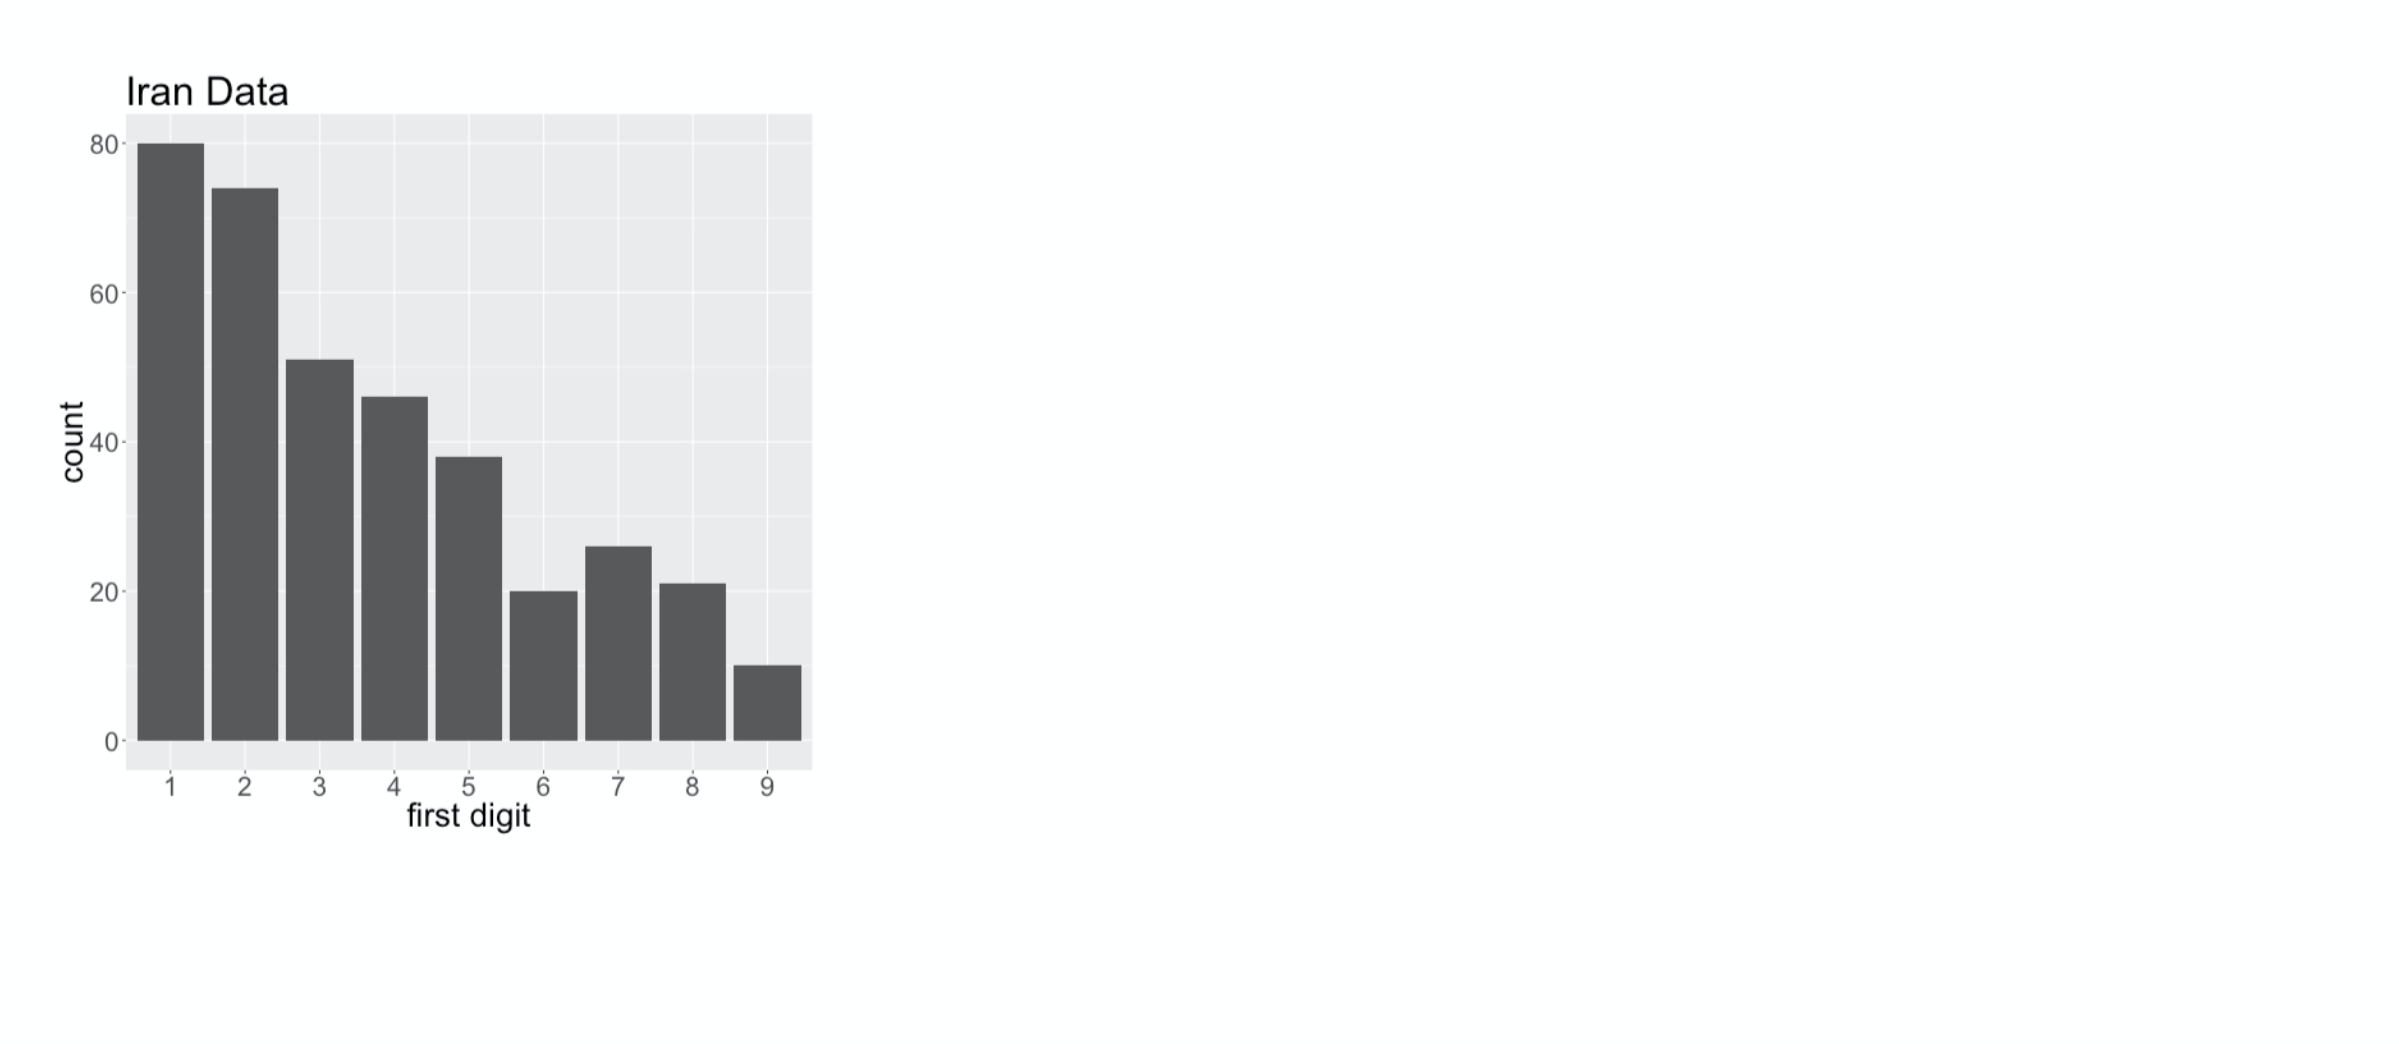
First Digit Distribution

First Digit Distribution

First Digit Distribution

First Digit Distribution
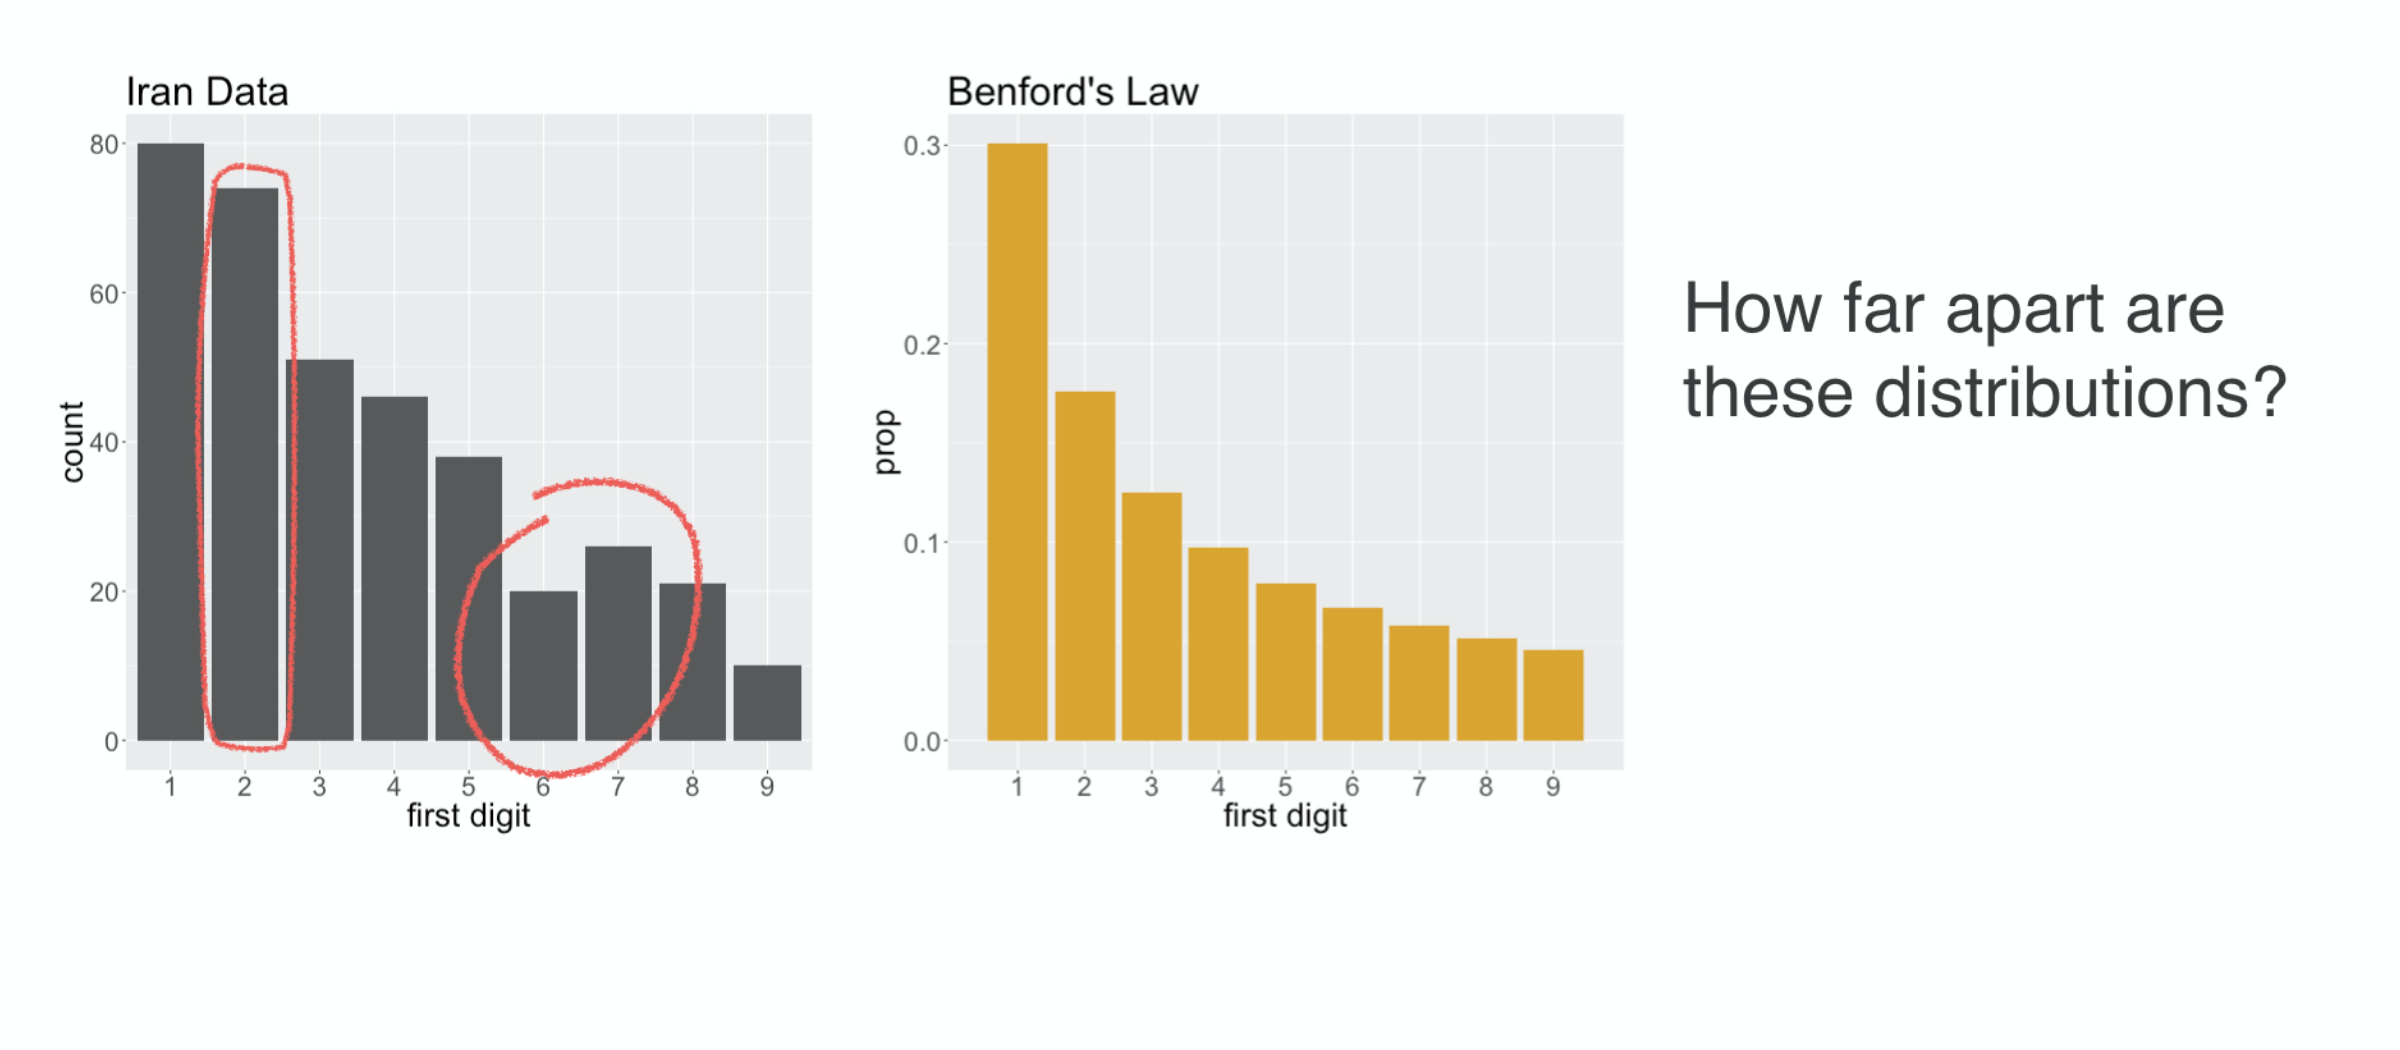
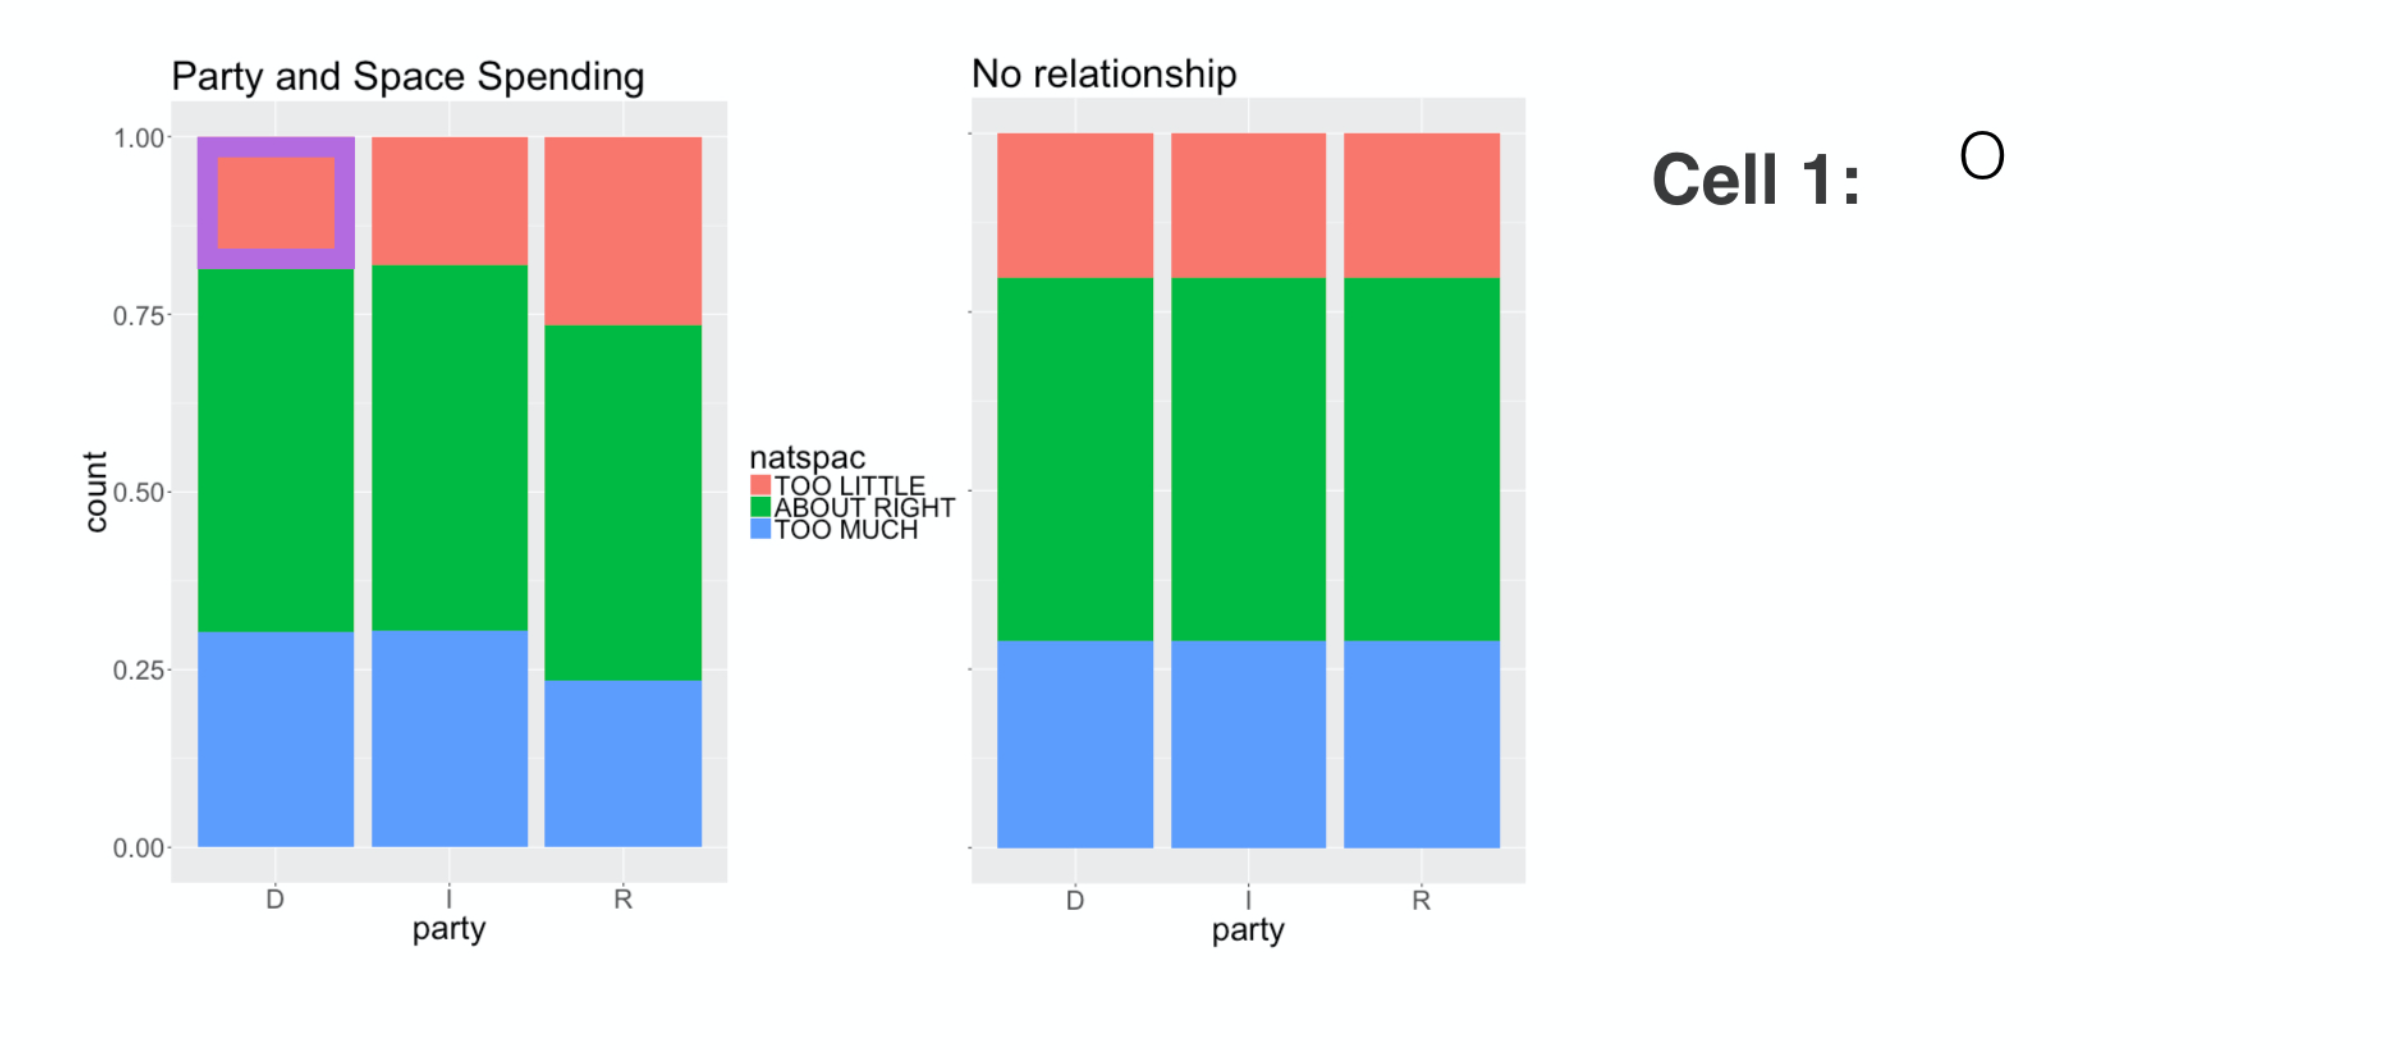
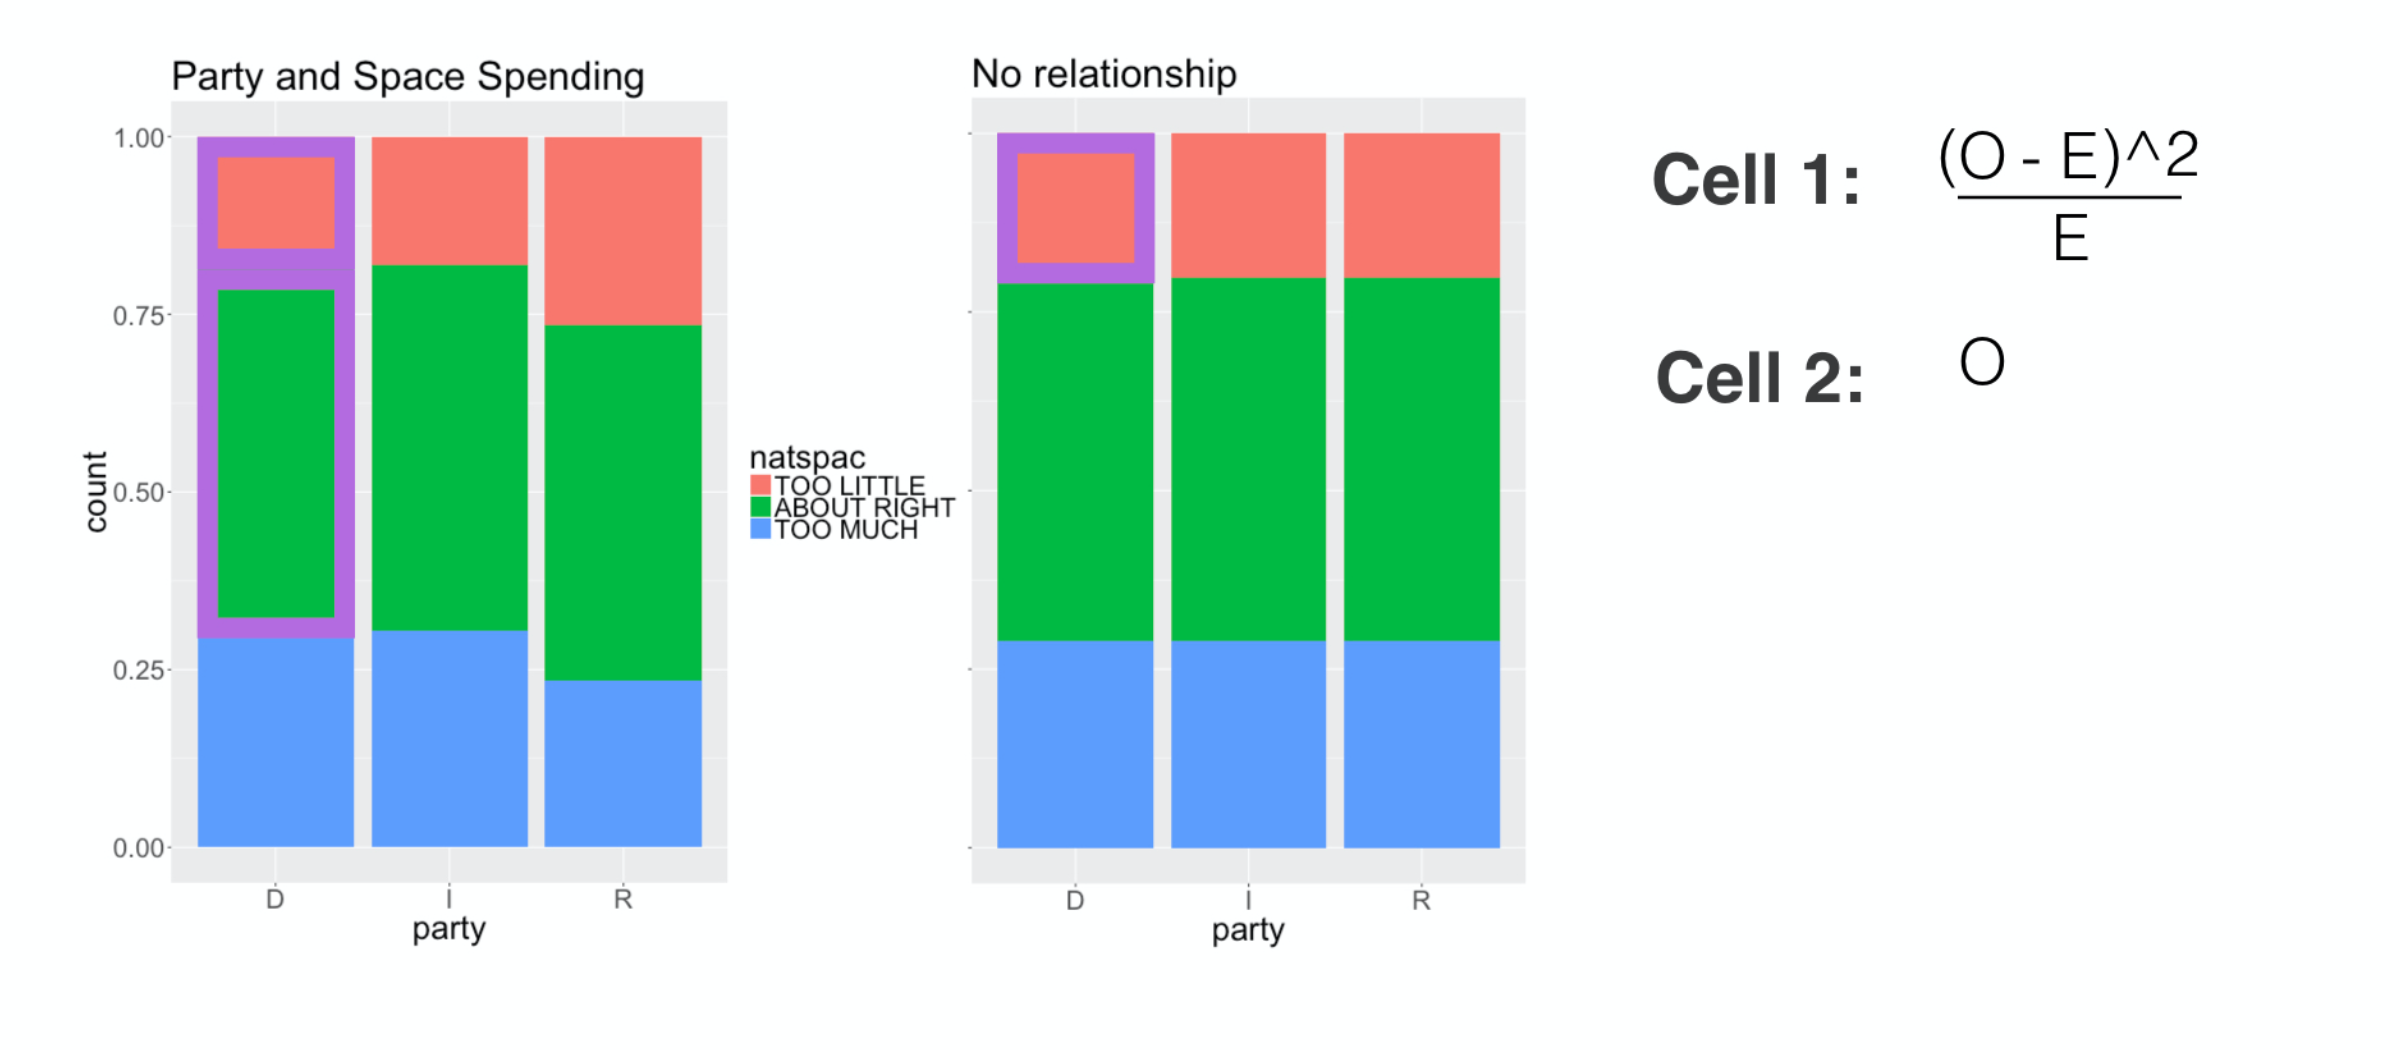
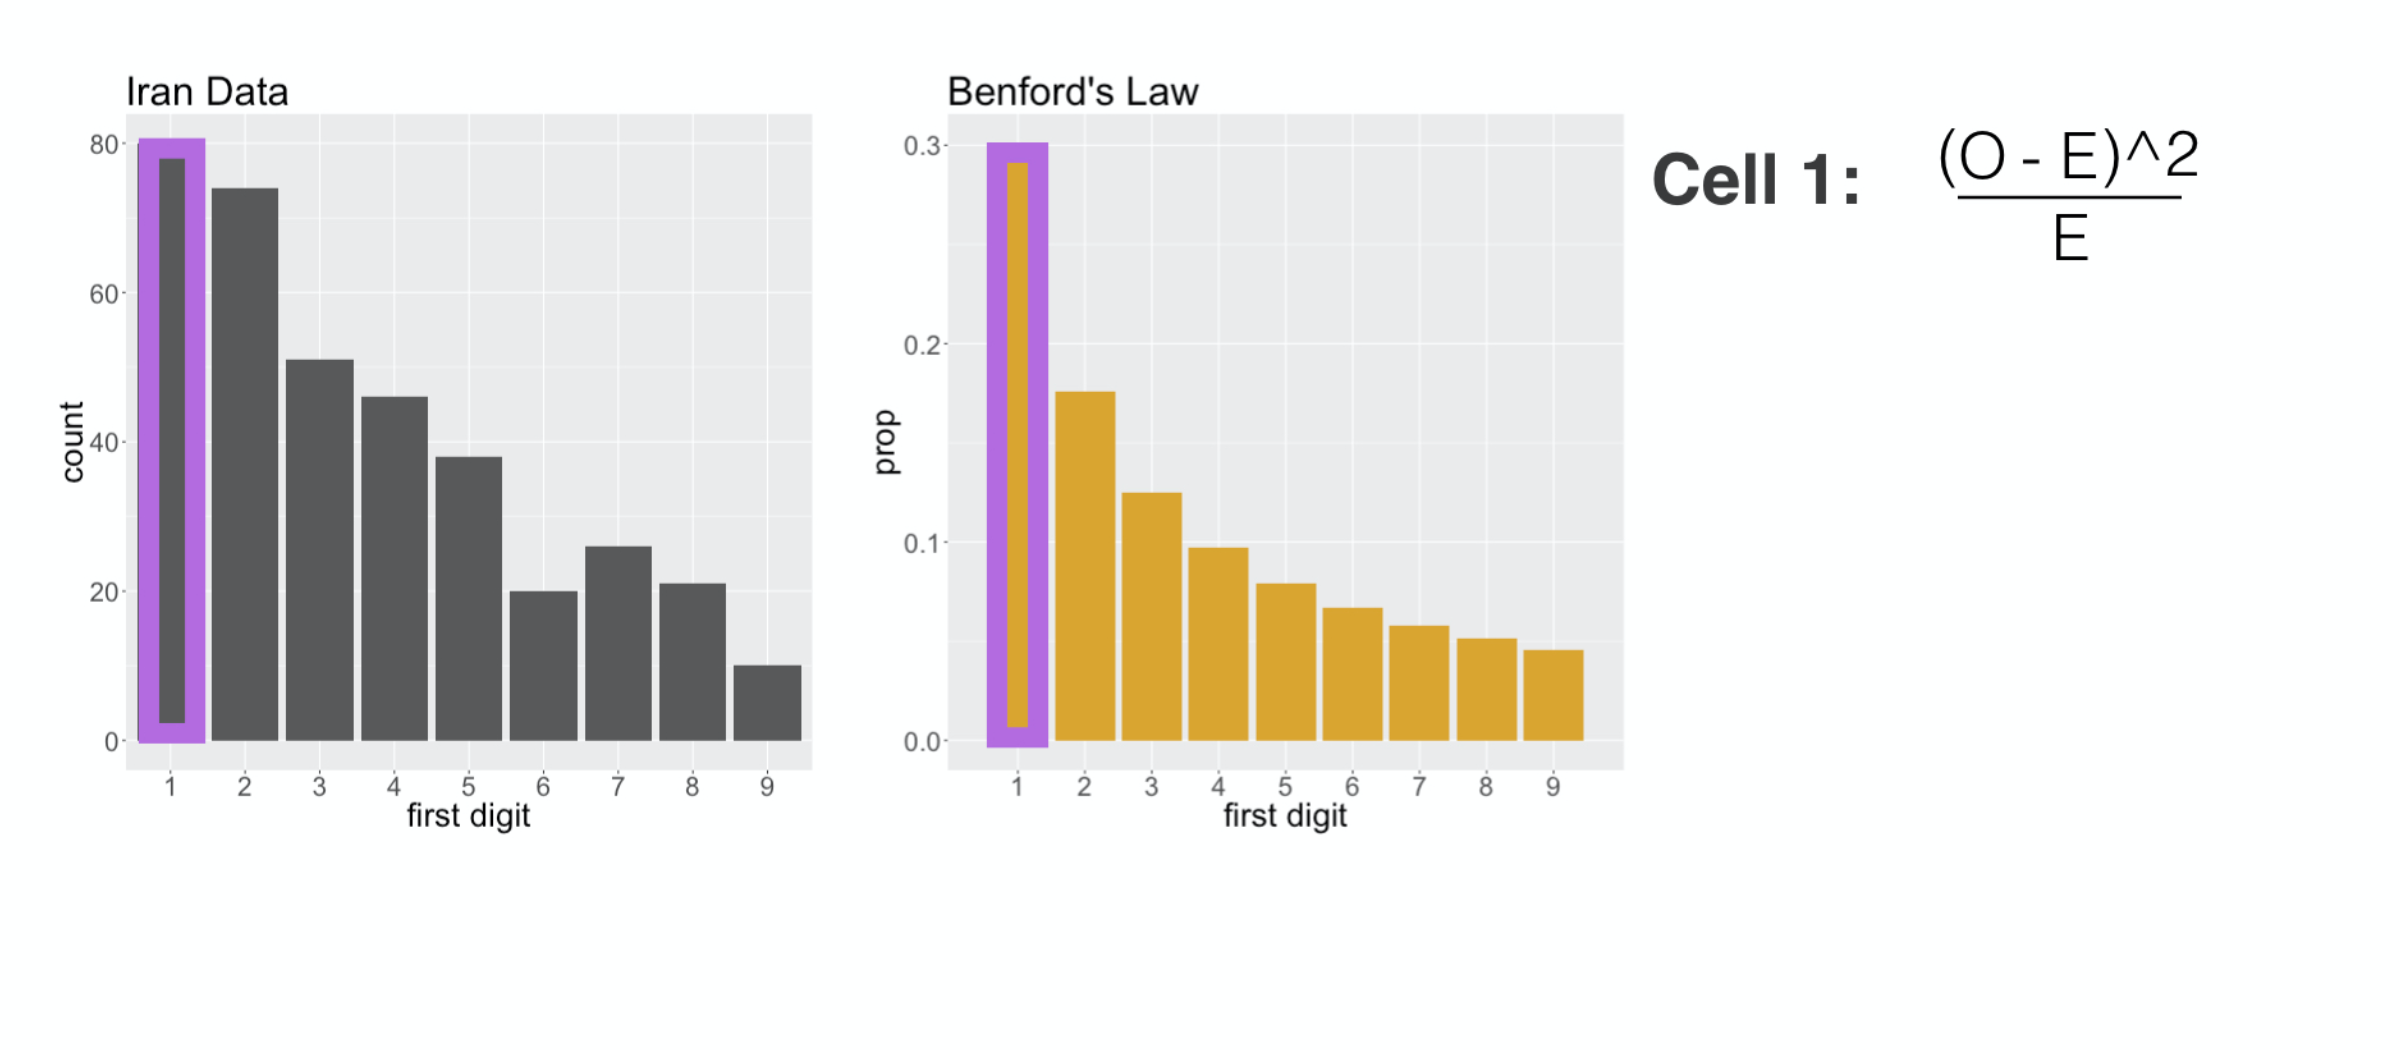
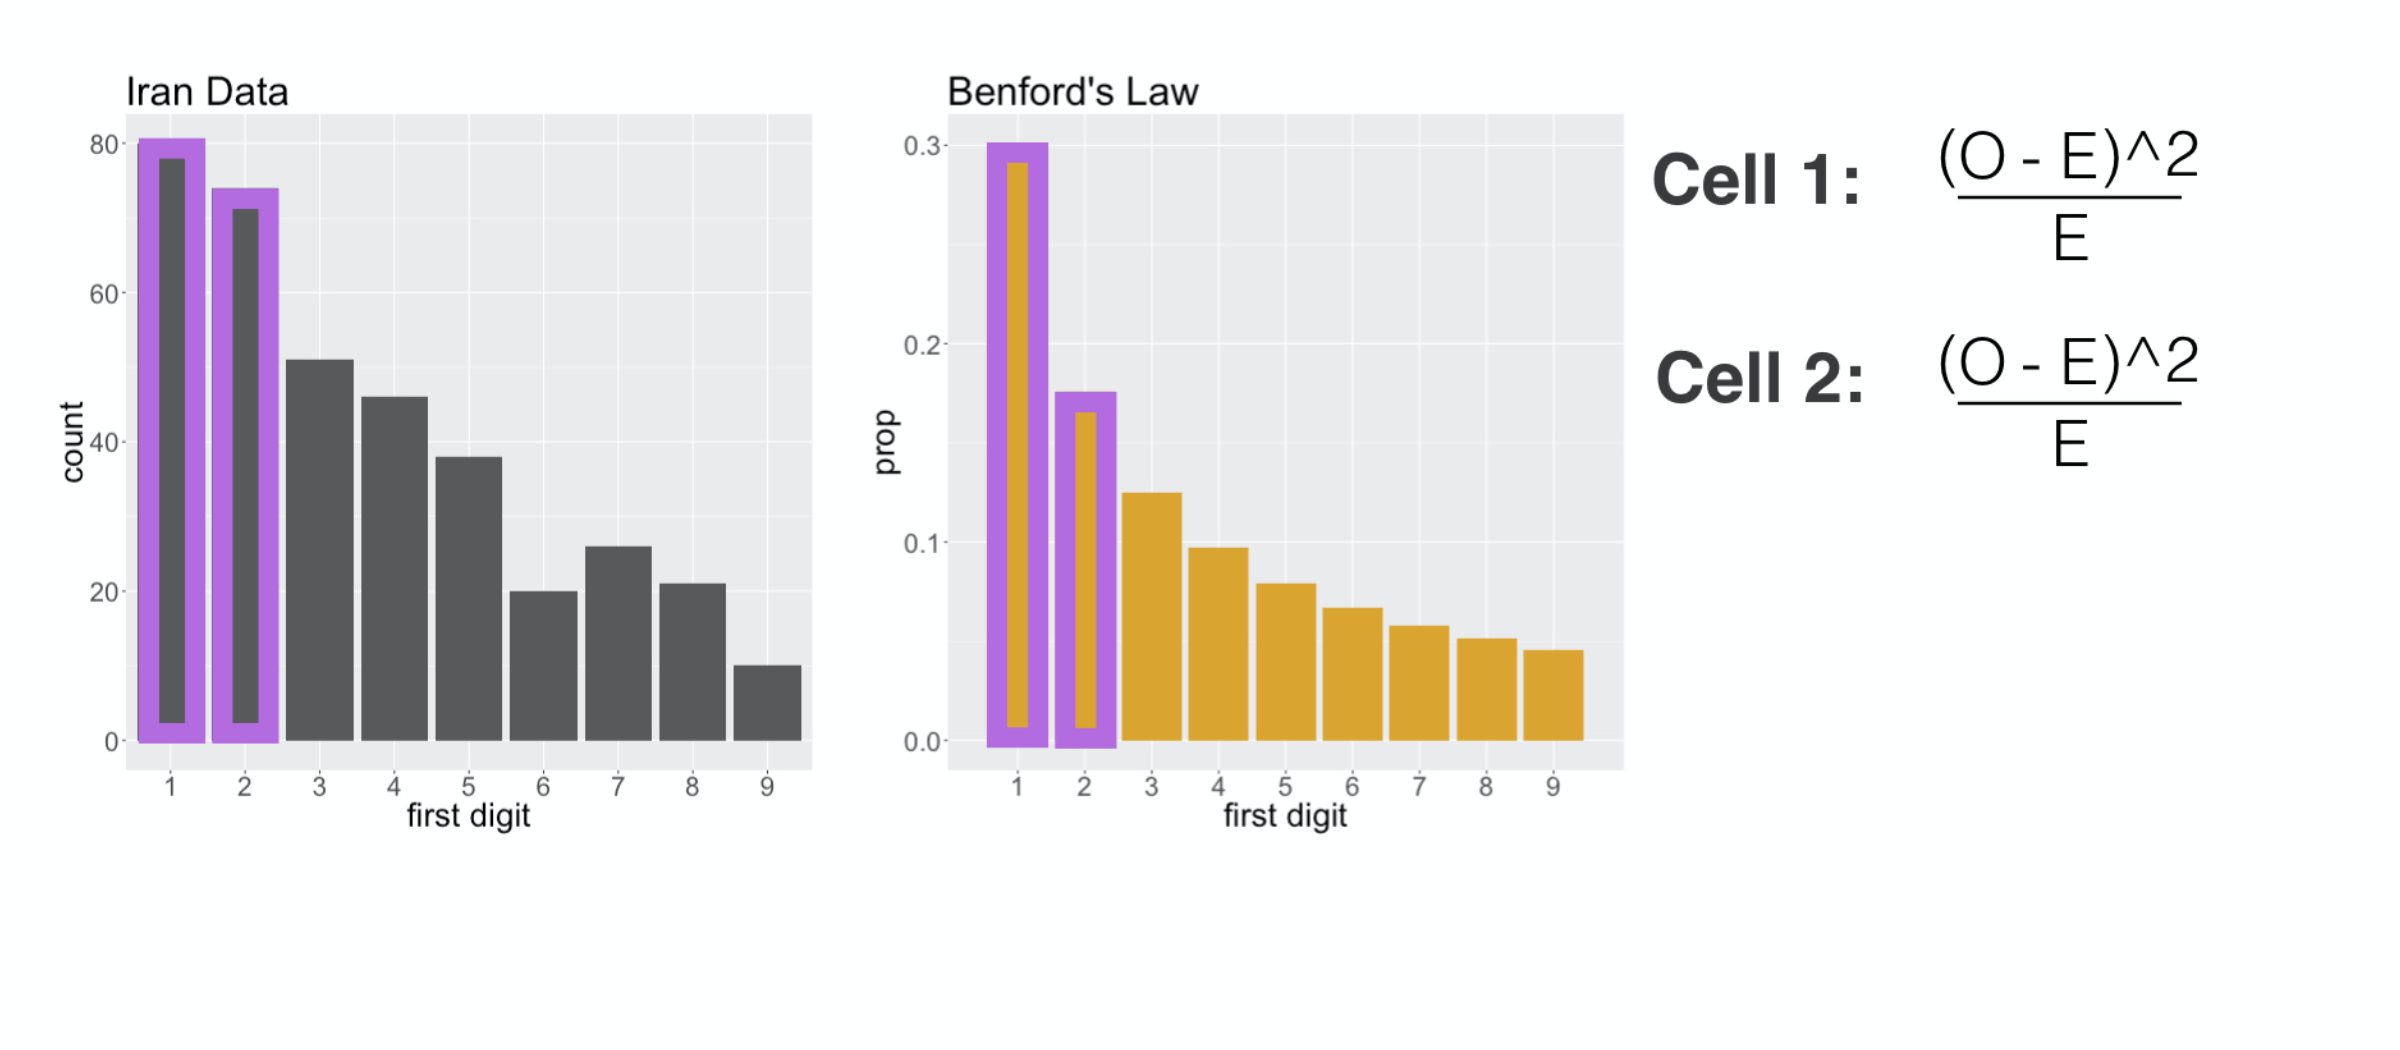
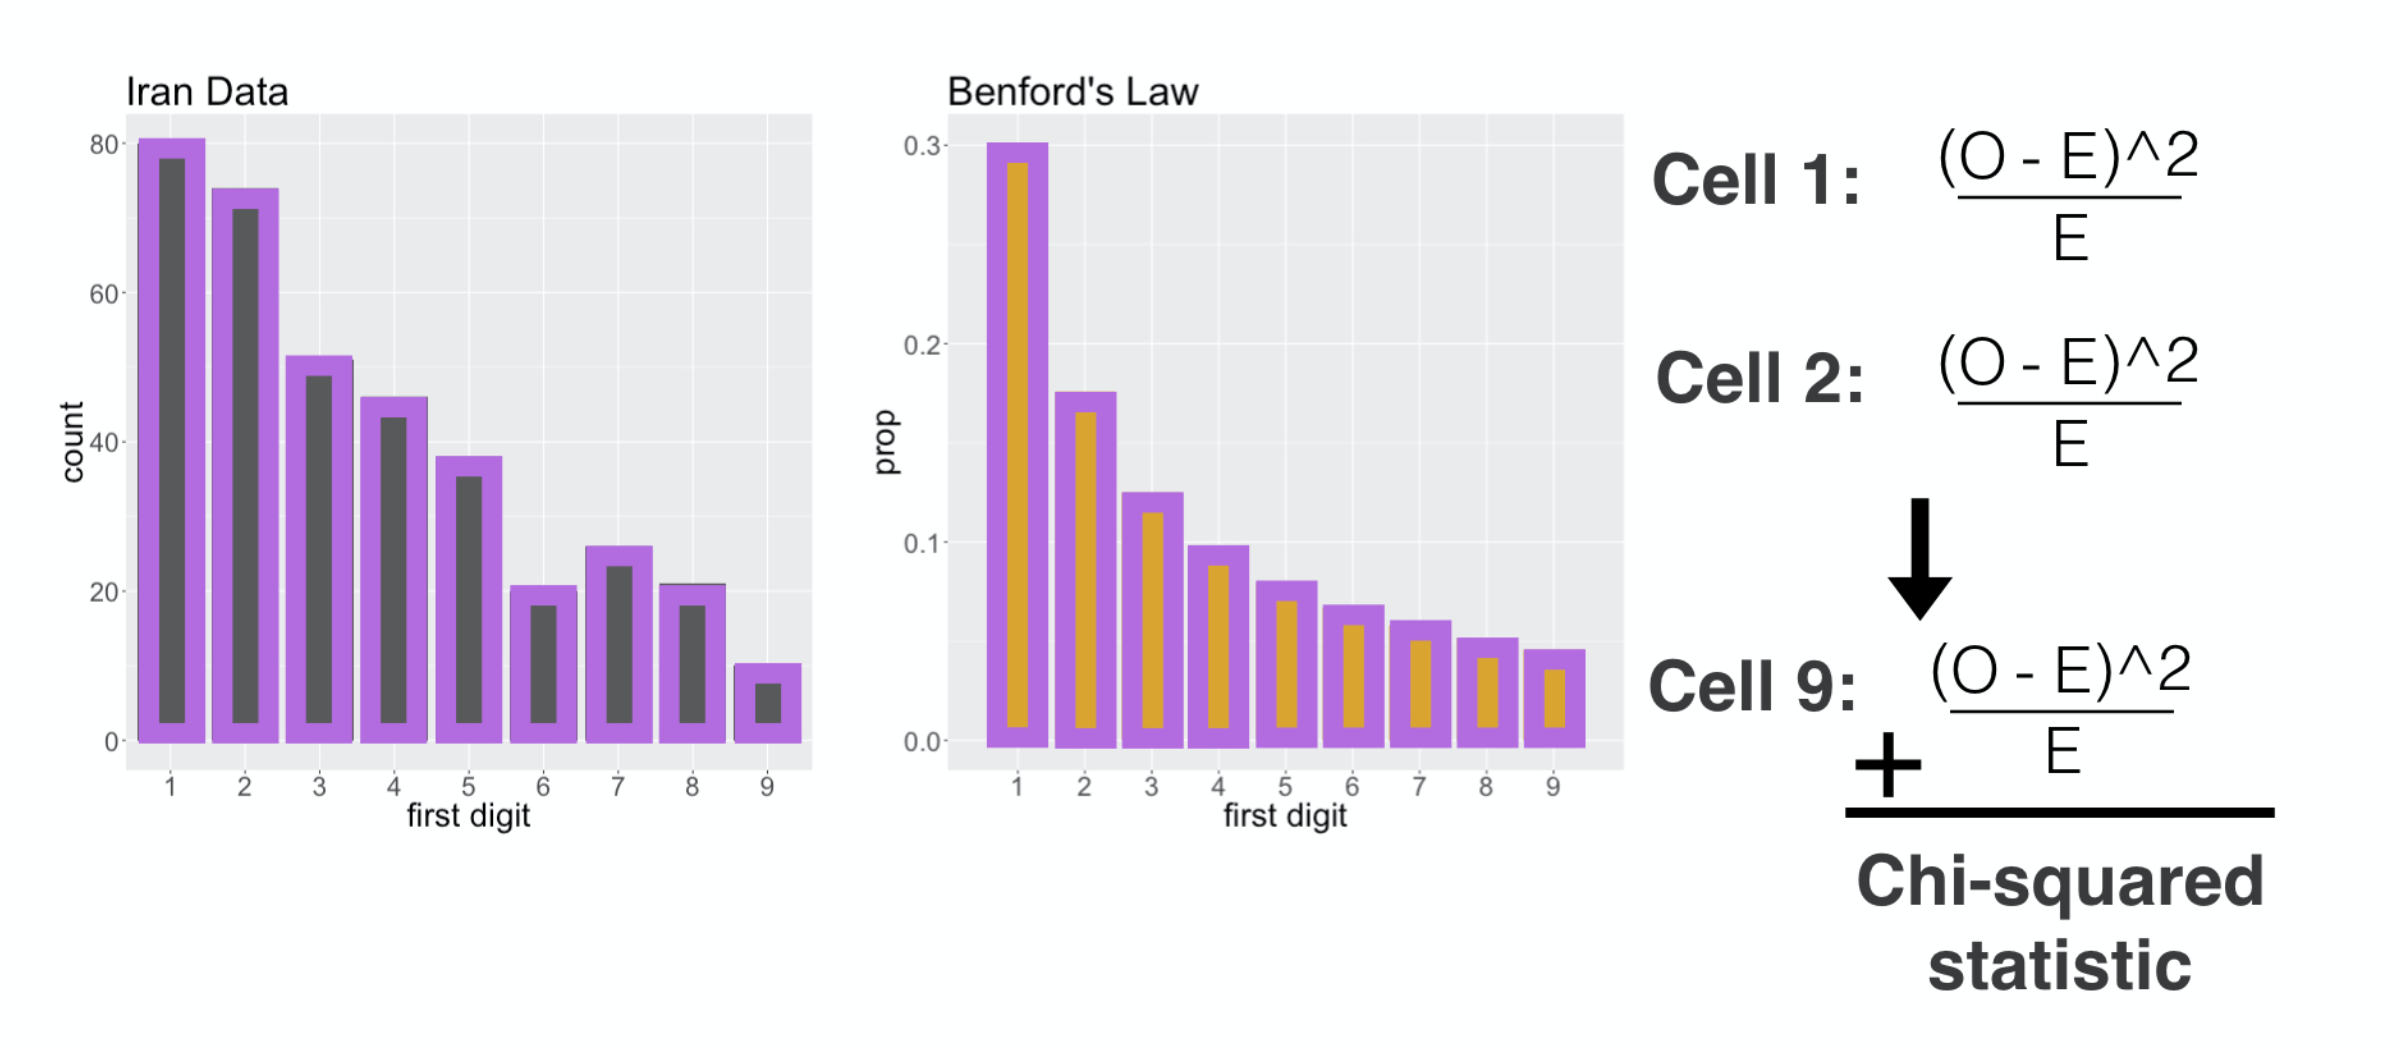
Chi-squared distance
Chi-squared distance

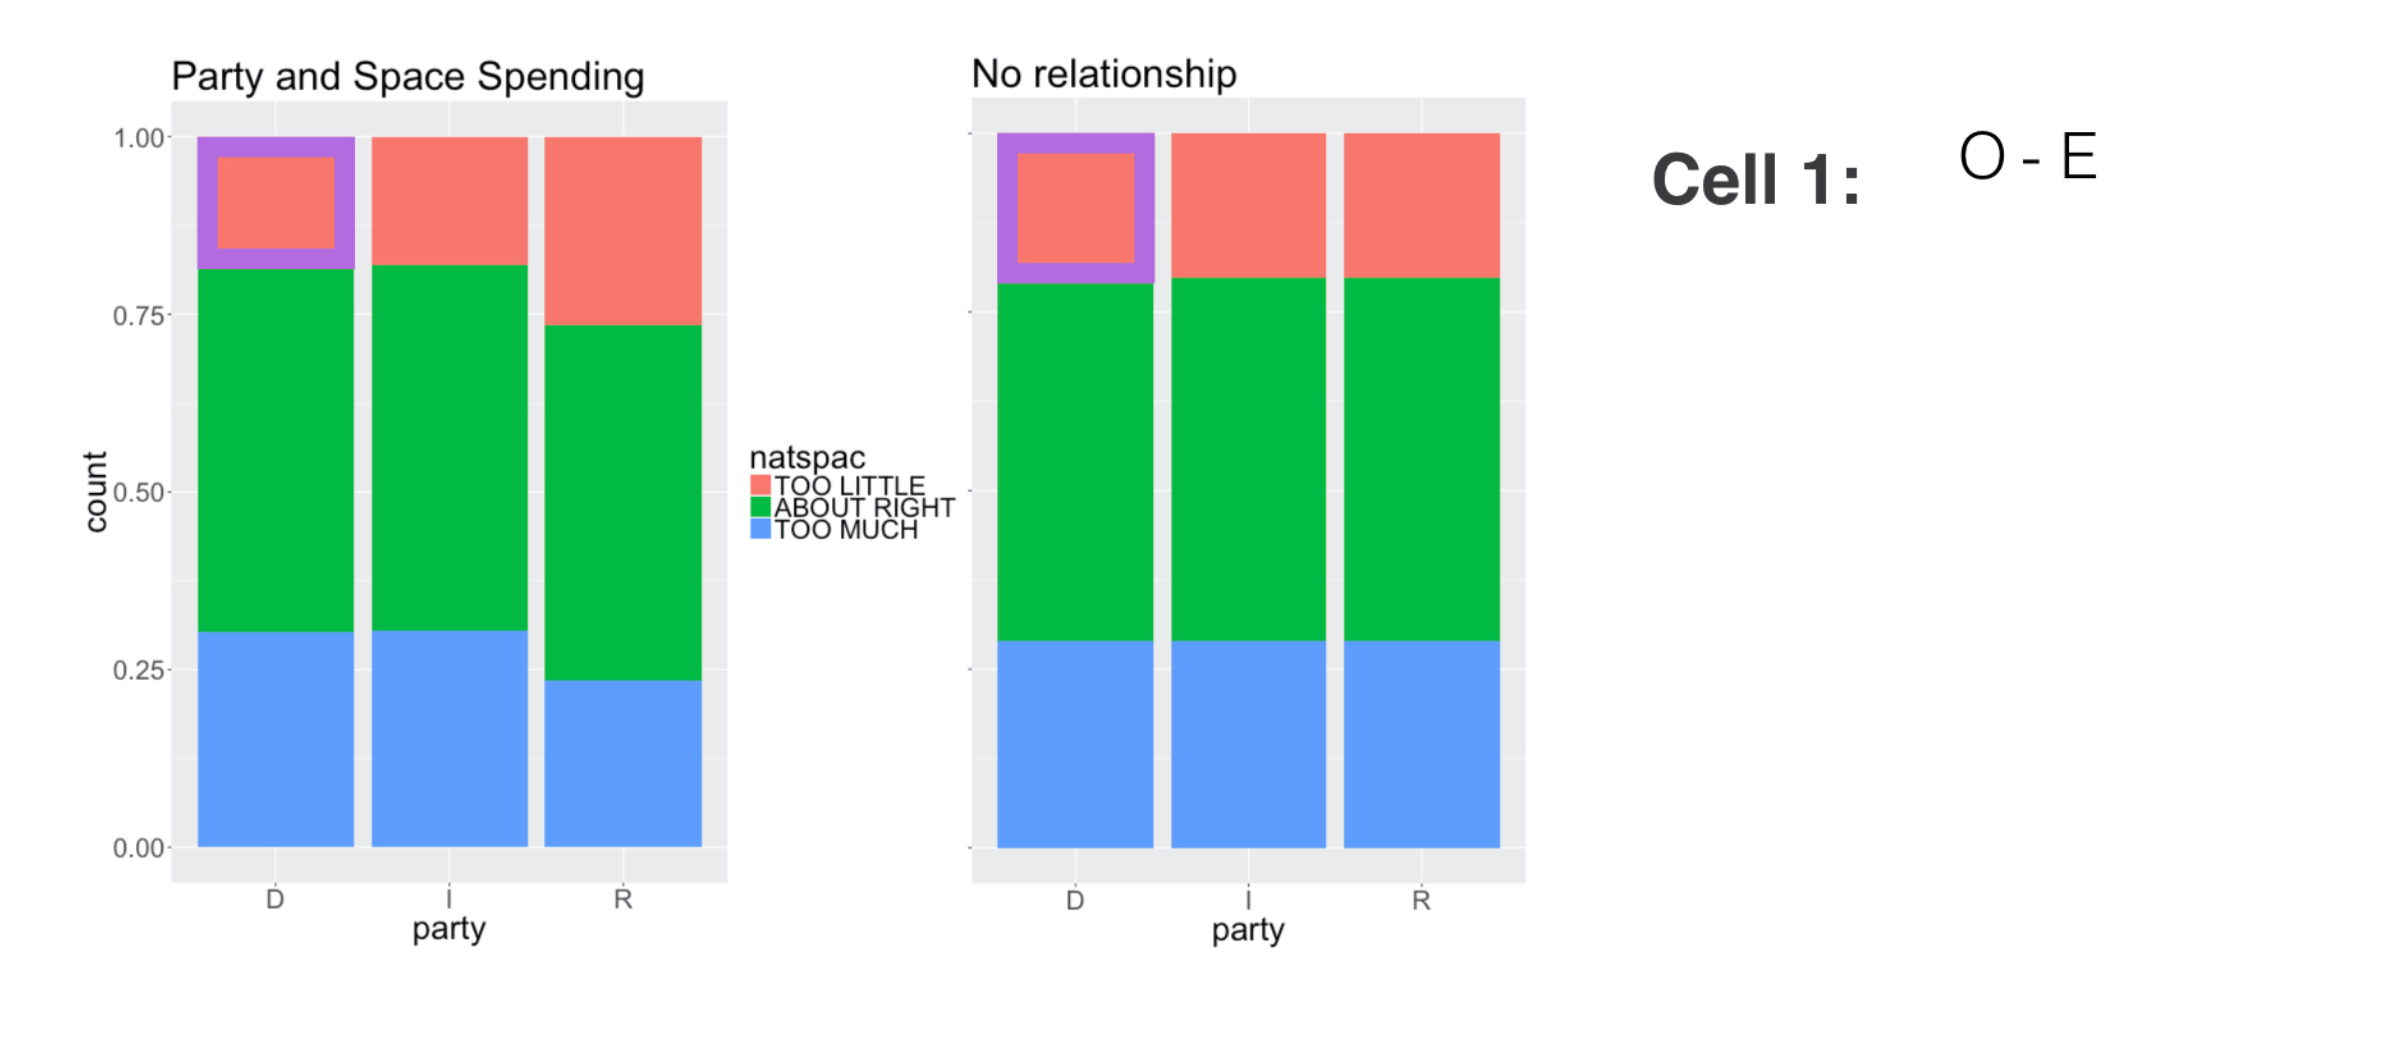
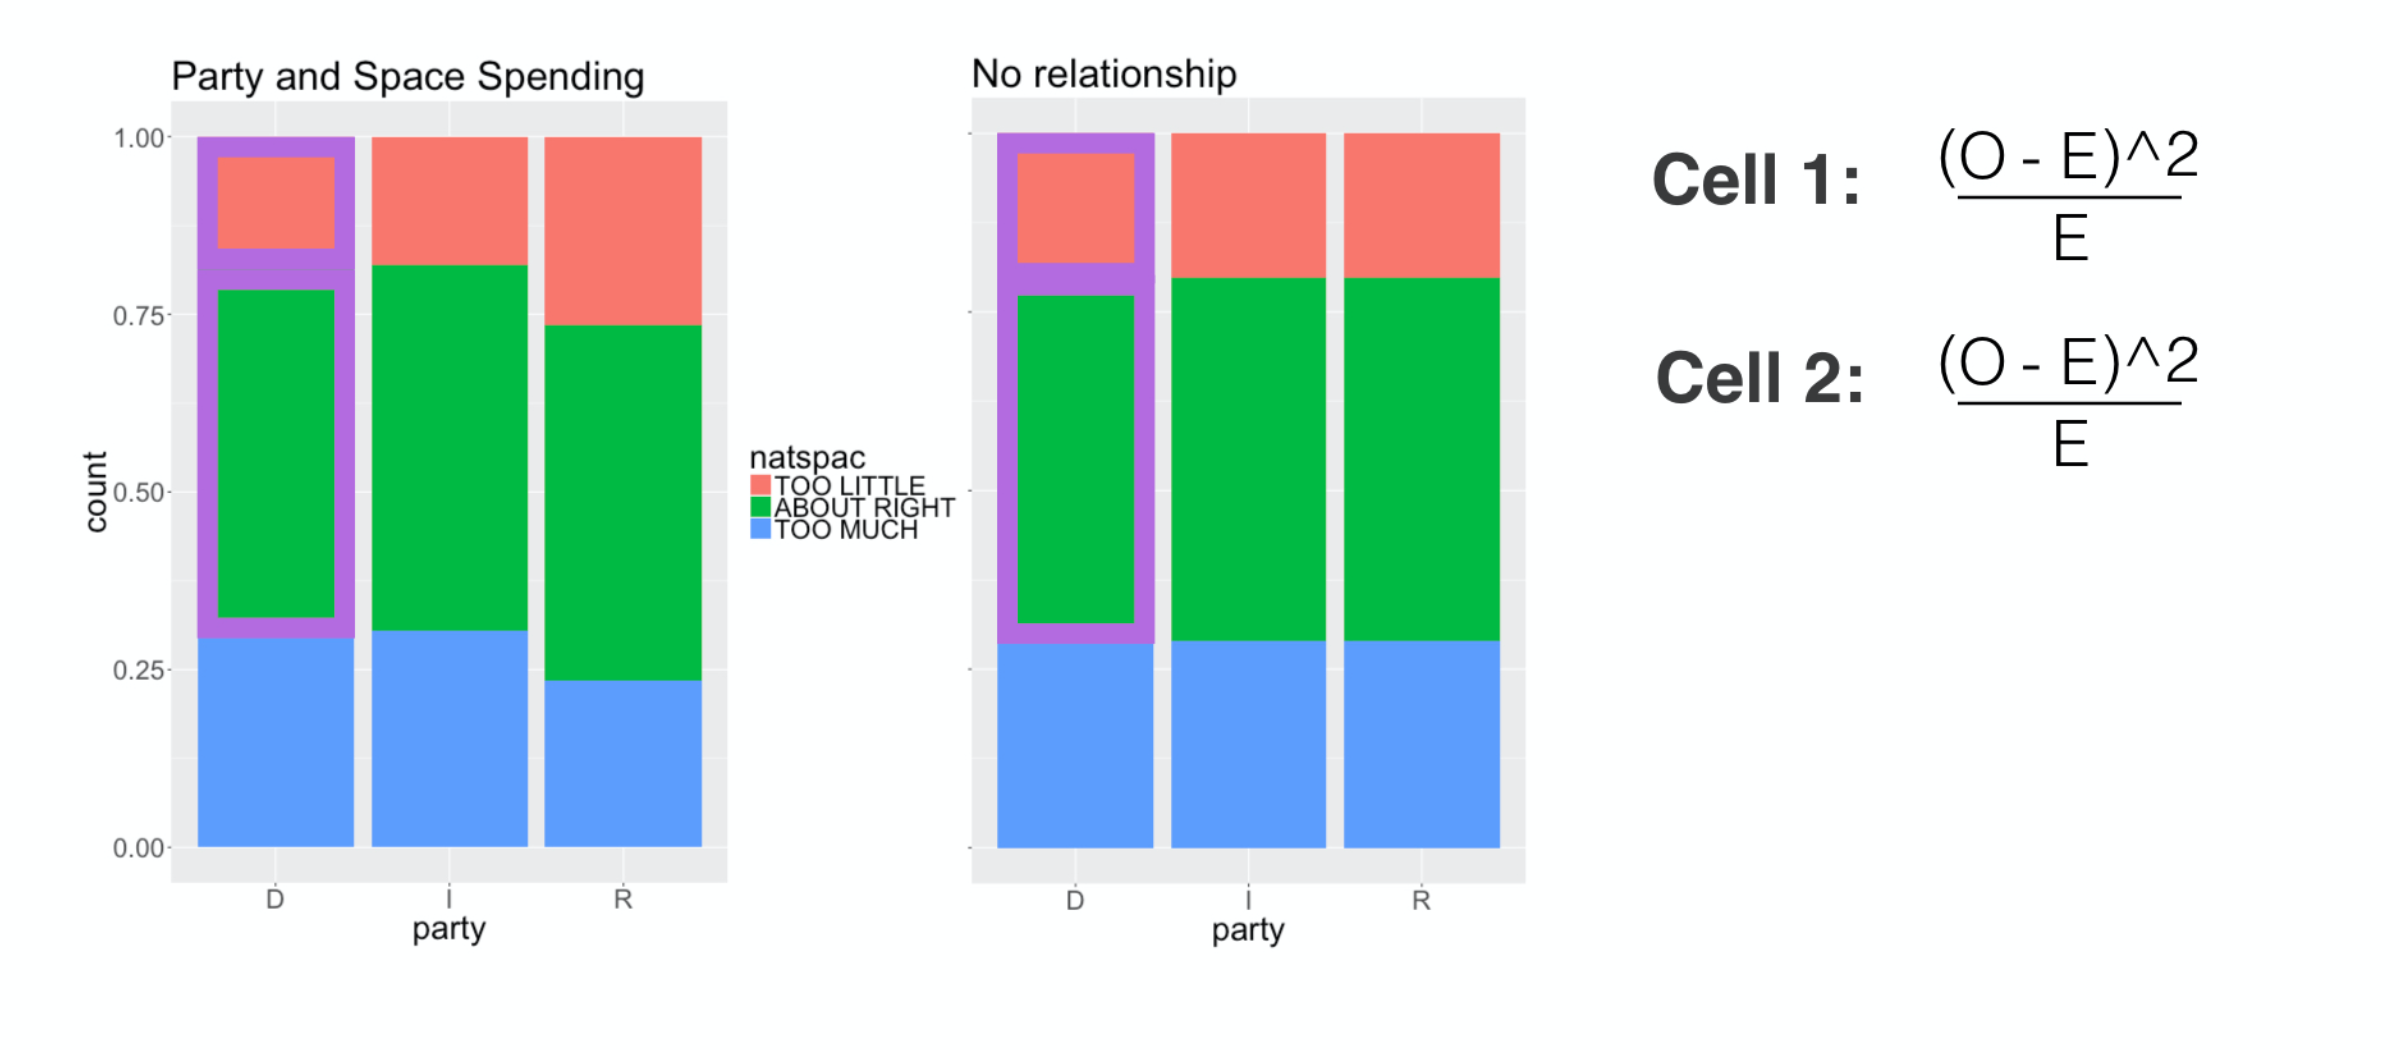
Chi-squared distance
Chi-squared distance
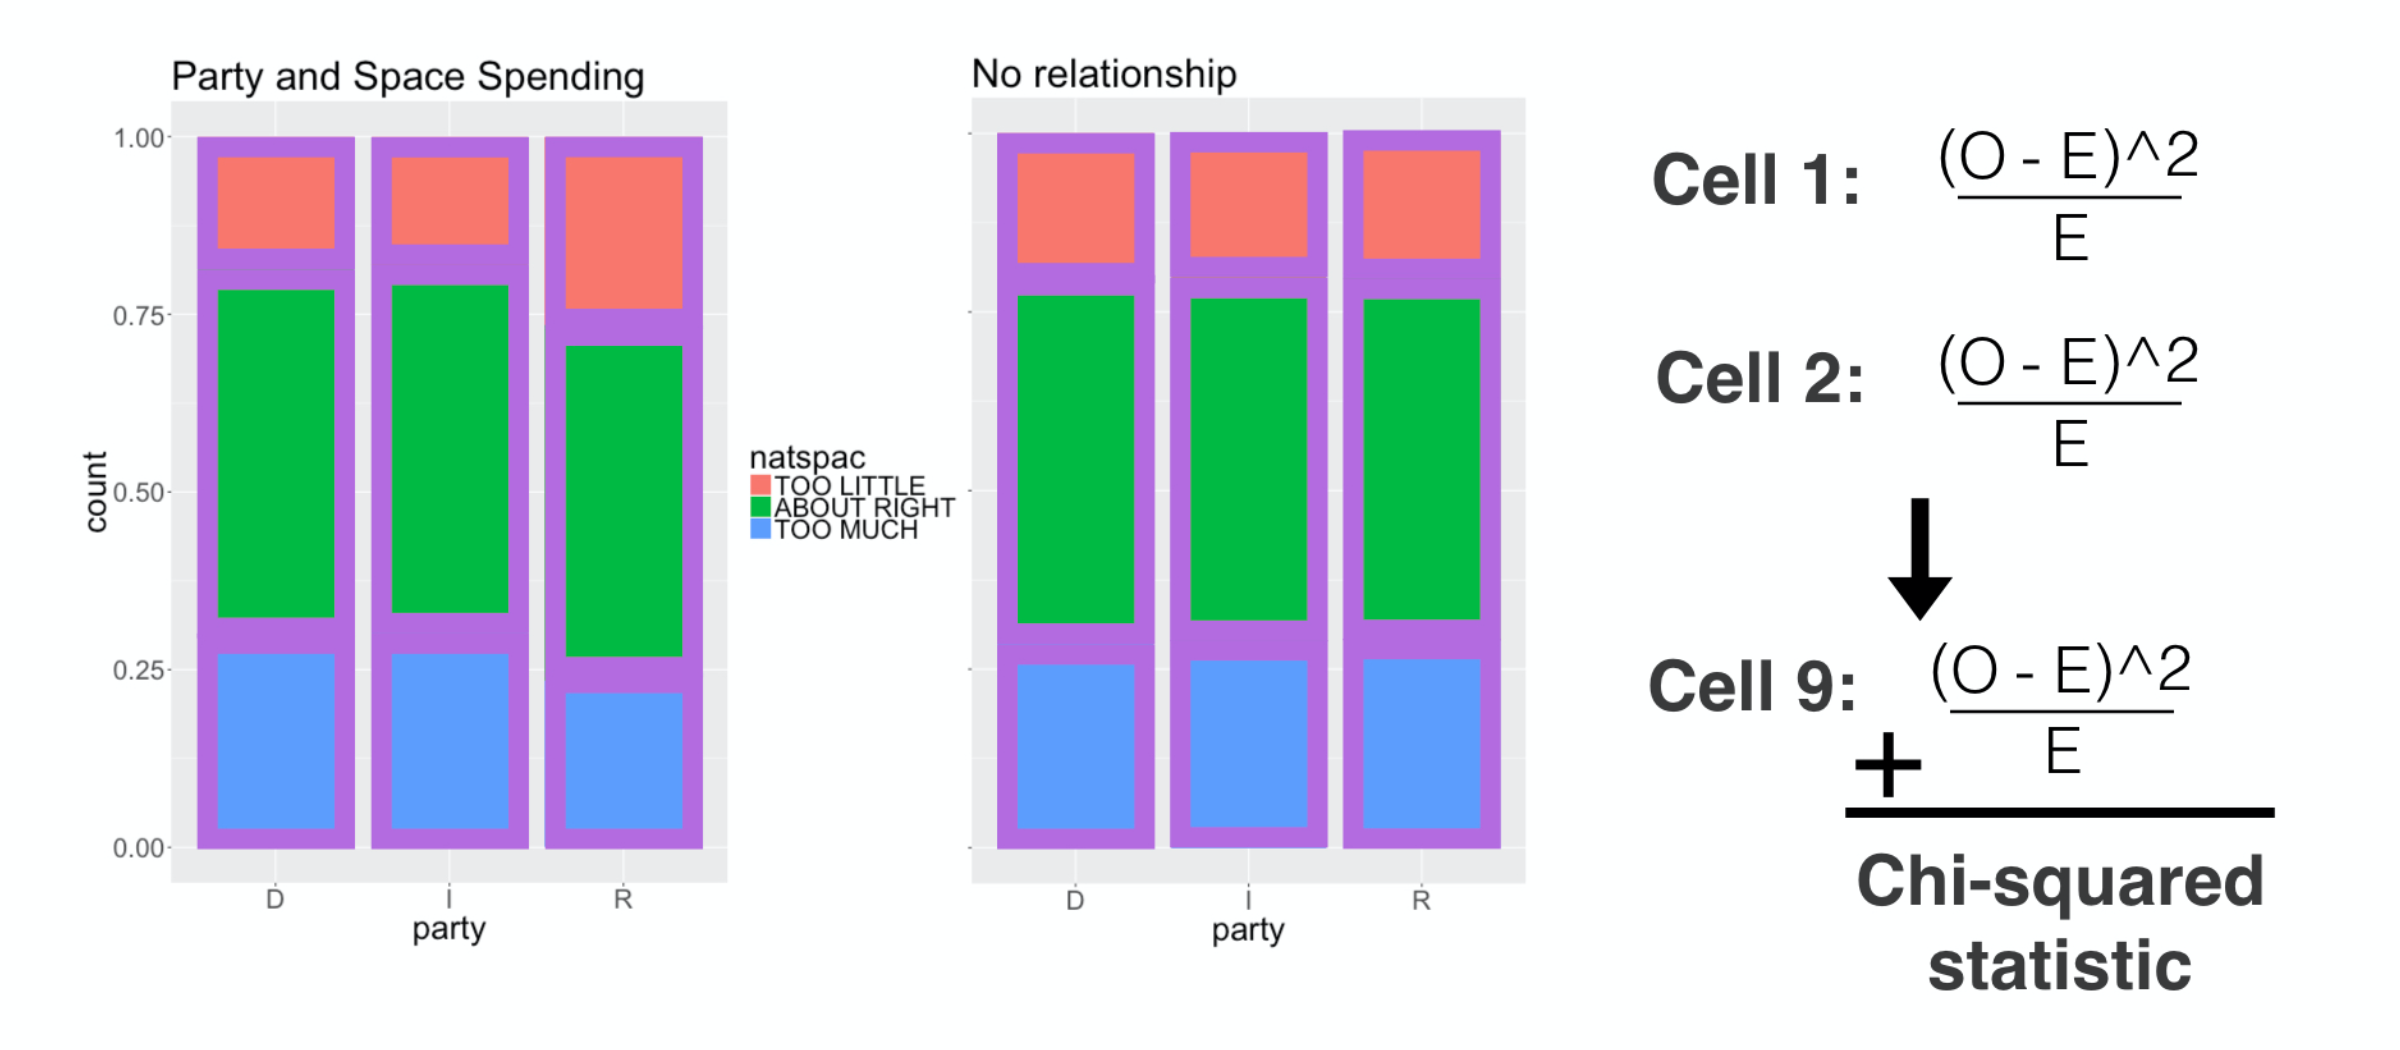
Chi-squared distance
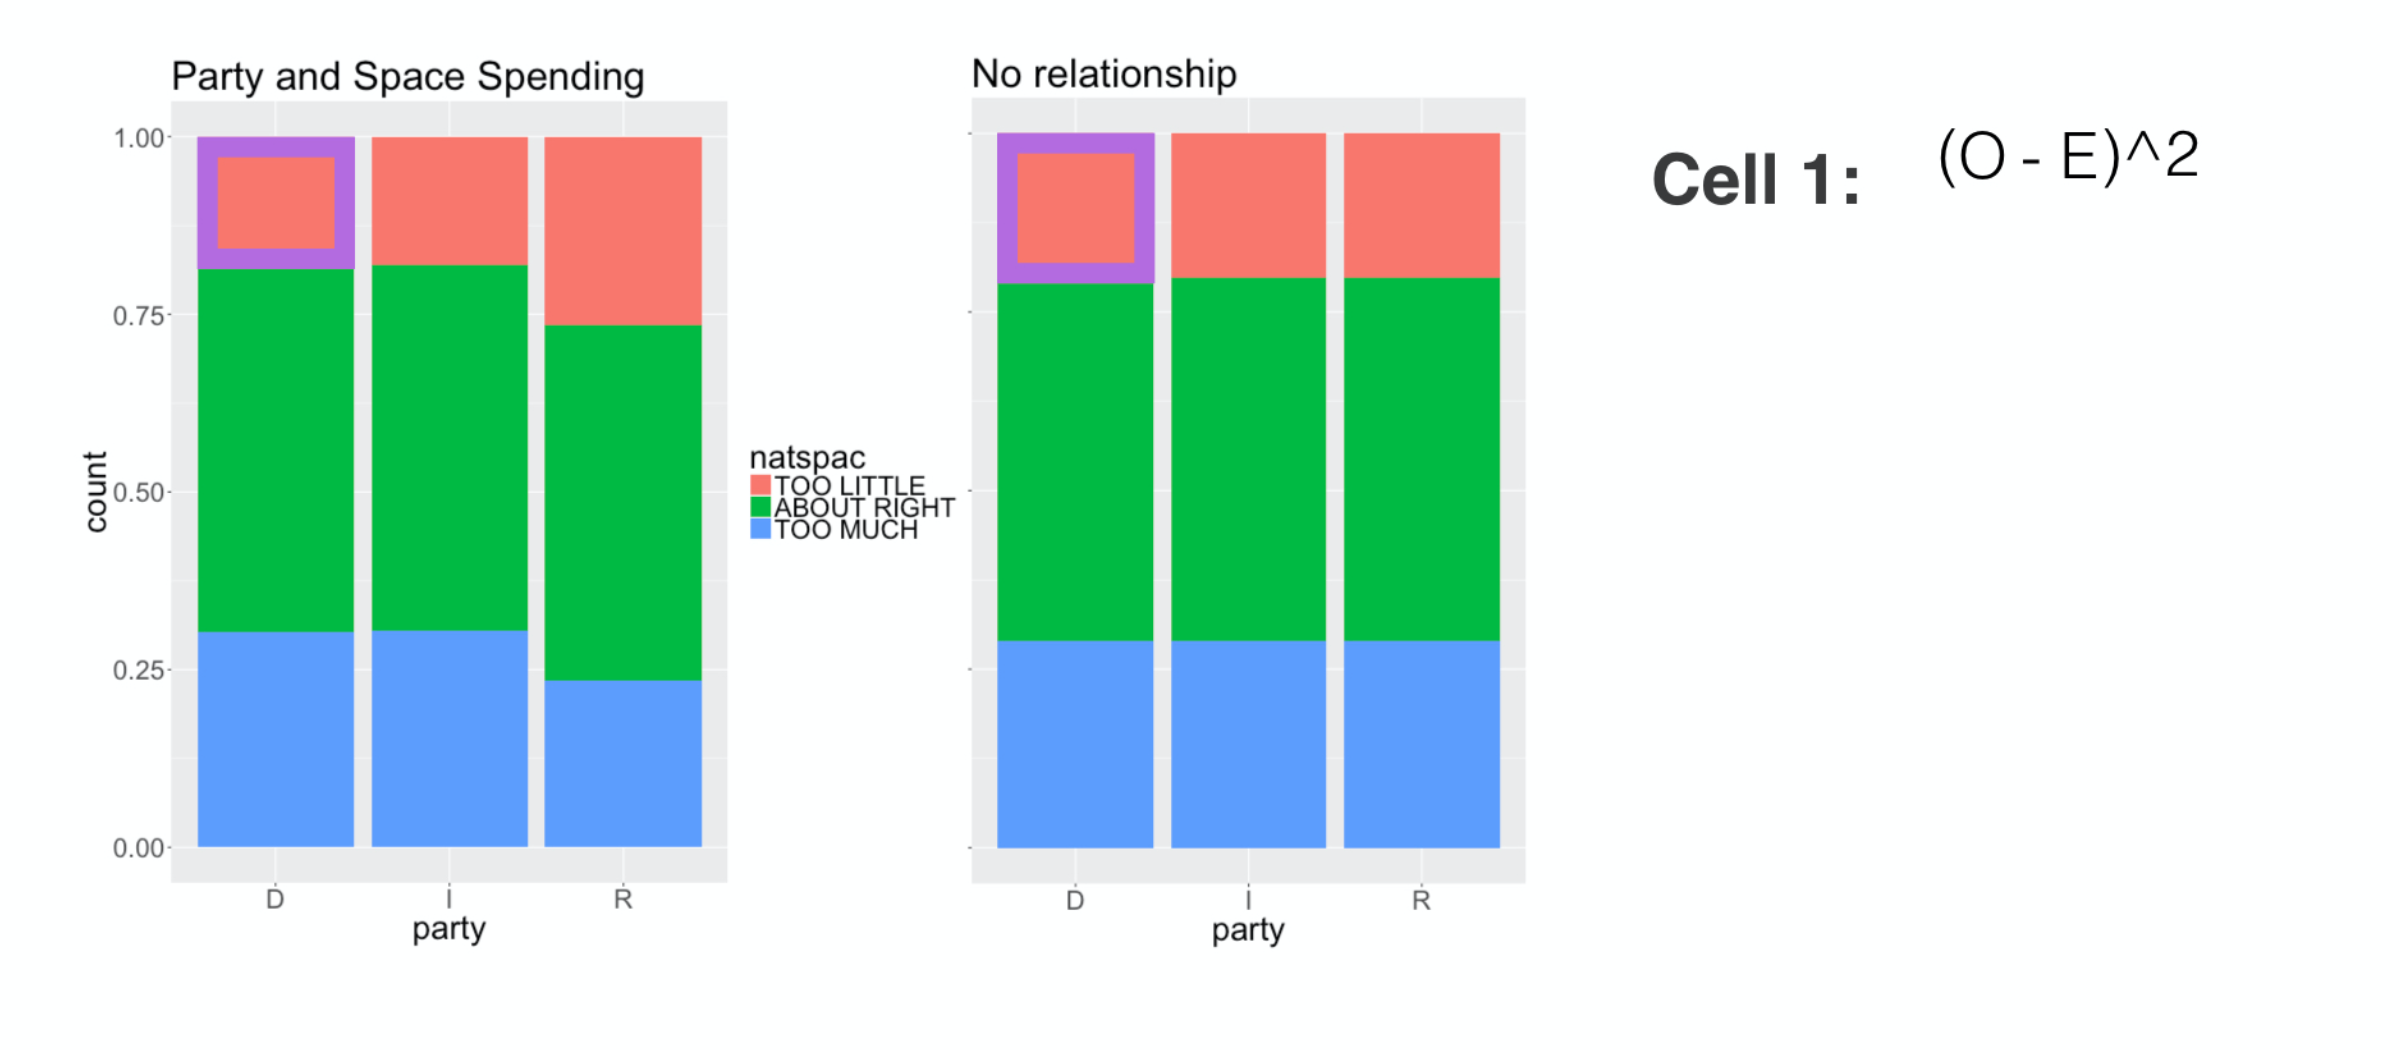
Chi-squared distance
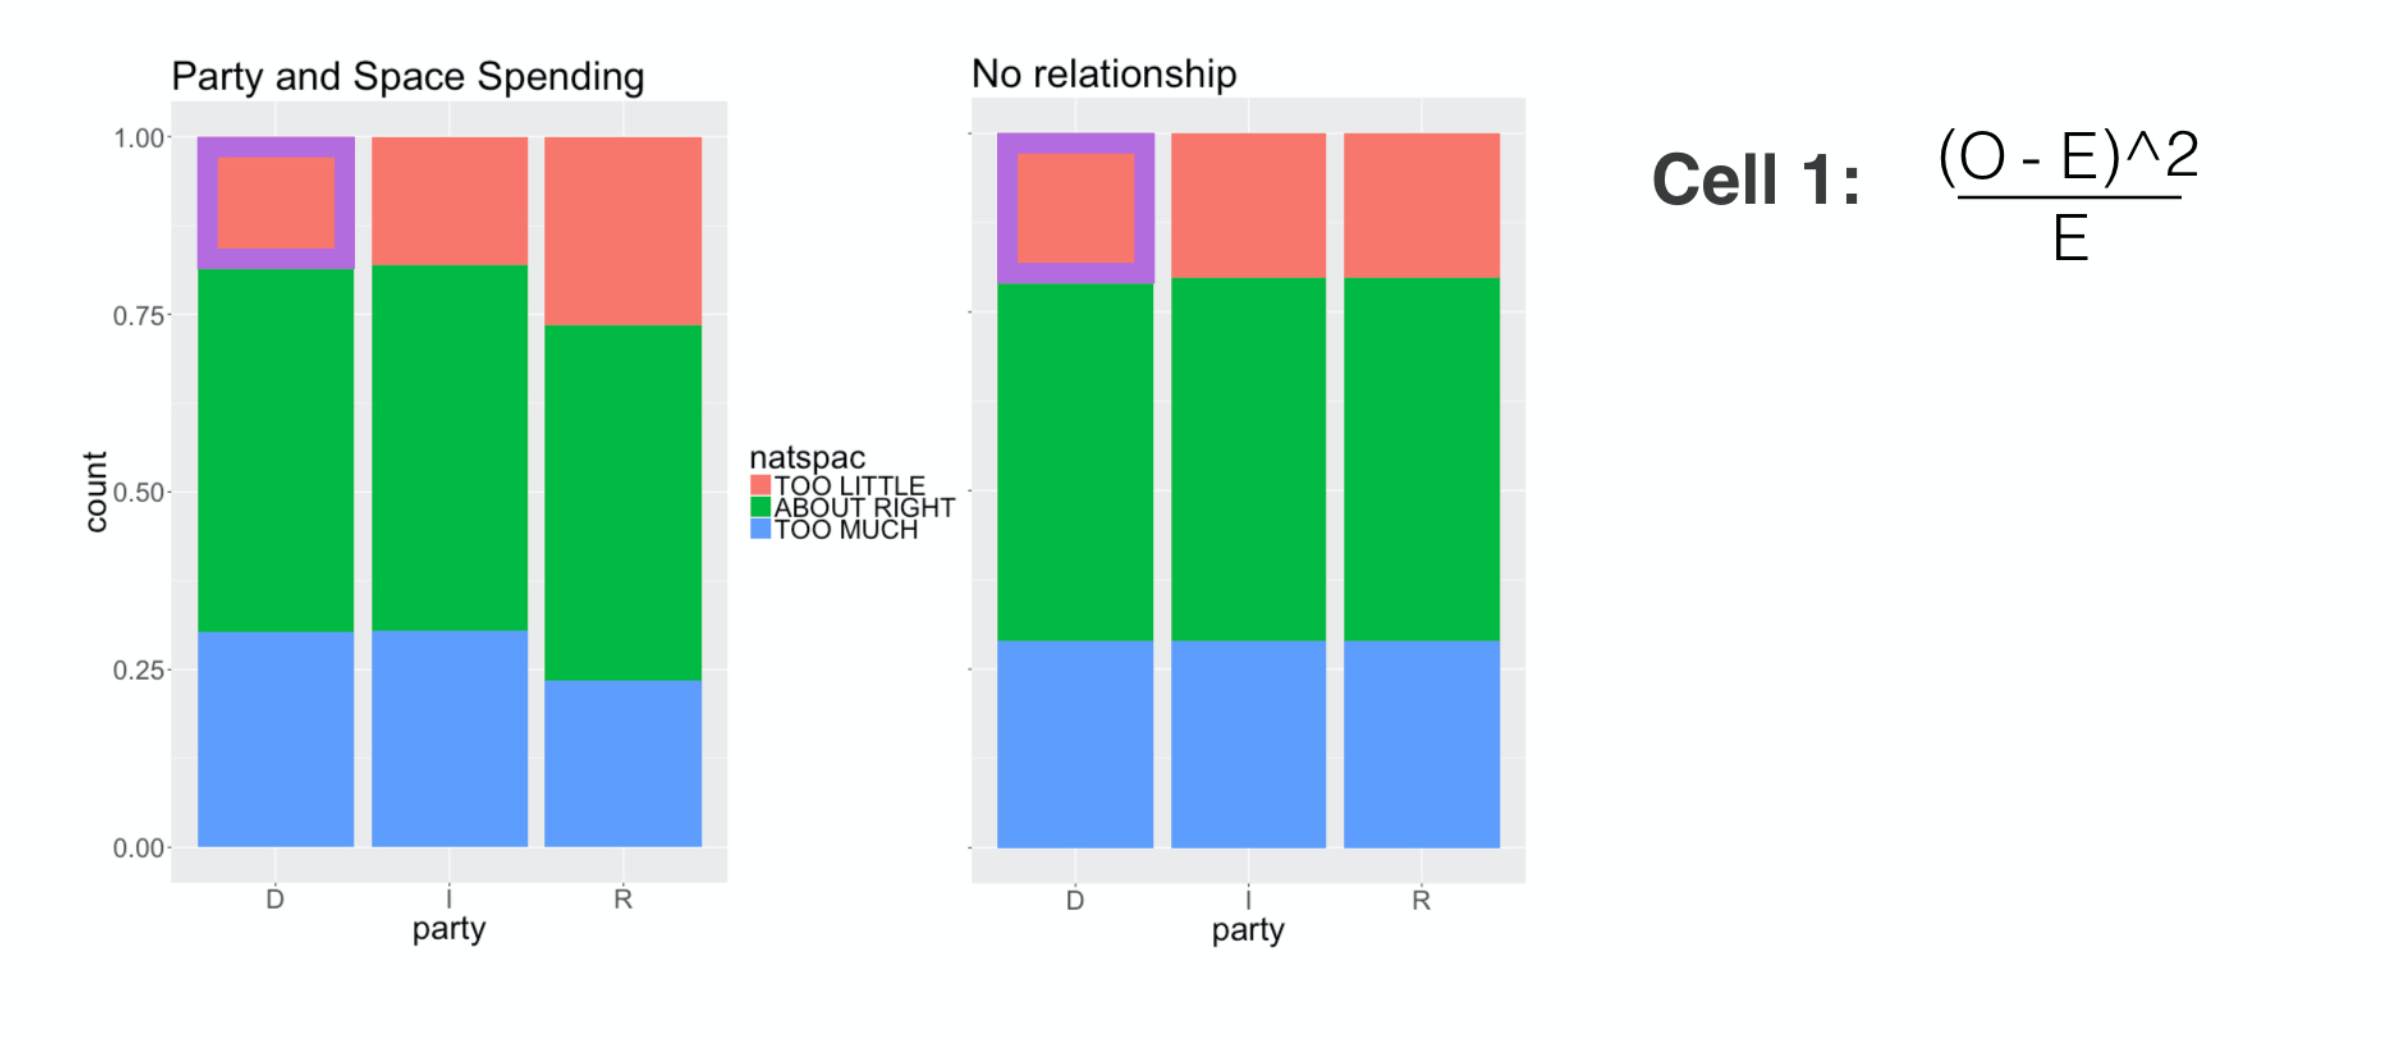
Chi-squared distance
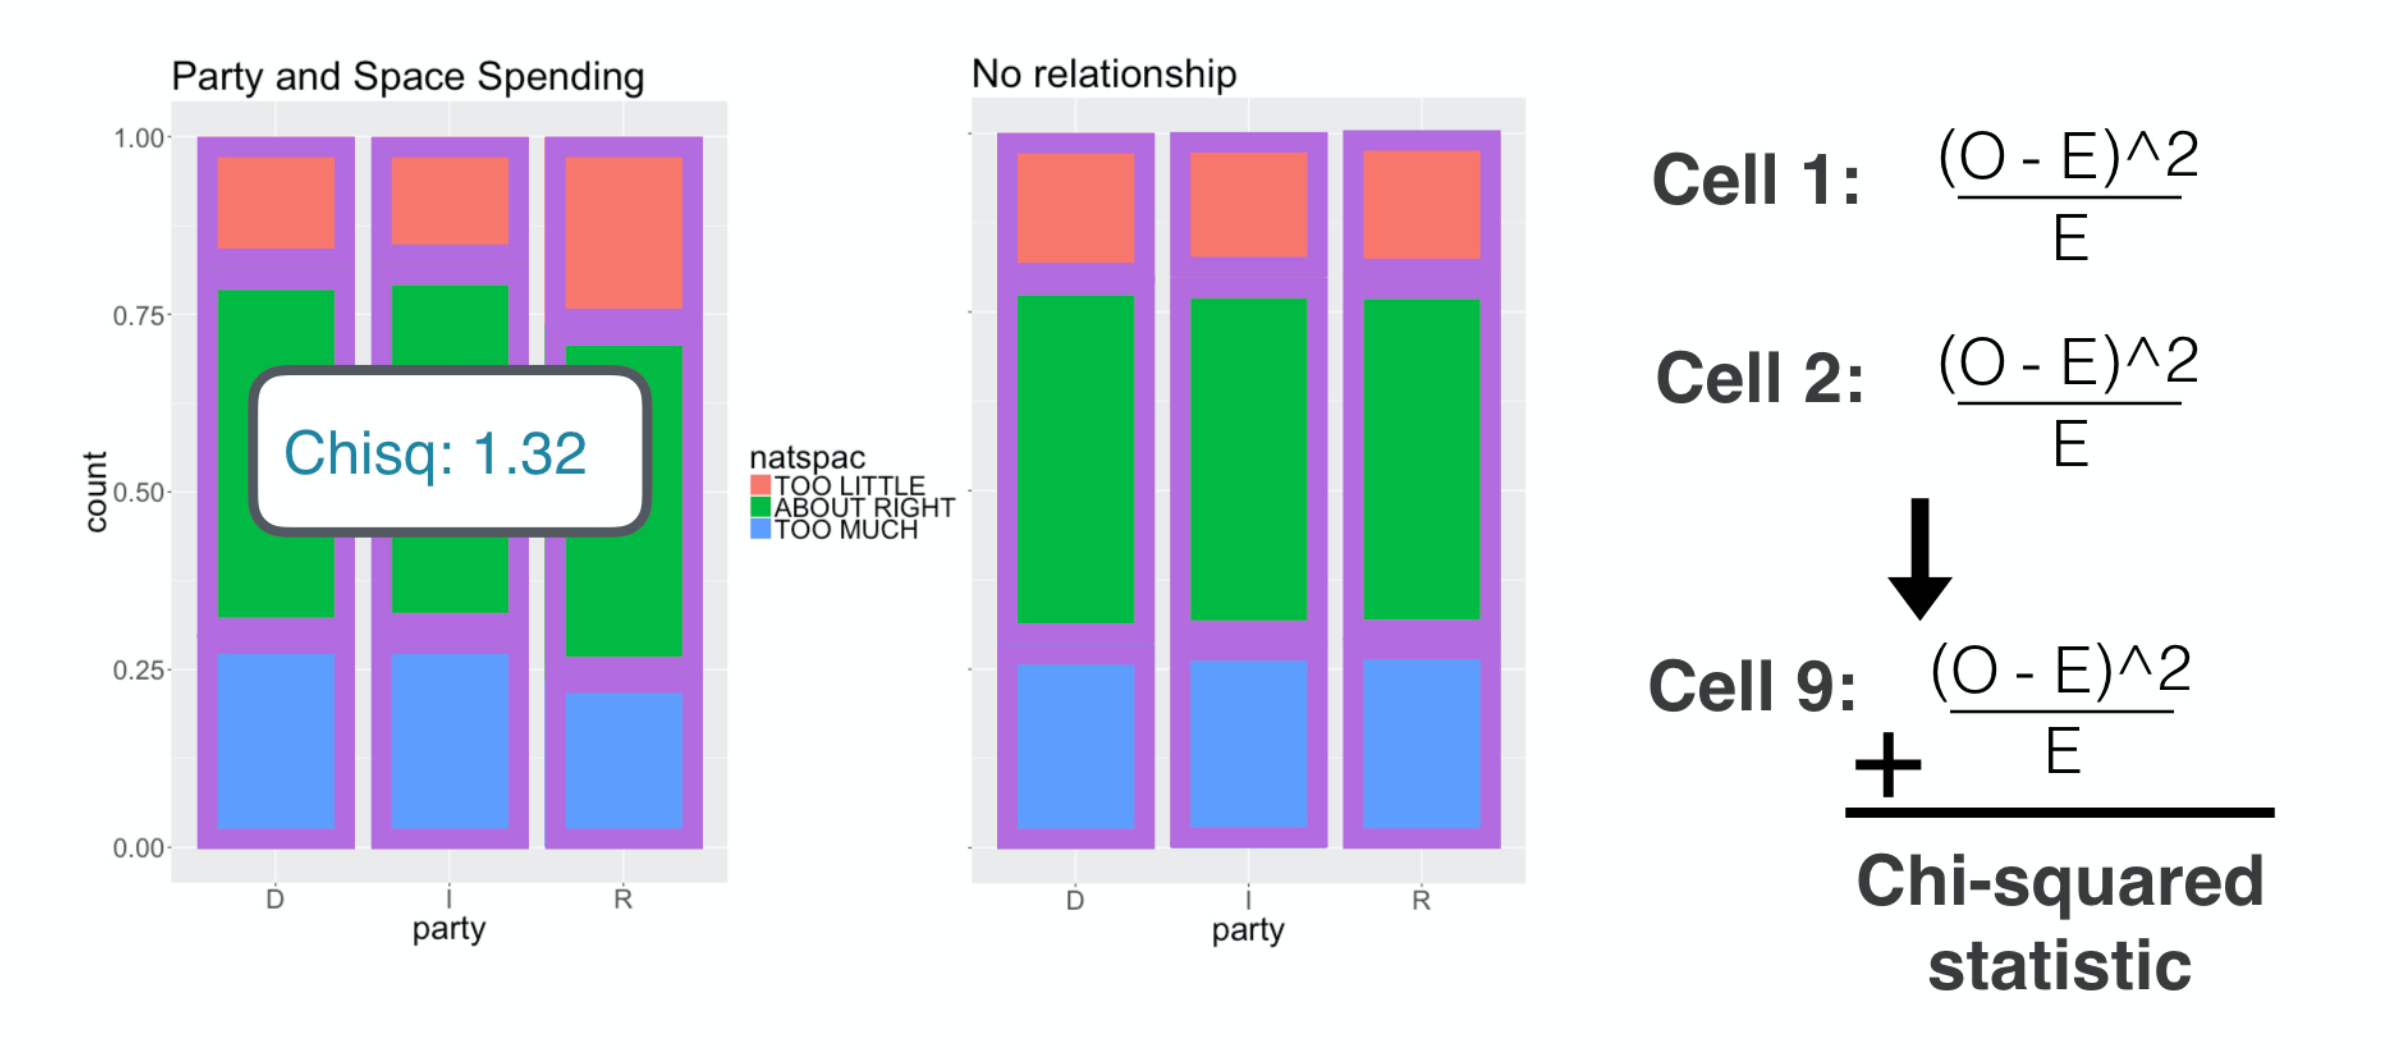
Chi-squared distance
Chi-squared distance
Chi-squared distance
First Digit Distribution
First Digit Distribution
First Digit Distribution
First Digit Distribution
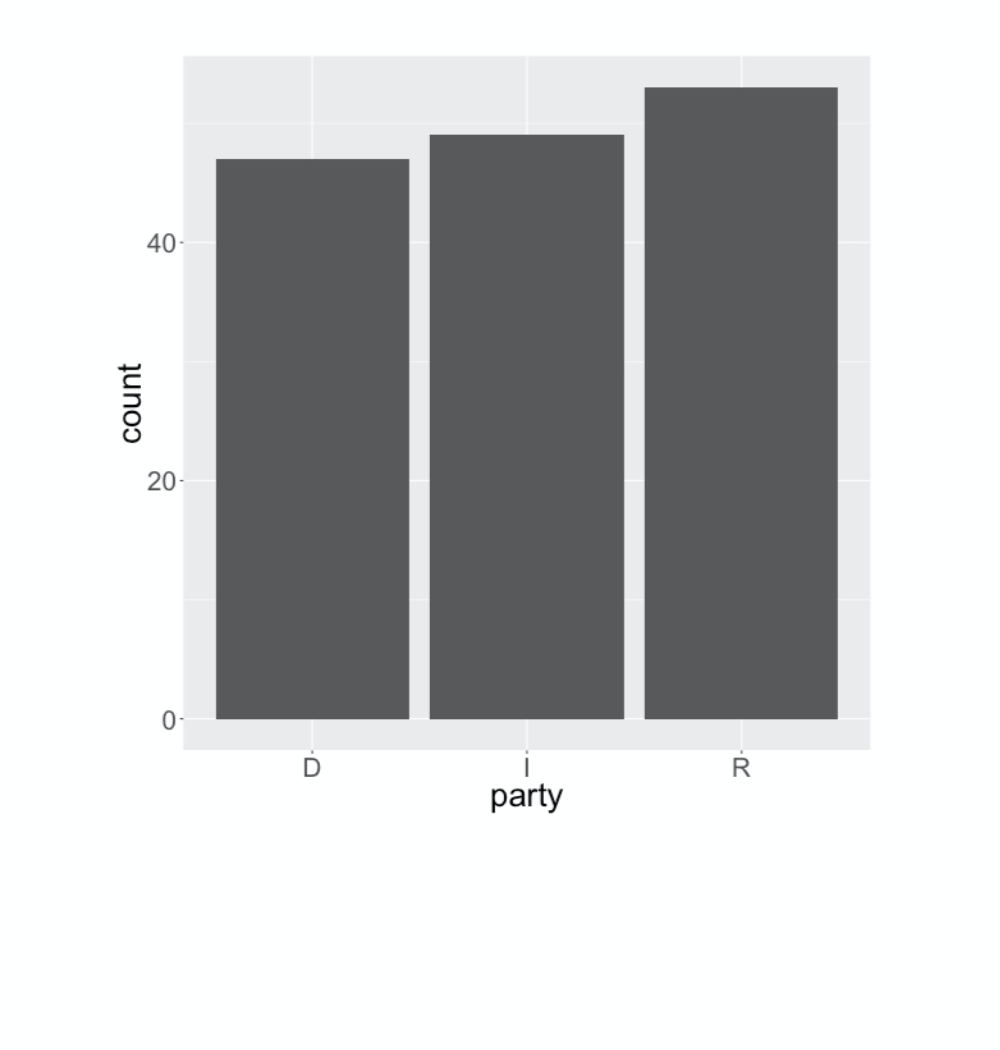
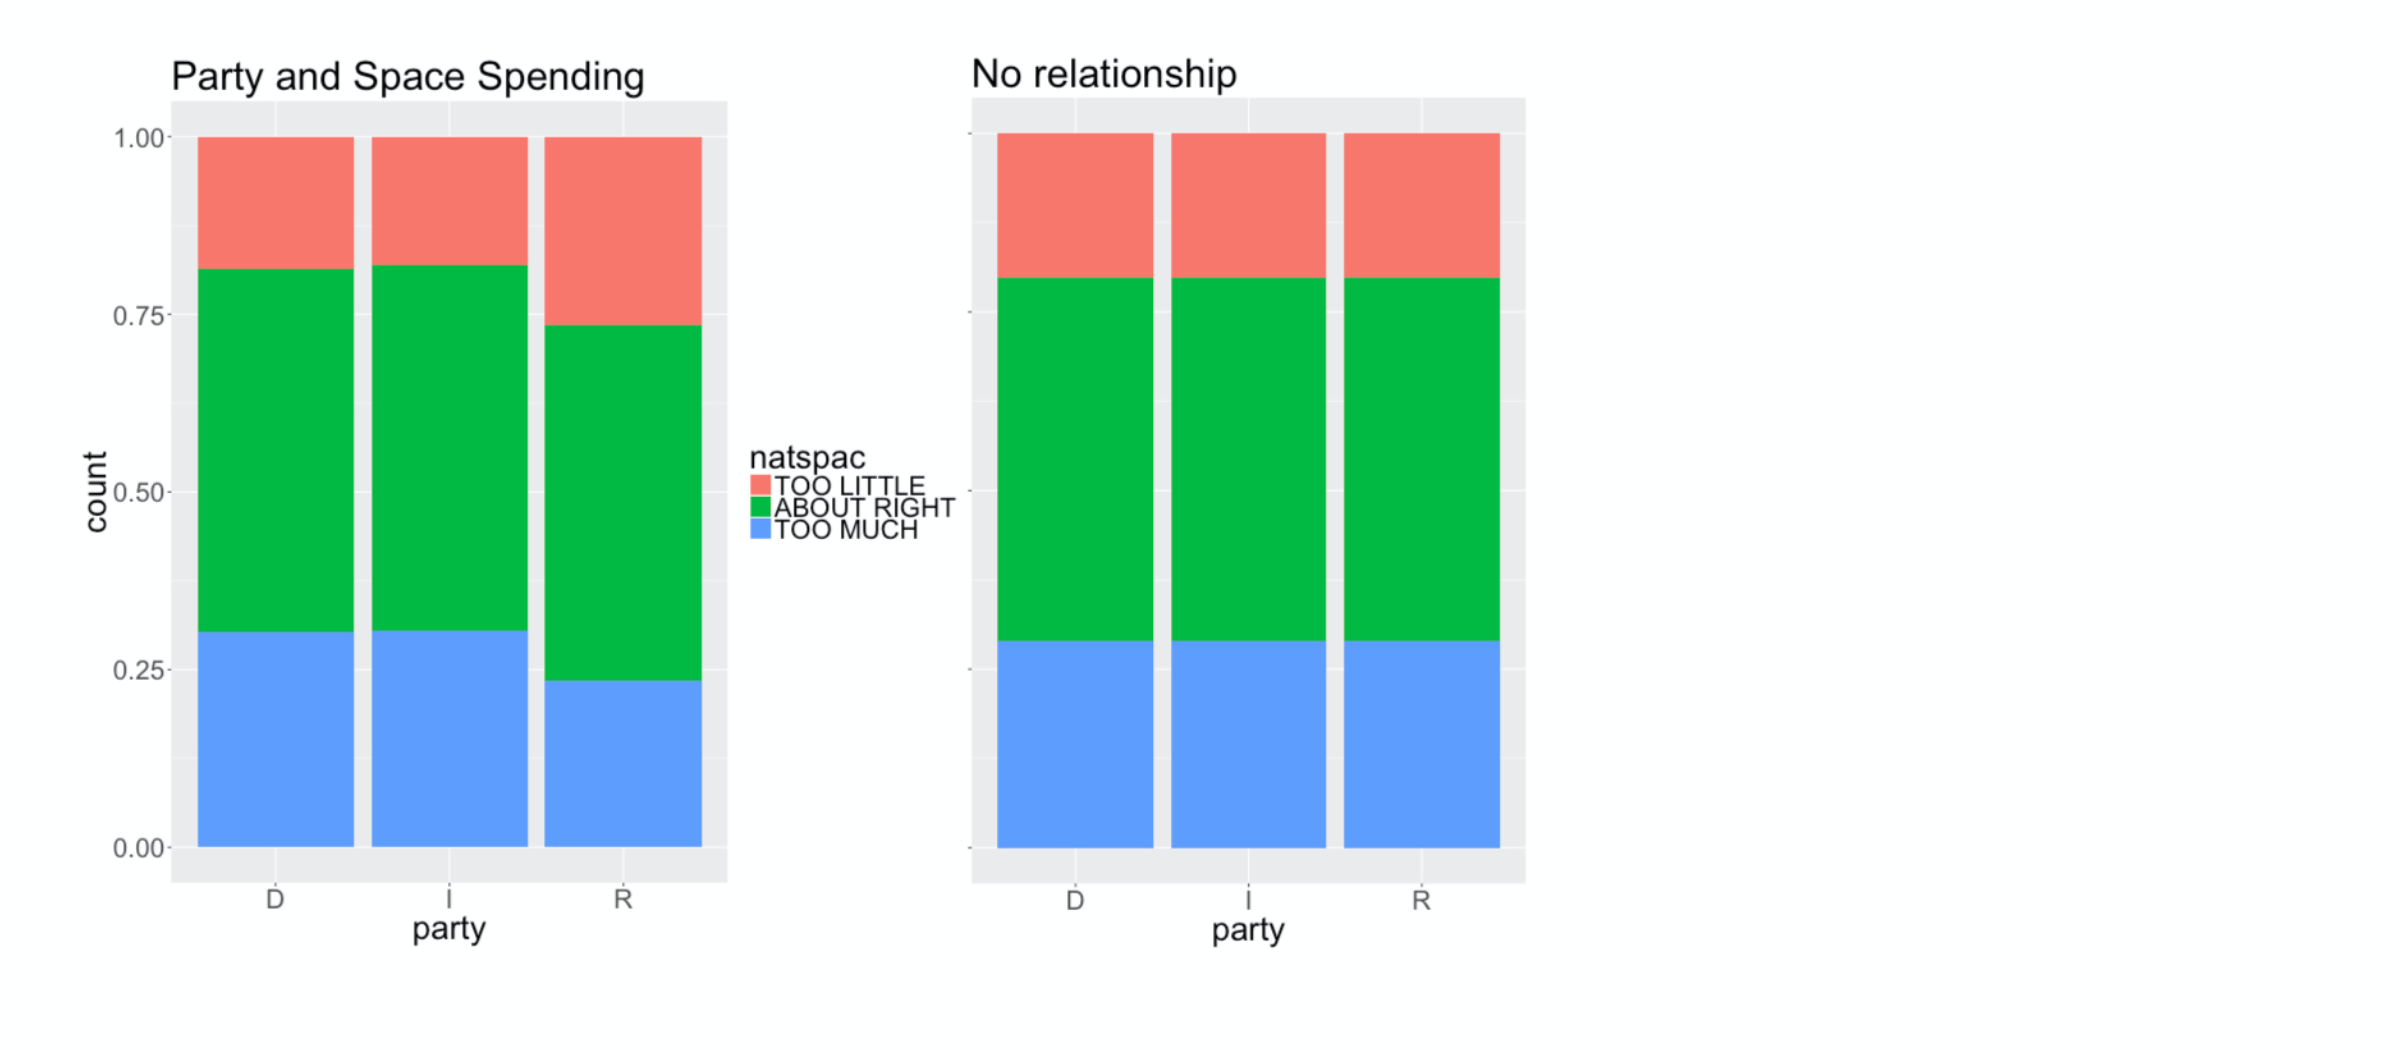
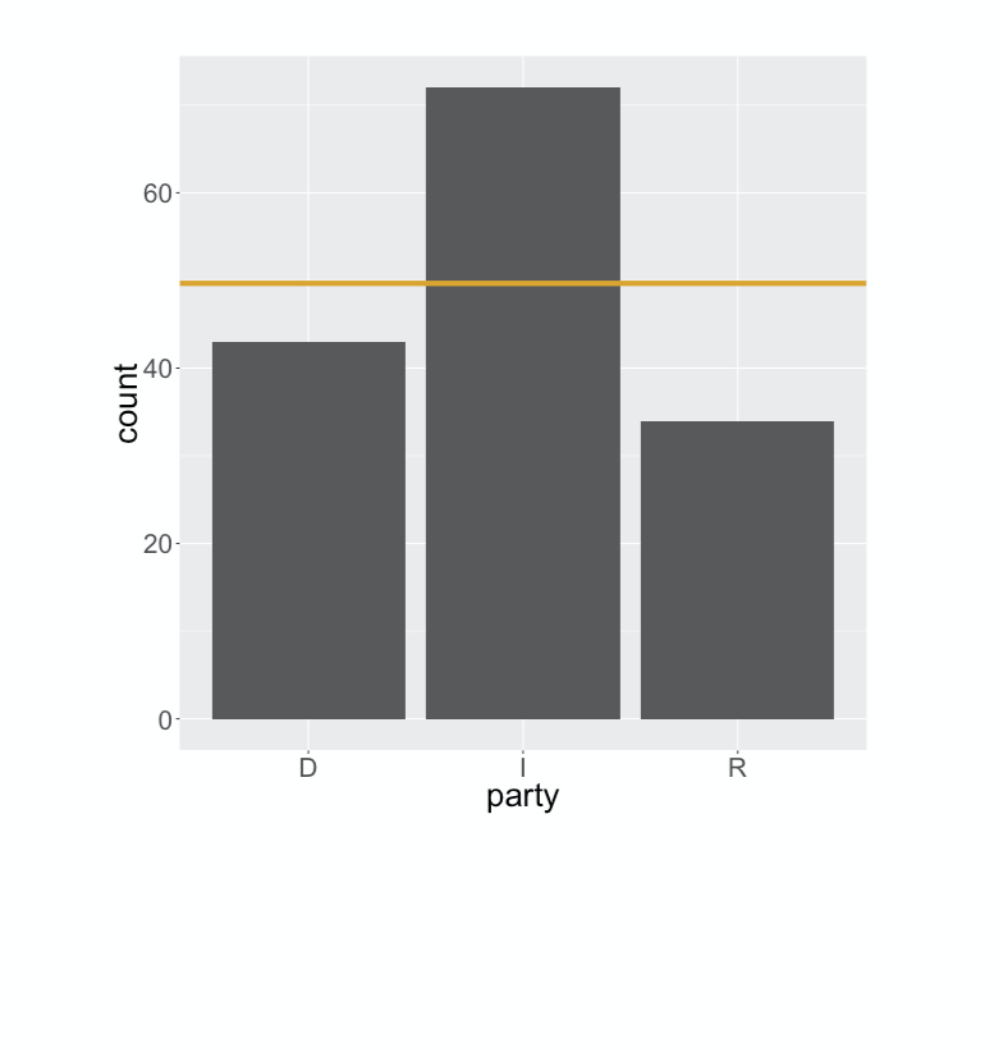
Example: uniformity of party
Simulating the null